

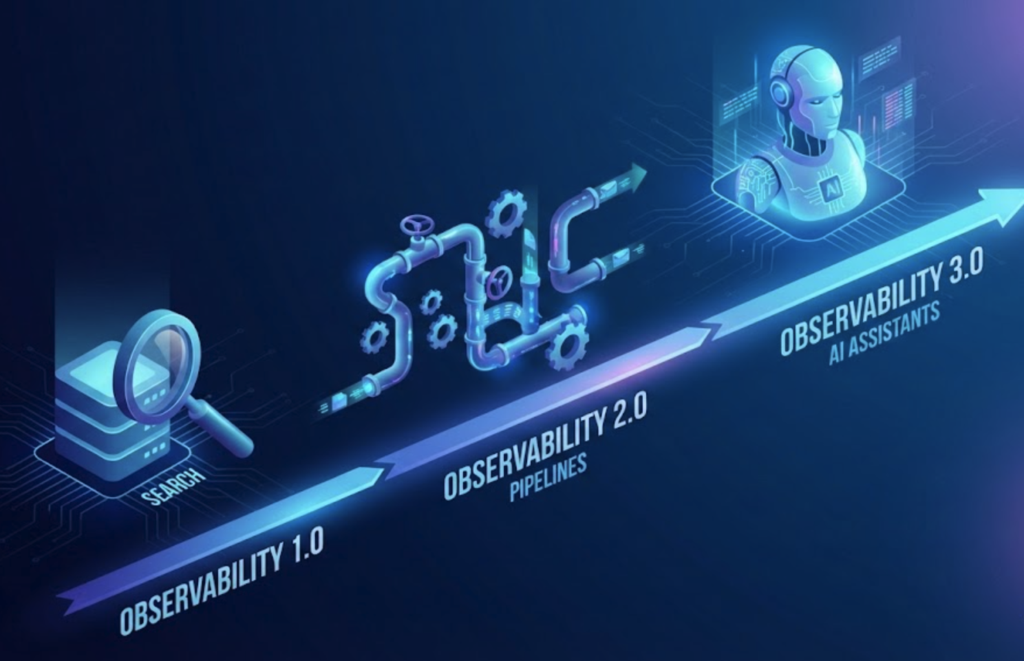
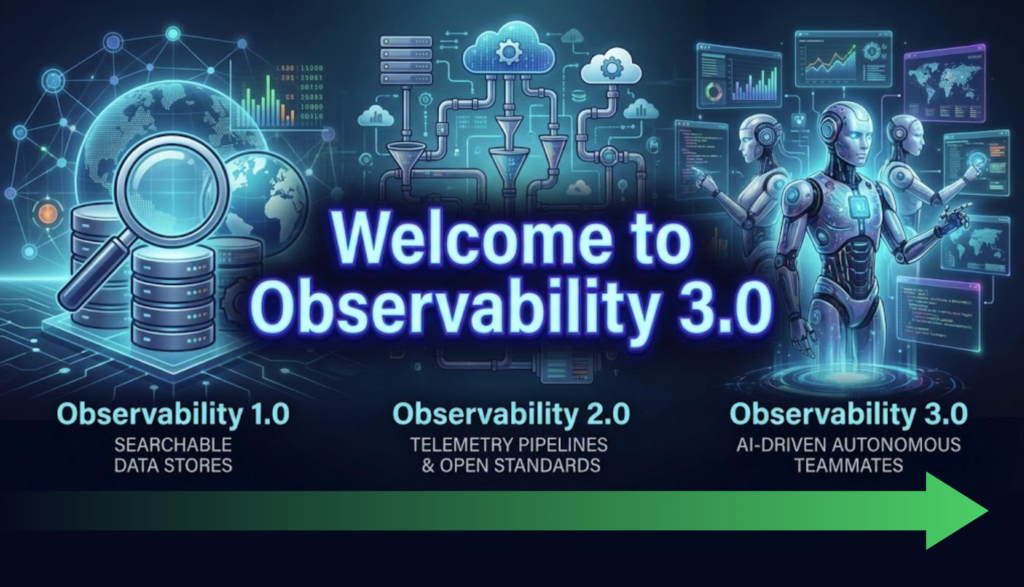
Modern software systems have become increasingly complex, generating massive volumes of logs, events, metrics, and traces. Over the past two decades, engineering teams have responded by evolving their observability practices through three distinct eras. We have progressed from Observability 1.0, defined by centralized, queryable data stores, to Observability 2.0, which introduced telemetry pipelines and open standards, and now to Observability 3.0, the current AI-driven era of intelligent, agentic teammates. Each era built upon the last, moving from manual querying, to automated data processing, to autonomous AI assistance.
There are profound business and engineering implications along this journey, which ultimately aims to reduce the cognitive load on engineers and empower them to focus on creativity and innovation. Let’s not be afraid to free humans from toil and let them do their most creative and rewarding work.
Observability 1.0 — The Age of Searchable Data Stores
The first generation of observability, which I’m officially dubbing Observability 1.0, emerged in the late 2000s alongside tools like Splunk, the ELK Stack (Elastic), and later Datadog. This era was built around the traditional “three pillars” of telemetry: logs, metrics, and APM/traces. Organizations stood up multiple siloed systems (log indexes, time-series databases, APM/trace stores) and engineers queried each to infer their system’s health. Splunk, for example, pioneered centralized log indexing and search, enabling engineers to comb through application logs in real time using a powerful query language.
Ultimately these tools provided unprecedented visibility. Teams could detect and investigate issues like never before. Splunk was (and still is) very good at what it is built for: searching and investigating. Real-time, queryable data stores meant you no longer had to log into servers to grep log files; you could analyze everything centrally. Businesses benefited through faster troubleshooting than in the old monitoring days, improving uptime and customer experience.
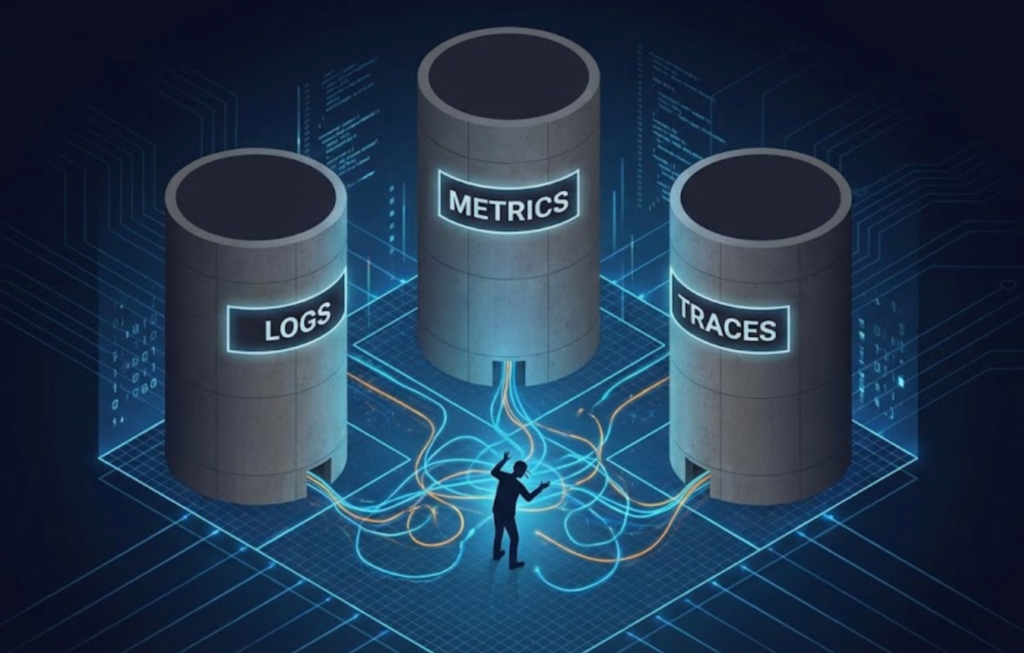
In the early days, each different category of data was kept in a completely separate silo
However, Observability 1.0 came with significant challenges. I like to think that companies have DNAs from their creation, and in these early days you could see what top tools existed for each category.
Logs: Splunk, Elastic, Sumo Logic
APM: AppDynamics, New Relic, Dynatrace
Metrics: Datadog, Graphite, SignalFx (acquired by Splunk)
Because each telemetry type often lived in a separate tool, engineers had to swivel-chair between interfaces and mentally correlate data. The “three pillars” approach inherently created data silos and operational complexity. Teams also had to either write a complex log query to aggregate data into time-series, or pre-define what to collect (instrument APM or choose which metrics to track) and hope those would suffice during incidents. If an outage was caused by something you weren’t indexing or measuring, traditional monitoring wouldn’t catch it.
Datadog and others unified metrics with traces and logs, giving teams dashboards and alerts across these data types. The hallmark of Observability 1.0 was interactive querying: if something went wrong, an on-call engineer would manually search through graphs then logs to find the needle in the haystack. I heard countless physical analogies in those years that included concepts like machines to process tons of hay or magnets to magically pull out the needle (which apparently doesn’t work very well because most needles are supposedly stainless steel). In any case, tools like Datadog and Sumo Logic were “true multi-tenant SaaS” that lowered the effort bar and caused lots of engineering teams to modernize the monitoring of their production systems.

How many times have we heard “needle in a haystack” when it comes to finding root cause?
But, as system scale grew and services proliferated, data volumes exploded and so did costs. Indexing every log line in Splunk or Datadog could become prohibitively expensive; many organizations faced six- or seven-figure (or eight-, for the absolute biggest) annual bills for these platforms. In lots of cases, teams even had to disable logging because they hit the affordability limits of their ingest license, sacrificing visibility due to cost. I remember watching the market transition from “we need to store every log for audit and compliance” to “there’s no possible way you could store every log at these volumes” in real time. Clearly, a new approach was needed as we were already well into the cloud-native, microservices era.
Observability 2.0 — Pipelines, Open Standards, and Automation
Before telemetry pipelines, it was quite the challenge to understand all the individual sources and destinations
Observability 2.0 arose in the late 2010s as a response to the scale and cost pain points of 1.0. This era is characterized by telemetry pipelines and vendor-neutral, automated data processing. Instead of dumping all data into one expensive system, teams began to insert intelligent pipelines to route, filter, and preprocess telemetry. Tools like Cribl Stream and Edge Delta popularized the observability pipeline concept: a stream-processing layer in the cloud decoupling data sources from destinations. In the early days of Observability 2.0, Cribl took a central cloud approach and Edge Delta took a more distributed edge approach. Both architectures gave you benefits and with these telemetry pipelines, we were able to decouple the data sources from the destinations. In between, all the pre-ingest processing, filtering, aggregating, and enriching happened before finally getting the better data to the right places. These pipelines let engineers shift left to collect and process everything but only store what’s required in observability platforms while archiving the full data sets in object storage like Amazon Web Services (AWS) S3 or Google GCP-GCS, greatly reducing noise and cost. In fact, customers using such pipelines could cut observability data volumes by 30–50% or more without losing insight, or even over 90% if a more aggressive edge processing approach was taken.
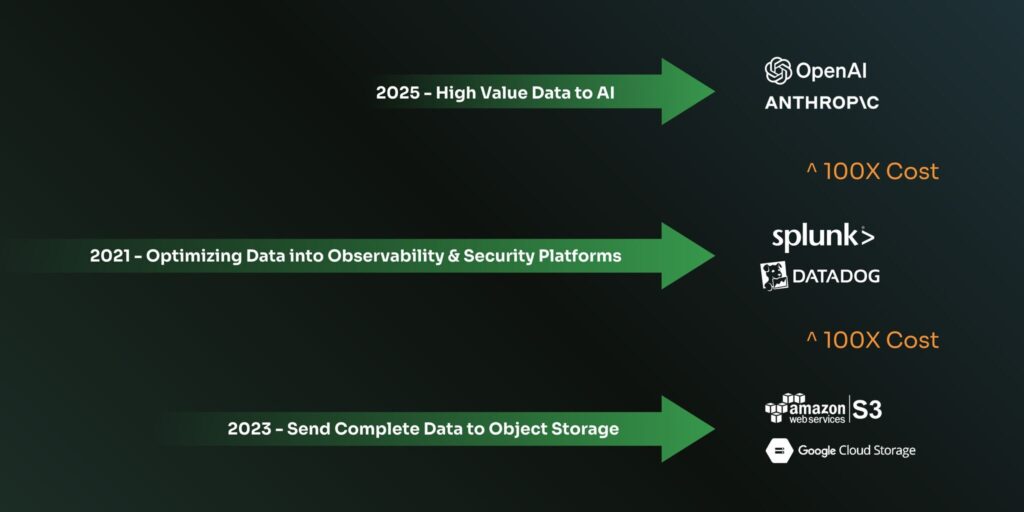
Think Splunk or Datadog is expensive? Using AI will make you understand why operational data needs preprocessing
Alongside the buy-in to telemetry pipelines, the industry started to embrace open standards. A lot of experts and professionals around the industry came together to create and contribute to the rise of OpenTelemetry (OTel), which today still provides a much better observability posture for engineering teams. A big benefit of OTel was that you could take a vendor-agnostic approach to instrument applications and export telemetry data. Instead of installing a dozen different collector agents (one for logs, one for APM, etc.), you instrument with OTel’s SDKs/agents and send data in a standard format. This gave teams flexibility to send metrics, logs, and traces to their tools of choice (or multiple tools in parallel) without being locked into one vendor’s agent or schema.
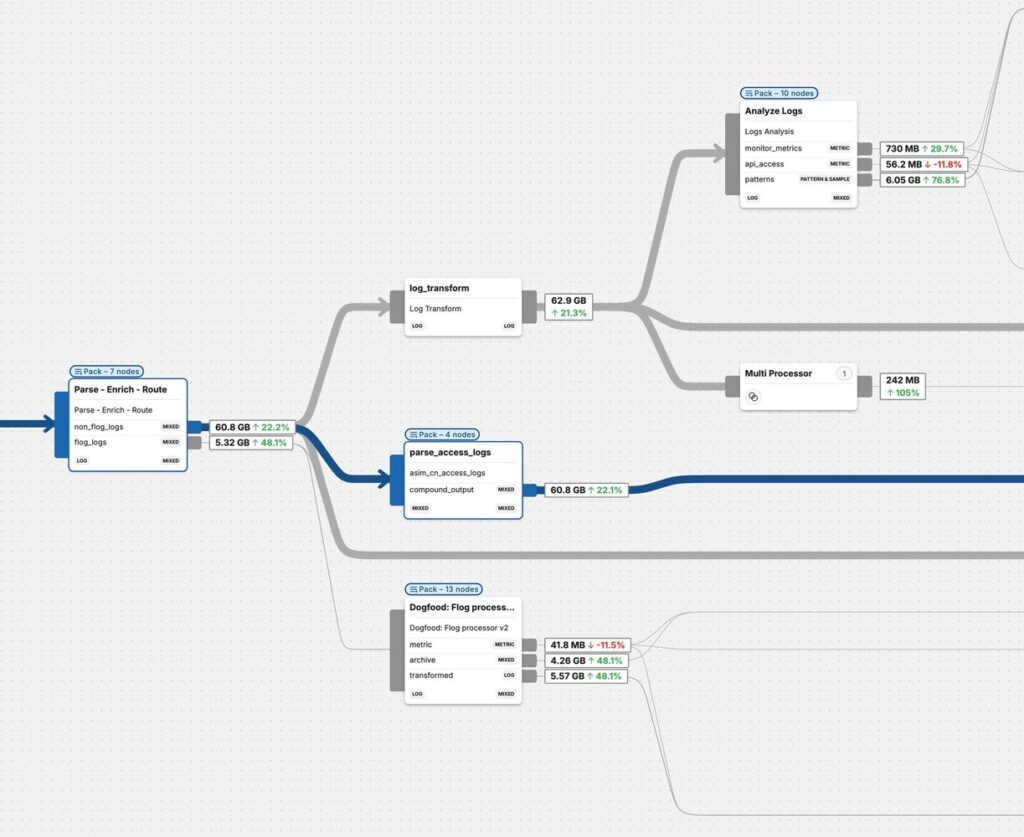
In recent years, OpenTelemetry has quickly gained adoption as the primary open-source method to collect and aggregate telemetry across complex, hybrid environments. Many organizations ran OTel collectors as a pipeline component, doing vendor-neutral collection if they wanted to build and maintain it themselves, or used enterprise ready solutions like Cribl or Edge Delta to further process and route data if the scale required it. For large scale production systems, Observability 2.0 gave us a scalable foundation with telemetry pipelines that made dealing with hundreds of terabytes or petabytes more feasible and cost-effective.
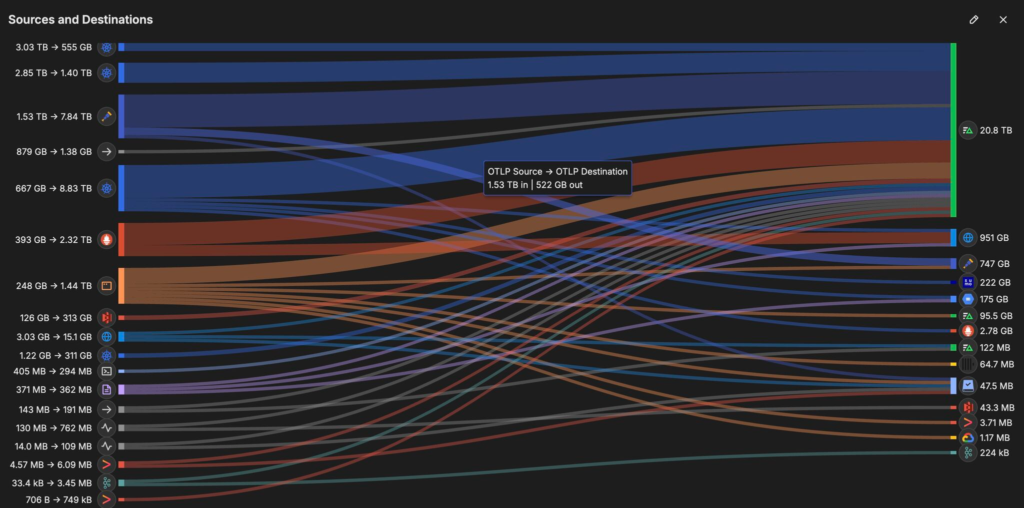
Think this is an eye chart? It’s actually a fairly simple test environment
At the same time, the sheer volume and dimensionality of this new telemetry meant that traditional, rules-based monitoring (static thresholds, hand-built dashboards, and endlessly tuned alert lists) started to hit a ceiling. This is where machine learning began to get meaningfully incorporated into Observability 2.0 — not as a magical “AI that runs ops for you,” but as pragmatic automation layered on top of cleaner, better organized telemetry. As teams standardized on consistent attributes and richer context (service names, environments, versions, trace/span IDs), ML had more reliable inputs and could operate across metrics, logs, and traces in a unified way. Early wins showed up in baselining and anomaly detection (learning what “normal” looks like per service and per dimension), log pattern clustering and fingerprinting (grouping repetitive noise while highlighting novel failure modes), and cross-signal correlation (connecting an error spike in logs to a specific trace path, a dependency, or a recent deploy). In many cases, telemetry pipelines themselves became the pre-processing layer for ML, normalizing fields, reducing cardinality, enriching events, and producing curated “high-signal” datasets that were cheaper to analyze and easier to automate against. The result was a shift toward ML as a signal amplifier: helping teams surface what mattered faster, even if humans still owned the final interpretation.
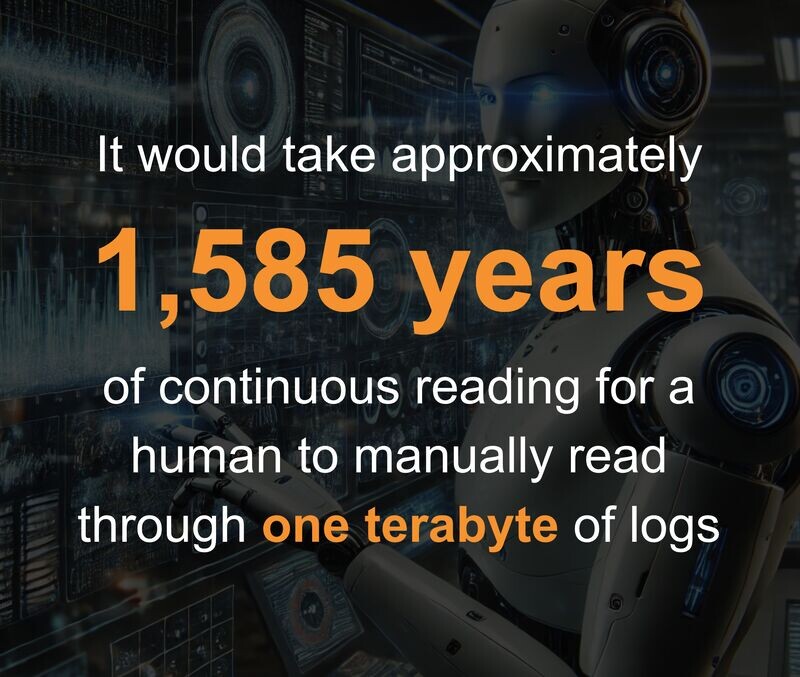
Our systems are creating far too much data a day — well past the limits of what any human can understand in real time
The business and engineering impact of this evolution was significant. Teams no longer had to sample or drop vast swaths of data to control costs. They were capturing everything and then routing high-value signals to premium tools (like Splunk or an APM) while retaining a full copy of the bulk data to within cheap object storage for compliance or later rehydration and analysis. This tiered approach maximized value from each data point and broke the vicious cost vs. visibility tradeoff. It also improved reliability: pipelines with filtering and dynamic sampling reduced system overload and capacity anxiety in logging systems. Open standards further meant that adopting new tools or switching vendors became easier, freeing teams from getting stuck with an outdated 1.0 platform. Engineers benefited from less noise (fewer meaningless alerts) and more time to focus on what the data meant rather than wrangling the data itself. Still, even with these advances, human experts remained on the hook to interpret dashboards and investigate alerts. Although ML was now integrated and Observability 2.0 gave us better organized and curated telemetry, the cognitive effort to analyze incidents was still largely manual. This set the stage for the next leap.
Observability 3.0 — The AI Era of Autonomous Teammates
The pace of innovation is increasing, which means production environments are changing faster than ever
Today, we stand at the beginning of Observability 3.0, an era defined by intelligent, AI-powered assistants woven into our observability fabric. If 2.0 solved data collection and management at scale, 3.0 tackles the next bottleneck: making sense of that mountain of telemetry and taking action automatically and in real time. The explosion of AI is enabling a new class of observability solutions that act as “agentic” AI teammates, not just reports or static dashboards. My opinion is that in a short period of time, we’re going to look back on today and think it was absolutely nuts that we expected humans to manually correlate massive amounts of alerts, dashboards, events, distributed traces, service maps, logs in various formats, and other telemetry signals with any degree of consistent success.
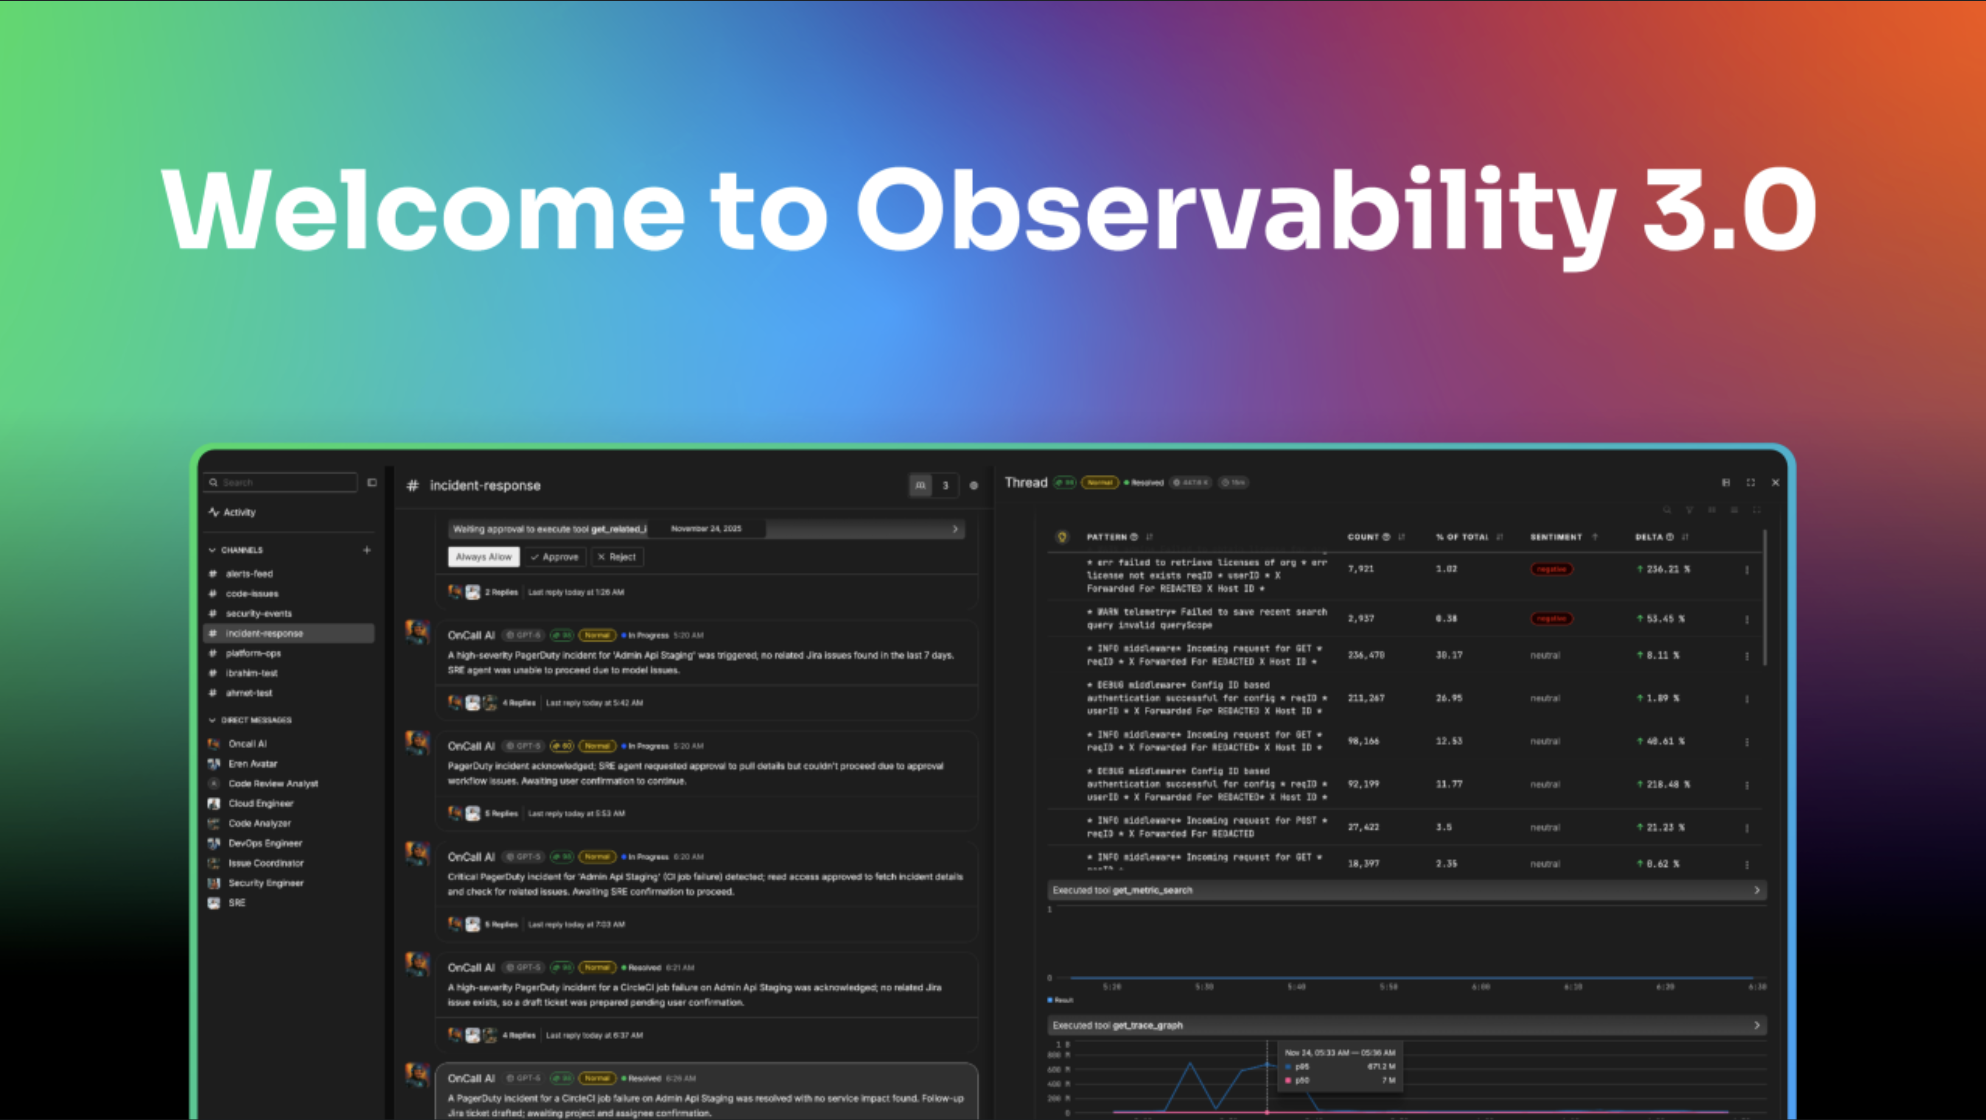
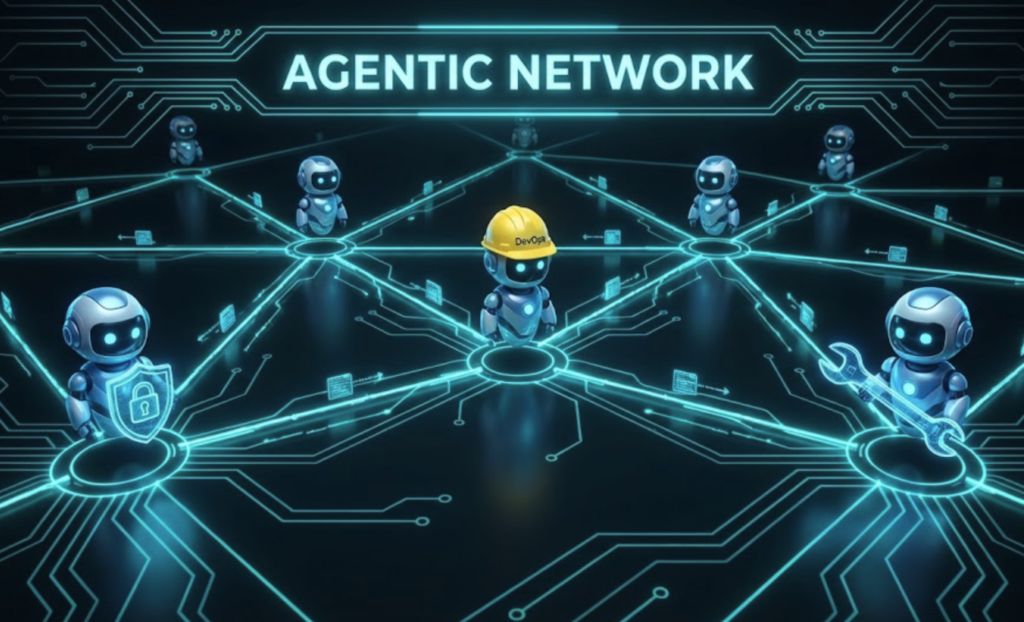
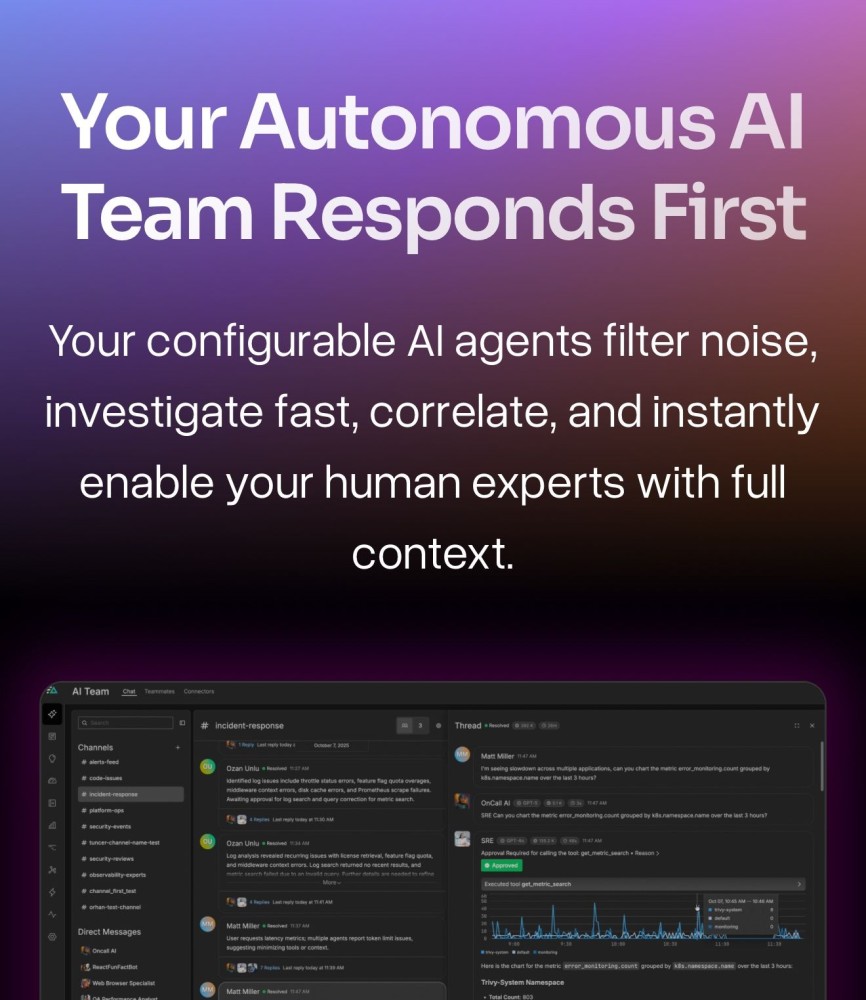
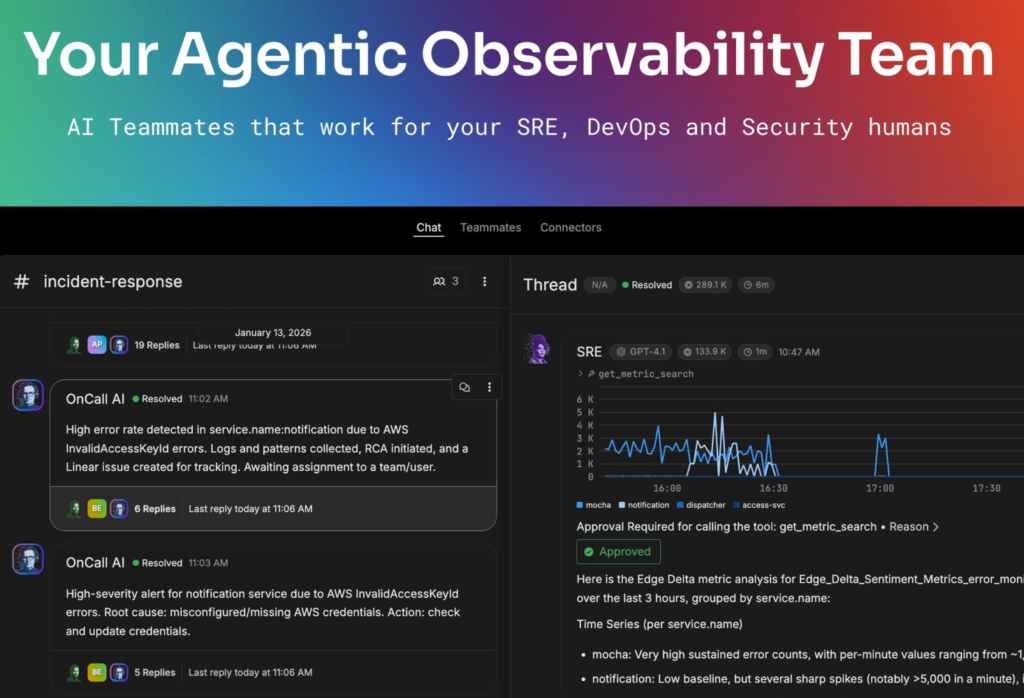
In Observability 3.0, your first responder to an incident might not be a bleary-eyed human wading through logs at 2 AM, but an AI SRE agent that’s already on the case. Edge Delta is leading this charge with Collaborative AI Teammates, essentially a virtual team of role-aware AI agents embedded in your ops workflow. These agents are enabled by a scalable foundation of a next-generation observability stack continuously fed by the rich telemetry streams (courtesy of Observability 2.0 telemetry pipelines) to collaborate with each other and with humans. Today there are specialized agents for SRE, DevOps, Security, and Cloud Engineering, each with their own charter: the SRE Teammate focuses on root cause analysis, incident triage, and post-mortems (finding patterns, correlating signals, proposing mitigations); the DevOps Teammate reviews deployments and configuration changes; the Security Teammate reacts to policy violations or anomalies, and so on. The key is an interconnected fabric consisting of telemetry pipelines, a scalable observability stack, and channels that allow agents to share context and memory with one another. All of this is coordinated via an OnCall AI orchestrator, ensuring the right tasks are addressed by the right AI expert and ultimately that the result is a success.
It is critical to setup observability in a way where AI can work with data to share context and memory and collaborate
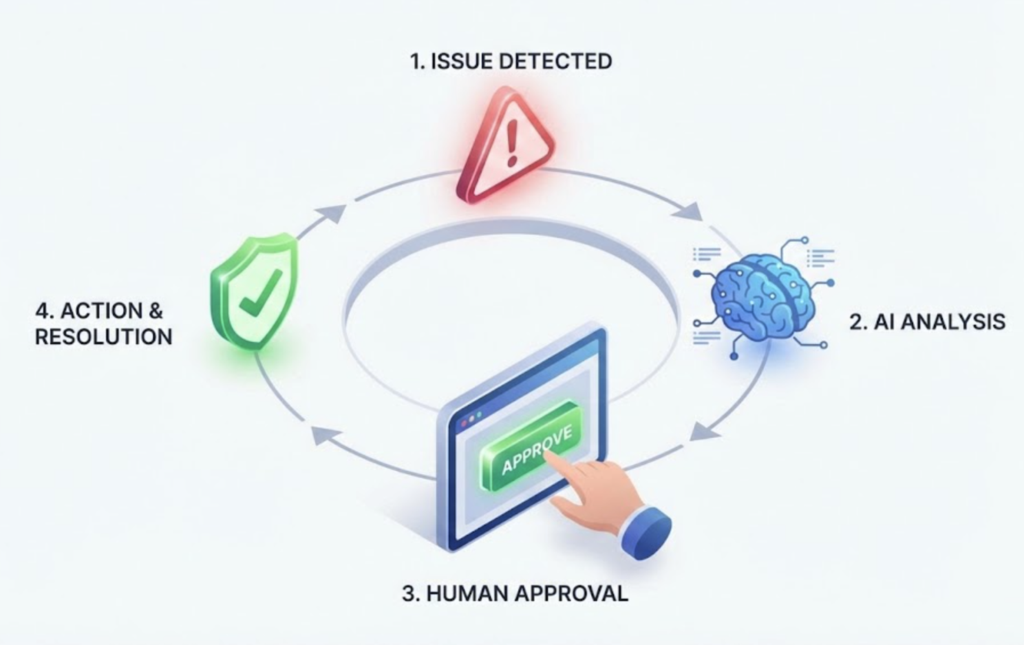
Once you’ve done it in this new agentic way, it really is hard to go back. AI Teammates make recommendations and take actions using information gathered from raw data streaming through telemetry pipelines to complex root cause investigations. This means they can safely connect generative AI to live production data without losing human control. In practice, this looks like AI agents that can detect anomalies in real time, explain the probable root cause, and even act — for instance, they might auto-generate a remediation script or open a ticket with a summarized incident timeline. All of this happens while keeping humans in the loop: high-impact actions still require a human approval, and engineers can always intervene or guide the AI’s analysis.
It’s also critical to call out: doing this in a secure and scalable manner is top priority to any business. Although Observability 3.0’s AI Teammates provide a lot of value, it’s the enterprise safeguards that make it possible. The existence of telemetry pipelines offer the data guardrails that give complete control over which data is made available to AI, and RBAC for these agents provides the definitions for what read and write actions can be performed. Again, we’re keeping the human in the loop wherever required.
For the foreseeable future, humans need to stay firmly in the loop
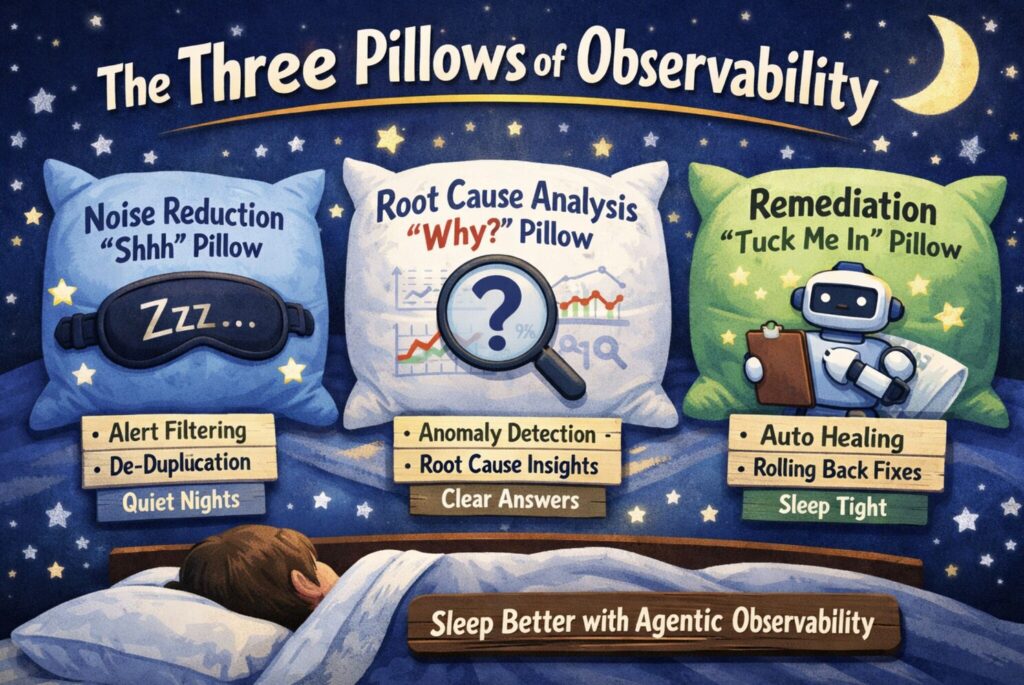
The business implications of Observability 3.0 are exciting and far-reaching. Engineering productivity leaps upward as the AI Teammates shoulder the tedious work of combing through dashboards and logs for every incident. When people finally jump in, the context has already been gathered, so they aren’t running around trying to stitch the picture together. The cognitive relief from the noise reduction alone is immense. Instead of waking up to a sea of alerts and an empty notepad, an on-call engineer might be greeted by an AI-curated incident thread: all relevant logs, metrics, traces, code changes, and even a hypothesis of the root cause neatly compiled. This lets the human expert confirm and resolve the issue in a fraction of the time it used to take. Better yet, many issues never wake up a human at all. Though we have a ways to go, eventually AI teammates can handle routine anomalies or auto-rollbacks, reserving human intervention for truly novel or high-risk problems. Companies adopting AI Teammates are seeing not only faster incident resolution but also reduced burnout and on-call fatigue. It’s the logical extension of AIOps (for real this time) but deeply integrated with the observability data and workflows that DevOps/SRE teams live in.
Metrics charts, log queries, aggregated views — these can be done before the human gets out of bed
In practical terms, this enables engineers to shift from being system babysitters (reactively fighting fires at all hours) to system improvers and innovators. We’ve all dealt with a false positive alert. Some of us have dealt with hundreds or thousands. When an AI is handling the first level of incident response and surfacing only the insights that are worth investigating, engineers can reclaim time to build new features, architect more resilient systems, and invest in the creative work that adds business value.
Observability 3.0 is thus not about removing humans from the loop; it’s about elevating humans to do higher order work while AI takes care of the heavy lifting. DevOps is tedious and boring when you’re doing 80% Ops and 20% Dev. Automating your way out of manual analysis and other toil is long overdue. By allowing AI to be a reliable teammate, organizations can rebalance that ratio and let their talent focus on innovation rather than repetitive operations.
A New Era for DevOps and SRE — Looking Ahead with Observability 3.0
This will definitely not be perfect immediately (but neither is your current stack)
The emergence of Observability 3.0 signals a new paradigm for DevOps, SRE, and engineering teams at large. In this era, human-AI collaboration will be at the core of operating reliable systems. Just as the introduction of 1.0 tools revolutionized our ability to find issues, and 2.0 pipelines revolutionized our ability to handle scale, the 3.0 wave is poised to revolutionize our ability to respond and adapt. We can anticipate DevOps teams evolving their workflows to incorporate AI-driven insights routinely. Daily stand-ups will involve reviewing suggestions from an AI Ops analyst; incident post-mortems will be co-written by an AI that observed every step. SREs will still set reliability budgets and engineer reliability improvements, but with AI handling the “busywork,” they can focus on design and prevention more than firefighting.
Of course, that future only works if we apply the same rigor to the AI layer that we apply to the systems it’s helping run. In Observability 3.0, teams will need to monitor the performance of the agents themselves, the underlying models (OpenAI ChatGPT, Anthropic Claude, Google Gemini, etc), the prompts that steer them, and the tools they call, so they can evaluate behavior, catch regressions, and iterate safely. That means treating an “AI Ops analyst” like any other production component: instrumenting it with telemetry on latency, cost, tool-call success rates, escalation/hand-off frequency, and most importantly: outcome quality (did the recommendation actually reduce time-to-detect or time-to-resolve, did it avoid false positives, did it make the right tradeoffs). It also means versioning prompts and policies, running continuous evals and A/B tests against real incident patterns, detecting drift as systems and codebases evolve, and capturing enough context (inputs, tool outputs, final actions, and concise rationales) to audit decisions without guessing. When you can observe why an agent acted, how it performed, and where it failed, you unlock a tight feedback loop. This loop is critical to iterate and succeed.
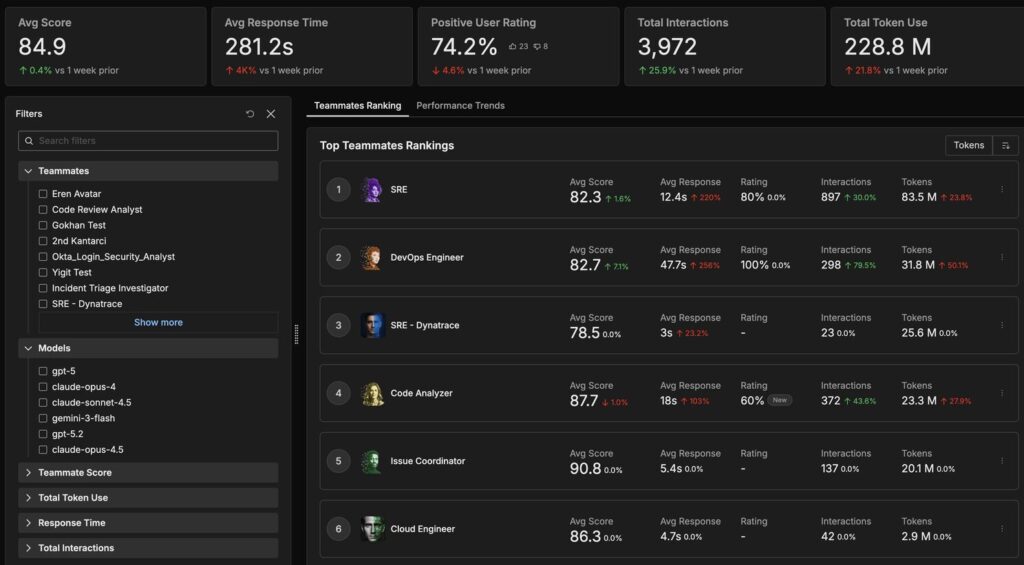
Automated performance review: peer review system across Edge Delta AI Teammates
Early in my career when I was a software dev at Microsoft, it was the beginning of the rise of Google. The huge discussion we had internally started like this: “We here at Microsoft have a 5:1 ratio of ICs to managers, and Google has a 25:1 ratio… how is that even possible? Is it crazy or genius?”
It was possible due to the value they gave to peer reviews. It allowed them to scale the engineering team without requiring tons of managers. Less layers, more speed. We’ve implemented the same peer reviewing system across our AI Teammates. They judge the accuracy and value of each other’s responses. Humans can definitely weigh in as well but this allows an automated performance review system for AI Teammates.
Importantly, Observability 3.0 is likely to improve system reliability and business outcomes in ways previously difficult to achieve. With autonomous monitoring agents watching every nook and cranny of the system 24/7, organizations can catch issues earlier (ideally before they impact users) and reduce downtime. Just this week I heard another engineering leader tell me, “I know it’s embarrassing, but we always hear about our issues from our customers.” That made me sad. The AI’s ability to cross-correlate signals across silos (logs, metrics, traces, code changes, feature flags, etc.) in real time means that complex failure modes (those “unknown unknowns”) are more likely to be understood quickly or even predicted. This translates to higher uptime, better performance, and ultimately happier customers and higher revenue. Moreover, by decreasing the manual cognitive load and stress on engineers, companies stand to improve team morale and retention. Instead of engineers burning out from 2 AM pages, they can trust that AI is catching and handling many issues, leading to reduced alert fatigue and decreased stress from on-call rotations as observed when robust observability practices are in place. Observability 3.0 turbocharges that effect.
In a broader sense, Observability 3.0 lets us get into a future where software operations becomes increasingly autonomous. We are beginning to see “self-healing” systems not as an abstract ideal, but as something achievable with AI ops agents that can both detect and act. The role of the human shifts to defining the guardrails, safety checks, and high-level objectives (site reliability engineers as reliability strategists and AI managers). This is a future where downtime is rare, not because humans work 24/7, but because our AI Teammates do, and they tirelessly watch over our systems so we can focus on making those systems better. It’s an inspiring vision: engineers regaining time to be creative, to innovate and experiment, knowing that an ever-vigilant AI sidekick has their back in production.
Your agentic observability team can use a connected fabric that includes existing services, streaming data, A2A, MCP, and more
Observability 3.0 is here and it’s already clear that the organizations embracing these AI-driven practices are gaining an edge. They can move faster (with less fear of breaking things), maintain more complex systems with smaller teams, and foster a culture where humans and AI continually learn from each other. In the coming years, we’ll likely see Observability 3.0 capabilities become standard in DevOps toolchains — much like monitoring dashboards were a decade ago — and the definition of “a highly effective engineering team” will include how well they leverage autonomous observability. The ultimate promise of this era is engineering empowered, not encumbered, by data. By letting machines do what they’re great at (crunching massive volumes of data, spotting patterns, reacting instantly) and letting humans do what we’re great at (creative thinking, strategic decision-making, drinking beer and making bad jokes), the next chapter of observability will unlock new heights of reliability, agility, and innovation in software organizations.
In summary, the journey from Observability 1.0 to 3.0 has been one of continuous empowerment. We’ve gone from simply seeing our systems, to efficiently managing the firehose of data, to now truly understanding and acting on insights with the help of AI. Each era built on the last, and now with Observability 3.0’s agentic AI Teammates, we are closer than ever to the original goal of observability: helping humans answer “Why is this happening?” and resolve it, as quickly and effortlessly as possible. The future of DevOps and SRE will be defined by this partnership between human creativity and artificial intelligence. A future where engineers can spend more time building great things, confident that their AI partners are watching the fort.
At Edge Delta, we’re making bets. We’re betting the models get better. We’re betting the system prompts improve. We’re betting the AI ecosystem including A2A, MCP, context, memory, and performance all evolves and gets more established. We’re betting the complexity of software and resulting data volumes continue to grow. We’re betting that the future is faster and more advanced than today. Although these are all big bets, they’re also safe bets. AI is not perfect today, but the potential is undeniable.
Time moves forward. The businesses that embrace AI will win against their competition
Welcome to Observability 3.0, where machines keep the systems running and humans keep the innovations coming.


