Recently, I was helping a customer configure their observability pipeline. This team uses Kubernetes to ensure a scalable infrastructure with distributed nodes in many zones and regions. They also need to store logs in a more traditional way – on disk, rather than streaming them to Kubernetes stdout. However, they have a policy that prevents engineers from using persistent volumes to store log data created by their Kubernetes nodes. As a result, no persistent volume claims (PVCs) are allowed.
The team struggled to understand how to collect logs into their pipeline without a persistent storage volume in the container. To solve this problem, I helped the team implement a semi-persistent storage target, along with tools to ensure their log data is memorialized and processed appropriately.
In this blog, I want to share my approach. I hope this will help other engineering teams build effective observability pipelines under the same constraints. I’ll do so by walking through a scenario that uses the emptyDir storage type in Kubernetes. But first, let’s provide more context around persistent and semi-persistent storage.
Persistent Storage vs. Semi-Persistent Storage
In Kubernetes, pods are ephemeral in nature, meaning they can be easily created, destroyed, and rescheduled. Persistent storage provides a way to store data – such as telemetry – in a manner that survives beyond the lifecycle of the pod. In other words, if your pod is destroyed, the data remains.
While storing data in a persistent volume can be beneficial, it can also create excessive costs if the storage volumes aren’t well maintained and pruned over time.
On the other hand, semi-persistent storage preserves data when your pods are rescheduled. However, it gracefully deletes the storage when your pods are destroyed. This prevents your team from storing (and paying for) data that you no longer need.
A few examples of semi-persistent storage volumes include emptyDir, hostPath, and local. In this article, we’ll focus on emptyDir.
What are emptyDir volumes?
Since the customer I support cannot use persistent volumes, I helped them collect log data from the emptyDir storage type in Kubernetes. This allows somewhat resilient storage availability to Kubernetes containers and pods.
When you use the emptyDir volume type in Kubernetes, you create a temporary directory on the host node’s filesystem. Data stored in this volume is preserved across container restarts within the same pod, but it is not persistent beyond the pod’s lifecycle. The data is lost if the pod is terminated or scheduled on a different node.
Understanding the emptyDir Architecture
When you host Kubernetes infrastructure in a cloud provider, such as Amazon Web Services (AWS) or Microsoft Azure, ensuring each host has ample storage space is beneficial. This will prevent you from running out of resources as you create more data.
When your pod is assigned to a node, it automatically creates an emptyDir volume. The volume lives on the host, outside of the container. By default, it stores data on your node’s backup mechanism (disk, network storage, SSD, etc.). In part, this is why emptyDir is so beneficial to use here – you don’t need to spin up additional resources to support the volume.
All containers running in a given pod will independently read/write data to the same emptyDir volume. The default mountPath for each pod has a root location of:
/var/lib/kubelet/pods/{pod_uid}/volumes/kubernetes.io~empty-dir/For this example, I will be using a volume that is located in this folder:
/var/lib/kubelet/pods/{pod_uid}/volumes/kubernetes.io~empty-dir/{volume}Now, let’s take a look at my example workload. Here, I have deployed an Nginx workload to my Kubernetes cluster with the following configuration:
apiVersion: v1
kind: Namespace
metadata:
  name: example01
---
apiVersion: apps/v1
kind: Deployment
metadata:
  name: example01
  namespace: example01
  labels:
    app: example01
    version: v1
spec:
  replicas: 1
  selector:
    matchLabels:
      app: example01
      version: v1
  template:
    metadata:
      labels:
        app: example01
        version: v1
    spec:
      containers:
        - name: file-info
          image: busybox
          command: ["/bin/sh"]
          args: ["-c", "while true; do echo '['$(date +%s)'] - INFO - FILE message host:'$(hostname) >> /var/log/example-info.log; sleep 1;done"]
          volumeMounts:
            - name: var-log
              mountPath: /var/log
      volumes:
        - name: var-log
          emptyDir: {}
When I use this configuration, my Nginx pod will write all its logs to the proper mountPath, which is /var/log. This will ultimately translate into the following folder structure:
/var/lib/kubelet/pods/{pod_uid}/volumes/kubernetes.io~empty-dir/logs/{filename}When I use this configuration, I know that all my logs will be stored in the emptyDir host storage. In doing so, my workload can read and write logs to the emptyDir volume.
Getting Logs from emptyDir into Edge Delta
Now that we’ve set up emptyDir, we need to answer the question: How can I get my logs into Edge Delta?
Edge Delta is deployed as a daemonset, which ensures the data from the logs are only gathered once per container. To ensure the host folder is available to Edge Delta, I will mount the folder inside the Edge Delta container on each host. This will allow the Edge Delta container to read all logs that are stored in the emptyDir volume.
To keep it simple, the emptyDir folder is mounted to the same folder inside the Edge Delta container.
Here’s a snippet from the kubernetes manifest:
Source: edgedelta/templates/daemonset.yaml apiVersion: apps/v1 kind: DaemonSet metadata: name: edgedelta namespace: edgedelta annotations: prometheus.io/scrape: "true" labels: app.kubernetes.io/name: edgedelta app.kubernetes.io/instance: edgedelta edgedelta/agent-type: processor version: v1 kubernetes.io/cluster-service: "true" … volumeMounts: - name: varlibkubeletpods mountPath: /var/lib/kubelet/pods readOnly: true … volumes: - name: varlibkubeletpods hostPath: path: /var/lib/kubelet/pods
Edge Delta Agent Configuration
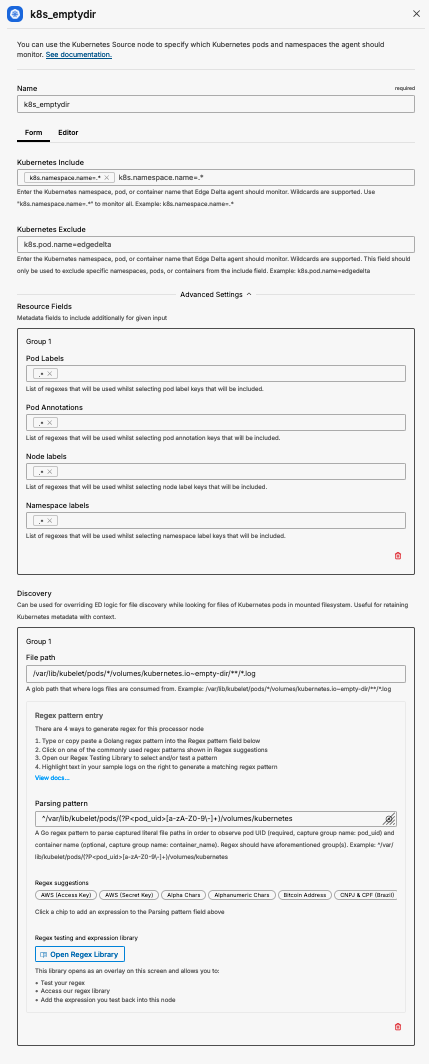
Now that the empty-dir files are mounted and available inside the Edge Delta container we need to configure the agent to tail the appropriate files. We add a kubernetes source input and override the discovery path and point it to the empty-dir path.
YAML
- name: k8s_emptydir
  type: kubernetes_input
  include:
  - k8s.namespace.name=.*
  discovery:
    file_path: /var/lib/kubelet/pods/*/volumes/kubernetes.io~empty-dir/**/*.log
    parsing_pattern: ^/var/lib/kubelet/pods/(?P<pod_uid>[a-zA-Z0-9-]+)/volumes/kubernetes
UI
Add a Kubernetes Source node to the canvas and update the appropriate fields.
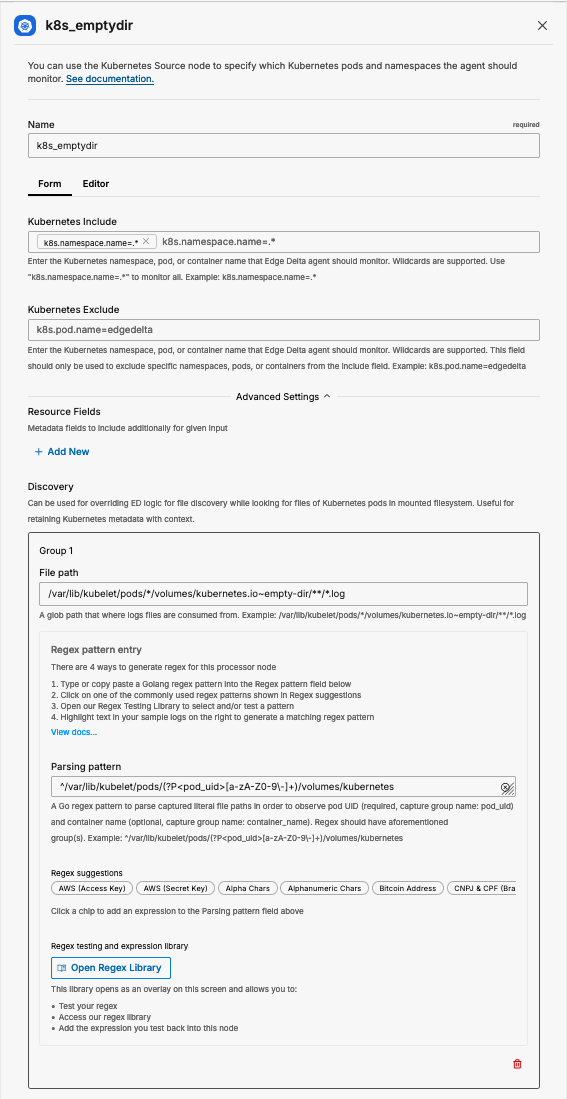
path: /var/lib/kubelet/pods/*/volumes/kubernetes.io~empty-dir/**/*.log
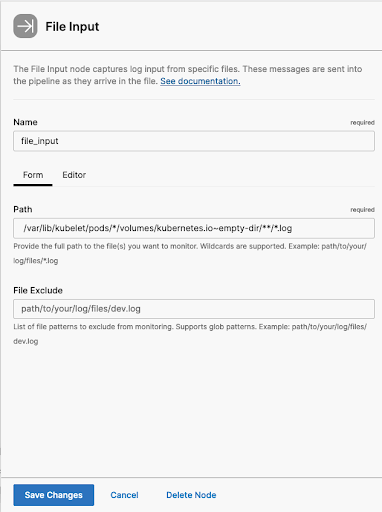
You can also add a new file input from within our Visual Pipelines interface, updating the path with the appropriate value:
Enriching Log Data With Kubernetes Labels
To enrich logs gathered from the empty-dir simple add the appropriate Resource Fields on the data source. Populating all of the Resource Fields with the regex value of .* will add all labels available to every message.
YAML
- name: k8s_emptydir
  type: kubernetes_input
  include:
  - k8s.namespace.name=.*
  resource_fields:
    pod_labels:
    - .*
    pod_annotations:
    - .*
    node_labels:
    - .*
    namespace_labels:
    - .*
  discovery:
    file_path: /var/lib/kubelet/pods/*/volumes/kubernetes.io~empty-dir/**/*.log
    parsing_pattern: ^/var/lib/kubelet/pods/(?P<pod_uid>[a-zA-Z0-9-]+)/volumes/kubernetes
UI
Final Thoughts
In this blog, I covered how you can collect data in Edge Delta using an emptyDir Kubernetes storage volume. This approach is useful if your team cannot use persistent volumes. Across two Edge Delta Observability Pipeline nodes, we were able to gather logs from any file that has been written to the host via emptyDir. Additionally, all logs contain Kubernetes tags and labels to enhance the data quality.
Want to give Edge Delta Telemetry Pipelines a try for yourself? Check out our playground environment. For a deeper dive, sign up for a free trial!


