


Amazon Elastic Load Balancing (ELB) distributes incoming network traffic across several targets. The ELB distributes some servers for the best function and fault tolerance. ELB of prime is to scale the availability and reliability of applications by forwarding traffic to healthy instances and distributing this load to not be overwhelmed by one instance.
Navigating Amazon ELB can boost your applications’ reliability and performance. But how do you ensure your ELB setup is optimized for the challenges? Knowing the right metrics to monitor is the key.
Continue reading to identify what metrics to monitor on Amazon ELB to keep your applications running smoothly and your servers balanced.
Key Takeaways
- Understand Classic, Application, and Network Load Balancers to select the best type for your application’s needs and complexities.
- Incorporate ELB in your AWS setup to enable auto-scaling, fault tolerance, and SSL termination, increasing resilience and scalability.
- Monitor metrics like latency, request count, surge queue length, and HTTP error rates to optimize performance, identify bottlenecks, and ensure high availability.
- Track SSL negotiation time, backend connection errors and HTTP response code counts to manage security risks and comply with AWS standards.
- Use connection draining to redirect traffic from failing instances smoothly during scale-in events, maintaining seamless operation and reliability.
Understanding Amazon Elastic Load Balancer
Amazon ELB offers three kinds of load balancers:
- Classic Load Balancer: Perfect for simple HTTP/HTTPS traffic balancing
- Application Load Balancer: Tailored for sophisticated application-level routing
- Network Load Balancer: Built for high performance and static IP targeting for TCP traffic
Understanding these types assists in choosing the most fitting ELB for your app’s needs. ELB acts as AWS’s traffic cop, directing incoming requests to the best-suited server based on predefined rules and health checks. It ensures efficient web traffic management and a smoother user experience.
Incorporating ELB into your AWS setup adds a layer between users and backend servers, enabling features like auto-scaling, fault tolerance, and SSL termination. This integration aids in building resilient and scalable cloud application architectures.
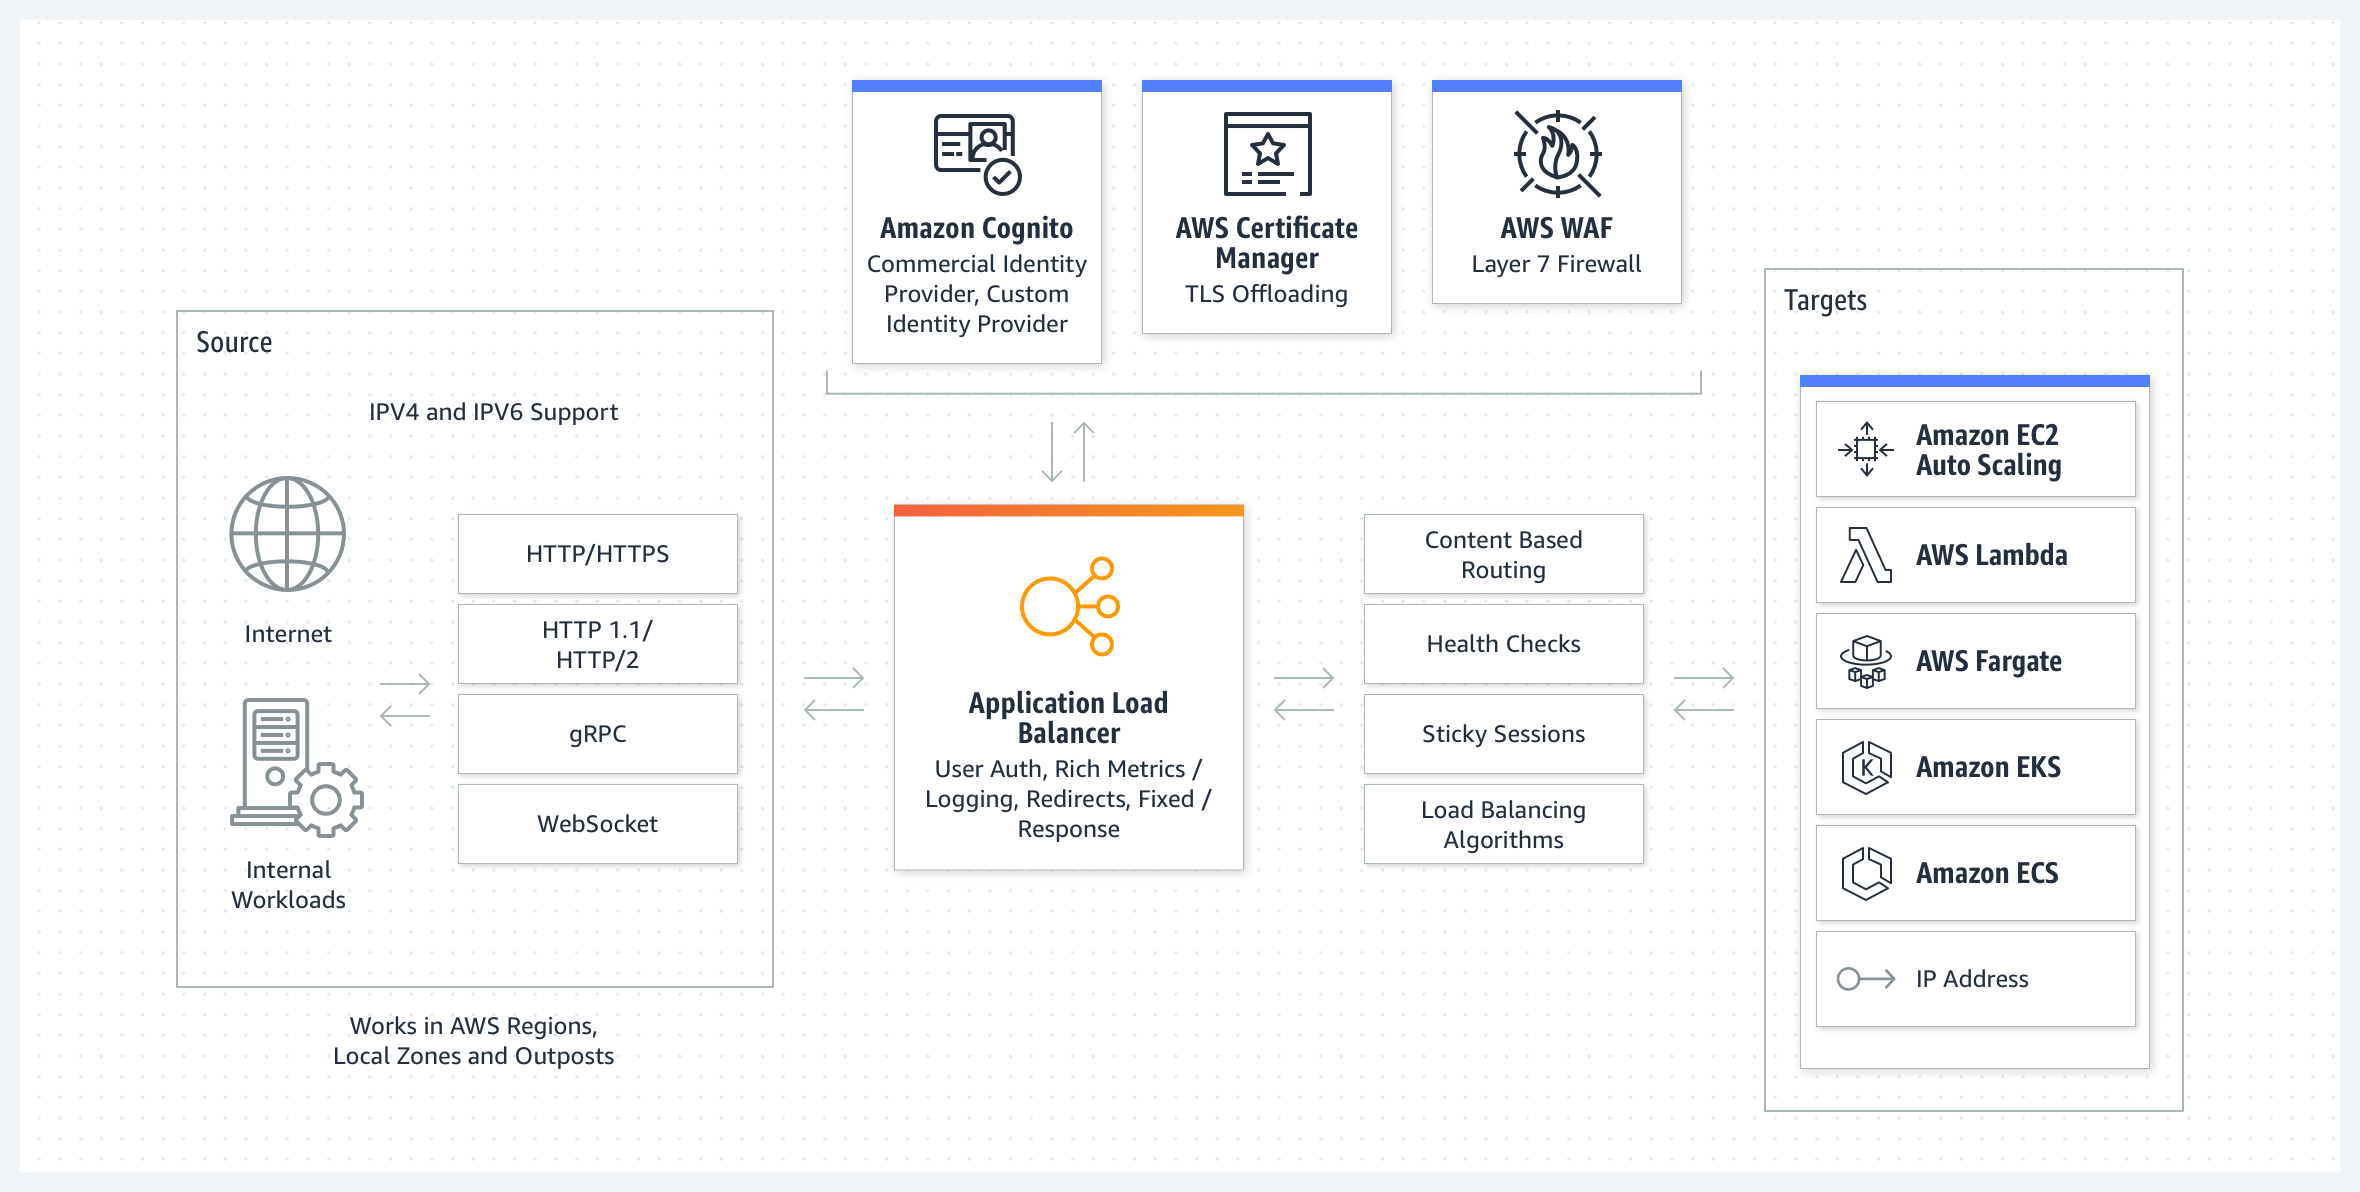
Source: AWS
15 Metrics to Monitor for AWS ELB
Monitoring ELB metrics is beneficial for organizations. It is critical for maintaining the health and efficiency of your AWS environment. Find out what metrics you should monitor below.
1. Latency
Metric Name: Latency
Latency measures the time it takes for a request to be serviced through the load balancer. High latency may indicate either network congestion problems or backend server issues, causing poor user experiences. Monitoring latency helps ensure timely response to user requests and identifies performance bottlenecks.
2. Request Count
Metric Name: RequestCount
Request count measures the total number of requests the load balancer handles over a specific period. Monitoring the number of requests helps understand traffic patterns, estimate the load on the application, and plan capacity.
3. Surge Queue Length
Metric Name: SurgeQueueLength
Surge Queue Length is the number of requests currently waiting temporarily for processing in times of high demand in traffic. This metric provides insights during increased traffic demand. Observing this metric helps ensure that the load balancers can handle spikes without losing requests, thus maintaining the smooth processing of requests.
4. HTTP 4xx and 5xx Error Rates
Metric Name: HTTPCode_Backend_4XX or HTTPCode_Backend_5XX
HTTP 4xx and 5xx error rates are critical metrics for monitoring with AWS ELB. They track the frequency of client-side (4XX) and server-side (5XX) errors from the backend instances connected to the load balancer.
Monitoring these rates is essential for identifying and addressing application or configuration issues impacting user experience. These metrics could indicate an issue with your servers and fix any errors quickly.
5. Backend Connection Errors
Metric Name: BackendConnectionErrors
Backend Connection Error metrics are vital for understanding connectivity issues that may prevent the load balancer from successfully forwarding requests to the backend. This metric can indicate potential problems with network configuration, instance health, or server overload.
Tracking backend connection errors aids in optimizing performance and troubleshooting network glitches, misconfigurations, or application errors to minimize downtime and enhance user experience.
6. Healthy Host Count
Metric Name: HealthyHostCount
The healthy host count is an essential metric to ensure the server has enough instances and healthy ones—processing requests efficiently, achieving high availability, and failing to disturb service.
Monitoring the healthy host count metric lets you notice problems of certain hosts, providing time to fix them. It also allows the remaining instances to keep running and operating with the best performance possible for your application.
7. SSL Negotiation Time
Metric Name: SSLNegotiationTime
SSL negotiation time is a metric used to monitor the time for a Secure Sockets Layer (SSL) handshake between a client and an AWS ELB. It measures the duration from when the client initiates the SSL connection request to when the SSL handshake is completed and data transmission can begin.
Watching SSL negotiation time helps assess the performance and efficiency of SSL/TLS encryption protocols, ensuring optimal security and responsiveness of web applications.
8. HTTP(S) Request Methods
Metric Name: HTTP_Method_Counts
HTTP(S) request methods represent the actions performed by clients when communicating with servers. GET retrieves resources, POST submits data, PUT updates resources, and DELETE removes resources. Monitoring these methods provides insight into the types of interactions with the server, aiding in performance optimization and troubleshooting for AWS ELB.
The HTTP(S) request methods also offer crucial insights into traffic patterns and server health for AWS ELB. Watching them allows admins to optimize performance, identify potential bottlenecks, and ensure efficient resource usage.
9. Active Connection Count
Metric Name: ActiveConnectionCount
The active connection count metric for AWS ELB reflects the number of connections currently established with the load balancer. It is a vital indicator of traffic volume and load distribution across backend instances.
By monitoring this metric, administrators can ensure optimal resource allocation, detect potential capacity issues, and scale infrastructure accordingly to maintain high availability and performance.
10. Backend Connection Establishment Time
Metric Name: BackendConnectionTime
The Backend Connection Establishment Time is needed to connect the AWS Elastic Load Balancer (ELB) to its backend instances. This metric is vital for showing the health and performance of your applications’ backend infrastructure hosted over AWS.
You can troubleshoot performance issues and optimize resource allocation for effective load balancing by tracking the Backend Connection Establishment Time.
11. Network Bytes In/Out
Metric Name: NetworkIn/NetworkOut
Network Bytes In/Out represents the data in and out of the Elastic Load Balancer (ELB) to and from AWS. It is one of the key metrics that measures the ELB’s network traffic and usage.
By keeping track of Network Bytes In/Out, one can tell the load on the load balancer and even traffic patterns. Tracking it will ensure that effective resource scaling is done to allocate resources to keep performance and cost-effectiveness at par.
12. HTTP(S) Response Code Counts (HTTPCode_ELB_2XX/3XX)
Metric Name: HTTPCode_ELB_2XX / HTTPCode_ELB_3XX
HTTP(S) Response Code Counts measure various HTTP response codes generated by AWS ELB, including 2xx, 3xx, 4xx, and 5xx series status codes. They provide critical feedback in the health and performance monitoring of applications served by ELB and critical insights into the types and frequencies of the responses being returned to clients.
13. Cross-Zone Load Balancing
Metric Name: CrossZoneLoadBalancing
Cross-zone load balancing is an ELB feature that distributes incoming traffic evenly across all registered instances in all availability zones enabled for the load balancer. Even traffic distribution ensures that each instance receives a balanced share of the workload, regardless of its availability zone.
Monitoring the Cross-Zone Load Balancing metric provides insights into the distribution of traffic across instances and helps ensure that the load balancer effectively utilizes all available resources.
14. HTTP(S) Request Count per Target
Metric Name: RequestCount_per_Target
HTTP(S) Request Count per Target is a metric that measures the number of HTTP or HTTPS requests forwarded by the ELB to each registered target, such as Amazon EC2 instances or containers. This metric helps monitor the distribution of traffic among backend targets and identify potential hotspots or underutilized resources.
With the HTTP(S) Request Count per Target analysis, administrators can optimize resource allocation, scale instances as needed, and ensure efficient handling of incoming requests, ultimately improving application performance and user experience.
15. Connection Draining
Metric Name: ConnectionDraining
Connection Draining ensures the instances can complete in-flight requests before terminating. It helps the load balancer gradually shift traffic away from unhealthy instances during scale-in events or instances’ terminations.
Monitoring the status and efficiency ensures smooth transitions at instance terminations without disrupting the running user sessions and maintains application availability and reliability.
Why Monitor ELB Metrics?
There are several reasons why ELB metrics should be monitored. Among these reasons are:
- Ensuring high availability by detecting unhealthy instances
- Aiding in performance tuning by identifying bottlenecks
- Optimizing costs by understanding traffic patterns in detail
- Verifying that resources are functioning correctly
- Compliance, especially for applications hosted on AWS
With ELB, you can make sure that an application hosted on AWS is robust, secure, scalable, and cost-efficient. Monitoring the key metrics can help you supervise the technical aspects of application deployment and align operational performance with your business objectives.
Conclusion
Amazon Elastic Load Balancer is a crucial component for high availability and reliability in cloud-based applications. Effective monitoring of various metrics on ELB, coupled with real-time analytics, drastically improves application performance and, with time, increases user experience.
With careful monitoring of the set vital metrics, organizations can ensure that their infrastructure remains resilient and responsive to the demands placed on it by modern applications.
FAQs on Key Metrics to Monitor on Amazon ELB
What metrics should I monitor on AWS ELB for performance optimization?
Monitoring key performance indicators (KPIs) on the AWS ELB ensures optimal application performance and availability. Start with monitoring latency, which measures the time it takes for the load balancer to respond to each request. High latency can indicate potential bottlenecks or issues in your application’s architecture.
Why is it important to monitor error rates on AWS ELB?
Monitoring error rates on AWS ELB is essential for maintaining the reliability and availability of your applications. High error rates may indicate misconfigurations, insufficient capacity, or underlying issues with your application code. Timely detection and resolution of these errors can help prevent service disruptions, improve user experience, and ensure the overall health of your AWS environment.
How can I ensure proper security by monitoring SSL handshake failures on AWS ELB?
Monitoring SSL handshake failures on AWS ELB is crucial for ensuring the security and integrity of data transmitted over encrypted connections. By closely monitoring SSL handshake failures, you can detect potential security threats or misconfigurations in your SSL/TLS setup.

