🤖 Meet OnCall AI, our observability copilot that makes troubleshooting easy. Read announcement.

Skip to content
Product

Visual Pipelines Demo

Jun 22, 2023 / 6:10
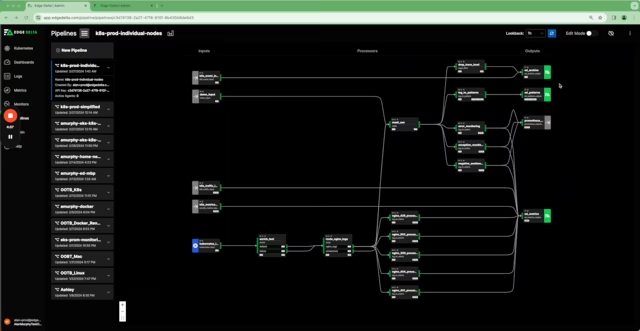
Introducing Visual Pipelines — a single, point-and-click interface to manage your observability pipelines. In this demo video, we walk through a handful of core use cases of the new release.

Transcript

Meet Visual Pipelines from Edge Delta. A single point and click interface to manage observability pipelines with visual pipelines. You can do everything from building pipelines to testing processors and monitoring pipelines health. Let's see how it works.

Today, I'm going to update an observability pipeline on behalf of our billing application team and our security team. I'm currently in edit mode, which allows me to edit the components in our pipeline. Our pipeline currently consists of an input for collecting Kubernetes logs, routing logic for different Kubernetes services and log levels, and outputs which consist of observability services, for now, Datadog for my metrics and Splunk for my logs.

First, I want to make sure we're collecting all of the data our billing team needs. To do this, I will update our Kubernetes input to capture logs from our billing service namespace. Once I hit okay, the logs start flowing through. I want to apply a logs to metrics processor to the data we've just added. This will help us track status codes over time in our operations dashboard in Datadog. To do this, I'll simply connect the billing service to Datadog and inline I will apply logs to metrics processor. We'll call this one "billing status". I apply a pattern and double-check that it's set up properly. From here, let's review our changes. I can see that I've updated our Kubernetes input, extracted status code metrics from the billing service, and everything is flowing into Datadog. This all looks good, so I will deploy our changes.

Next, I'd like to send all of my info logs to Splunk along with our error and fatal logs. However, since we're already capturing the status code metric in Datadog, I'm going to drop logs with a 200 status code. This will help me reduce ingest costs without impacting visibility. To do that, I'll add a regex filter processor. We'll call it "drop 200" and we can apply the right pattern. And now we can add this to flow into Splunk. So, we're now capturing our error and fatal logs raw into Splunk. We're also capturing our info logs but dropping 200 status codes to help reduce costs.

Next, I'm going to add an S3 output to capture all our raw log data into low-cost storage. We need this data for compliance and to support rehydration. I'll add the right bucket and the region. I can now connect our Kubernetes input to S3. Everything looks good, so I can deploy.

Now that we've made a few updates to our billing service, I want to apply our log to pattern processor. This will cluster all repetitive log lines, ensuring I have visibility into all data while controlling downstream ingest. I will feed this into Splunk. Let's go ahead and get our security team's data added to this pipeline as well. I'll start by adding a Splunk output. We'll call it "security logs" and add the right endpoint. I'm going to add a file input to capture my security team's data. Now, let's send this data to both Splunk and S3. As I review the changes, I can see there's an issue with this new security logs destination in Splunk. With visual pipelines, I can easily investigate the issue and see that I forgot the token and index. So I'll add that information in and apply the changes. Now everything looks like it's working properly, and I can deploy the changes.

Now, I'm going to show you how to mask data within your logs. As I was adding the security dataset, I noticed that there were plaintext passwords in the data. Let's go ahead and add a mask processor. I'll name this "mask password" and apply the right pattern. I’ll apply the mask string as "redacted". Now, I can quickly test the processor, and I can see that the password was included in the incoming data but redacted from outgoing data.

To close, let's summarize everything we did in just a few minutes. We added a log to metric processor to capture 200 status codes in Datadog. We routed our info logs to Splunk along with error and fatal while dropping 200 status codes. We added a log to pattern processor. We added our security logs routing to S3 along with our other datasets. These are also going to our new Splunk destination.

Sign up for our free onboarding experience to try the full feature set.