


Teams in every industry are racing to integrate generative AI into their products, especially as Large Language Models (LLMs) have become more advanced. Newly launched protocols like the Model Context Protocol (MCP) and the Agent-to-Agent (A2A) protocol enable LLMs to accurately utilize larger contexts and perform sophisticated, multi-step agentic processing to handle more complex workloads. As a result, LLM responses are more reliable and allow organizations to automate tasks more securely and efficiently.
Despite these improvements, LLMs are still prone to a range of performance issues, including:
- Looping Behavior: The model gets stuck in repetitive or circular responses, often endlessly repeating phrases or re-attempting the same action without progress.
- Drift: The model’s context increasingly deviates from real-world scenarios and becomes less representative of reality.
- Hallucinations: The model confidently generates inaccurate, fabricated, or nonsensical information.
- Specific Agent Failures: In agentic workflows, individual agents may misunderstand their assigned task, pass along incorrect information, or produce outputs that are incompatible with other agents’ expectations.
- Cost Overruns: Inefficient reasoning, unnecessary verbosity, or excessive context usage can dramatically increase token consumption and model calls, driving up costs.
Many of these issues degrade LLM response quality without noticeable external symptoms. As a result, standard monitoring approaches (such as those that rely on the four golden signals) fail to identify failure modes that are unique to LLMs.
In this post, we’ll discuss these limitations in more detail — and explore how a new observability framework that collects LLM-specific telemetry data can help teams overcome them.
Why Traditional Monitoring Falls Short for LLMs
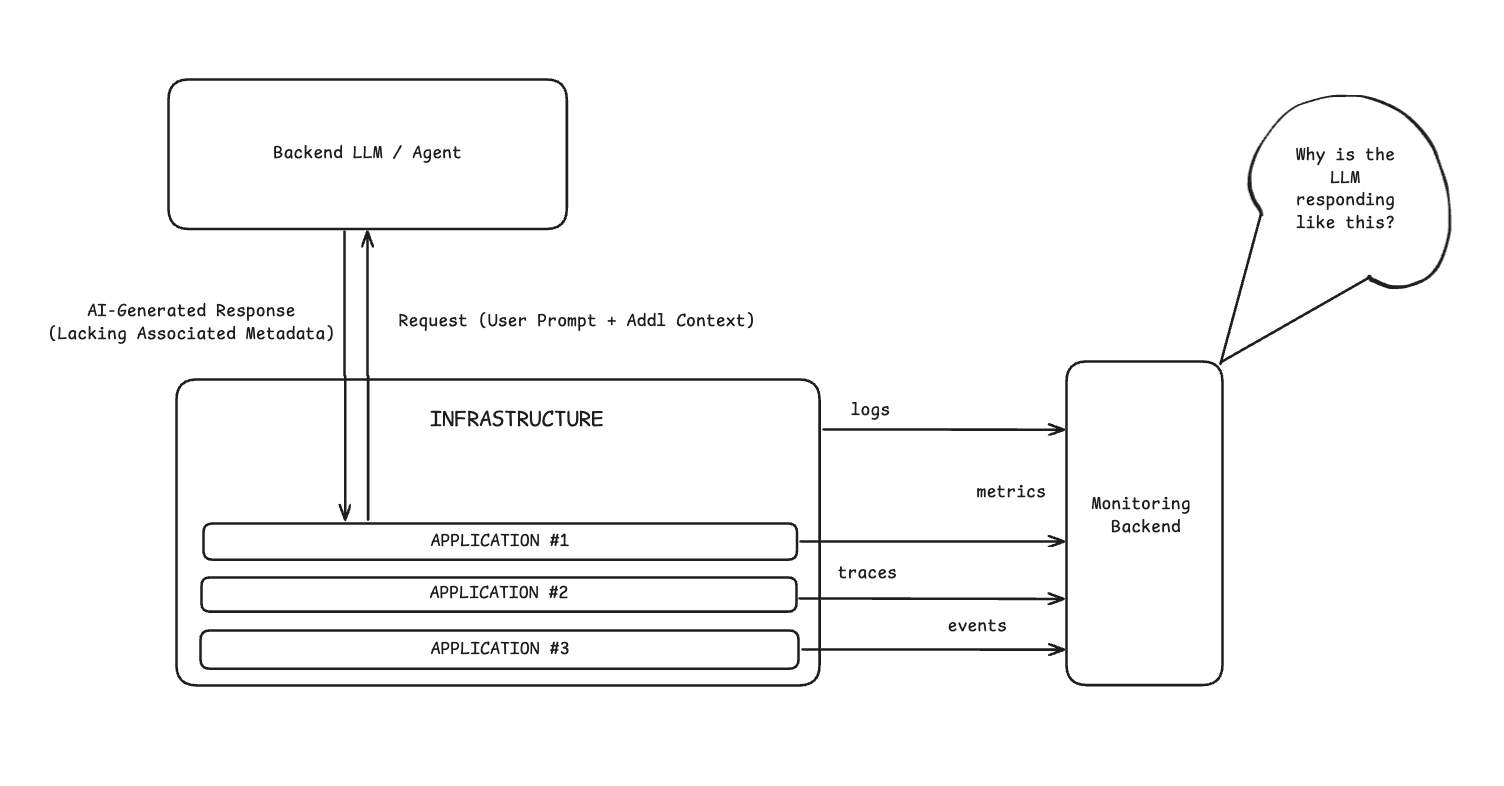
In traditional workloads, infrastructure and application-level telemetry data offer sufficient context to monitor system performance, even when external tools like APIs are involved. Although API functionality is abstracted behind well-defined endpoints, they typically adhere to strict protocols and schemas, ensuring their responses are logically structured and consistent. As a result, standard telemetry data — including request rates, error codes, and latency metrics — is enough to track the health and behavior of API-based systems.
LLM-based applications typically use an API-centric approach to retrieve model responses, but the metadata returned with each generated response is often limited. Without rich context — like model parameters, token counts, and intermediate reasoning steps — teams lack the visibility needed to effectively overcome these unique challenges:
- Non-Determinism: In LLM systems, the same input may not yield the same output or action sequence, especially with generative parameters (temperature) or agent choices. Teams must be able to distinguish acceptable variability from errors.
- “Black Box” Nature: Understanding the reasoning behind a specific LLM response or agent decision is inherently difficult, complicating root cause analysis.
- Subjective and Multi-faceted Output Quality: Evaluating LLM and agent outputs requires complex, quality-based calculations that go beyond standard metrics. For instance, response relevance, bias, coherence, accuracy, and adherence to instructions and safety protocols must be considered.
- Unpredictable Costs: Costs are often tied directly to token counts and call volumes, which can vary significantly — especially in multi-step agent processes that are prone to loops.
The Role of Open Standards
The industry’s move toward AI telemetry standardization — with initiatives like OpenTelemetry for Generative AI — highlights the growing need for LLM-specific telemetry data to effectively monitor LLM applications. OpenTelemetry’s offering is comprised of two key components:
- Semantic Conventions: Standardized guidelines for structuring and collecting LLM-based telemetry data, including model parameters, response metadata, token usage, and more.
- Instrumentation Library: SDKs designed to automate the collection of telemetry data from LLMs.
Together, they aim to establish a common language for capturing critical details about LLM behavior. This serves as the foundation for more robust LLM monitoring systems, empowering organizations to create stronger, more effective AI observability strategies.
The Pillars of Effective AI Observability
By collecting in-depth information about LLM behavior, we can directly tie concrete data to each response — and build LLM-specific monitoring infrastructure. With this context, teams can implement:
- Input/Output Tracking: Reliably log prompts, full responses, metadata, model configuration, latency, and token counts. For agents, track intermediate thoughts, actions, and tool interactions.
- Model Performance and Quality Monitoring: Track operational metrics (e.g., success rates) alongside task-specific LLM/agent performance metrics (e.g., adherence) using automated evaluations and user feedback.
- Drift Detection: Implement statistical monitoring on inputs, prompts, context, outputs, and agent behavior patterns against baselines to detect shifts.
- Bias, Fairness, and Safety Monitoring: Define and track metrics for bias, toxicity, PII leakage, prompt injection vulnerabilities, and adherence to safety policies.
- Cost Analysis and Resource Utilization: Granularly track token counts, costs per request/user/trajectory, and compute resources (for self-hosted models).
- End-to-End Pipeline Tracing: Visualize the entire request flow through complex systems using distributed tracing enriched with LLM attributes. This is essential for diagnosing loops, bottlenecks, and errors — and for understanding non-deterministic paths.
With these capabilities in place, organizations can move beyond basic uptime checks and latency tracking — building a true AI observability layer that treats LLMs as the dynamic, decision-making systems they are.
The Edge Delta Advantage for AI Observability
Implementing deep AI observability introduces major challenges around scale, complexity, and cost. Edge Delta’s intelligent Telemetry Pipelines and Observability Platform both leverage AI to tackle these issues proactively.
Edge Delta’s Telemetry Pipelines analyze telemetry data as it’s created at the edge, efficiently managing high-volume outputs from chatty LLMs and agents and enabling real-time hallucination, loop, and drift detection. Additionally, by processing data upstream, our pipelines dramatically reduce data transfer and storage costs by sending only what’s necessary for further analysis downstream.
Our pipelines are vendor neutral by design, routing data from any source to any destination. One such destination is Edge Delta’s Observability Platform — a modern, cost-effective alternative to legacy observability solutions that uniquely leverages AI to solve AI observability challenges. For example, our troubleshooting copilot OnCall AI automatically analyzes detected anomalies, correlates events across distributed pipelines, identifies possible root causes, and utilizes LLMs to provide actionable resolution suggestions.
At Edge Delta, we’re committed to providing best-in-class observability support for applications that harness the power of generative AI. As the OpenTelemetry LLM Semantic Convention matures, we plan to integrate it directly into our current OpenTelemetry-compliant data model — empowering users to monitor LLM responses more effectively at scale. By processing data intelligently at the edge and applying AI insights from source to destination, Edge Delta provides faster and more cost-effective observability crucial for modern AI applications.


