Modern organizations rely on a wide variety of third-party SaaS platforms to deliver key functionality, including payment processing, cloud storage, and user authentication. However, many of these tools don’t support real-time telemetry data streaming, exposing data instead through pull-based APIs. They also don’t include native dashboarding and monitoring capabilities, which forces users to leverage external observability platforms for analysis.
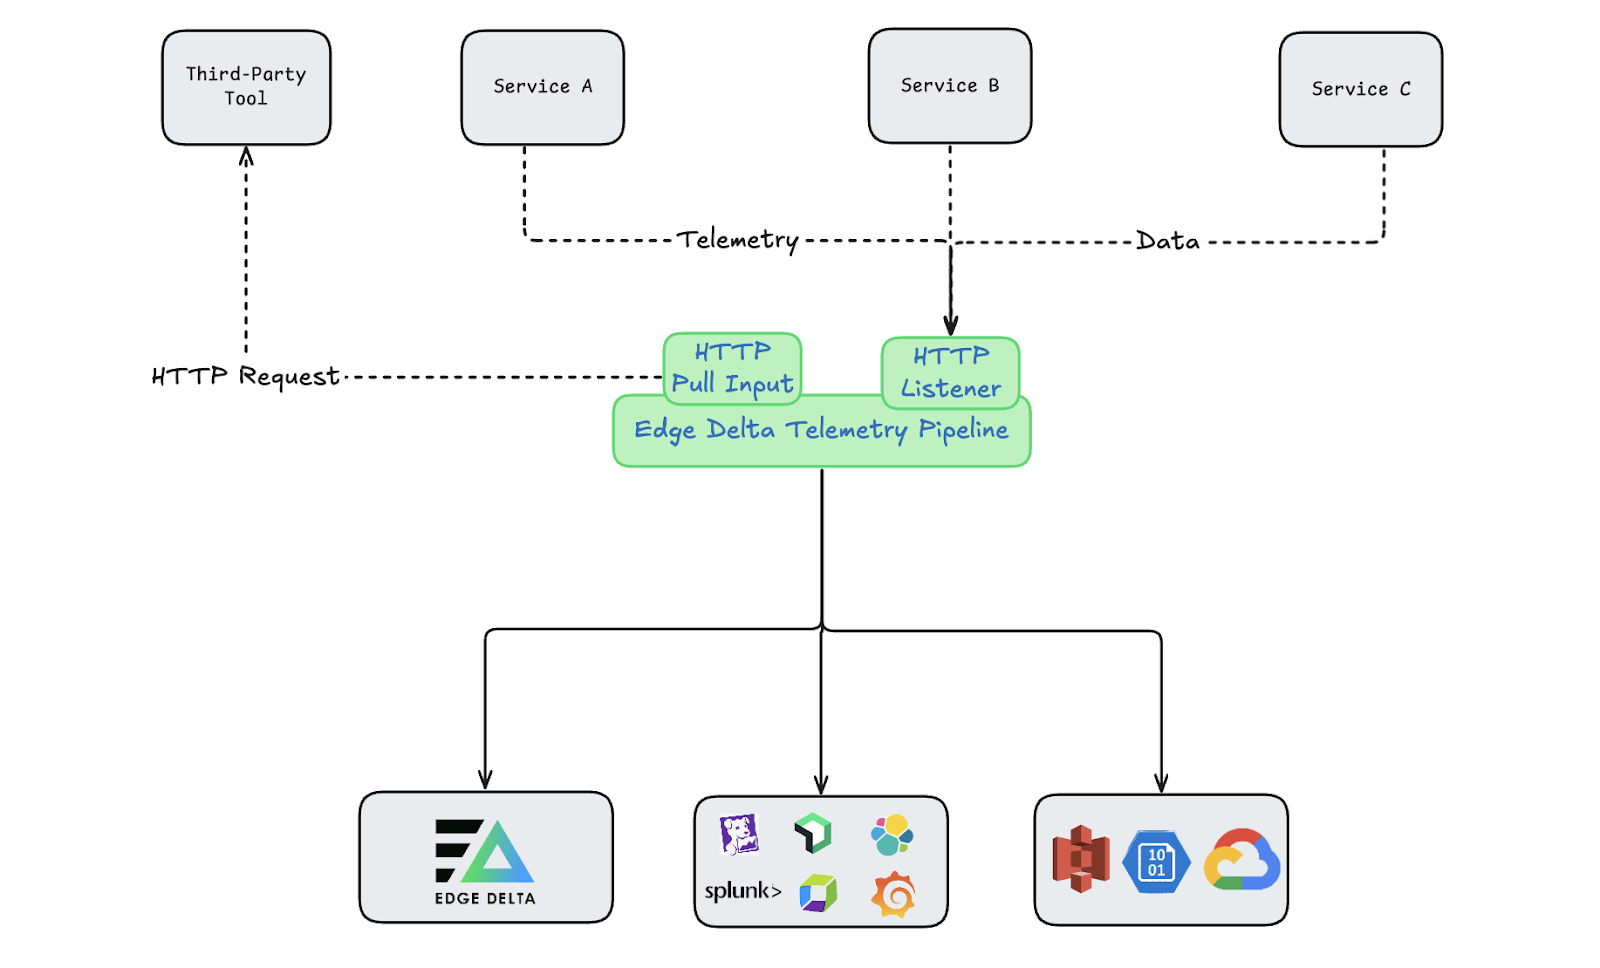
Edge Delta’s HTTP Pull Input Source node allows teams to automate third-party telemetry data collection with configurable HTTP requests, eliminating critical blindspots while reducing manual overhead. Additionally, Edge Delta’s Telemetry Pipelines provide intelligent processing and routing capabilities to enrich and optimize the data before it’s sent downstream, which facilitates effective monitoring and analysis at scale.
Pull-Based Data Collection with Edge Delta
Many widely used tools make their telemetry data available via APIs. For example, Identity and Access Management (IAM) platforms like PingOne, Microsoft Entra, and Okta expose a variety of logs through custom APIs that require users to fetch the data themselves with pull-based HTTP requests. This forces teams to either pay expensive telemetry vendors to pull the data, or write programs to do it themselves — a process that can be both time-consuming and cumbersome.
With Edge Delta’s HTTP Pull Input Source node, teams can easily send outbound requests to any HTTP-based API to collect and forward telemetry data through Edge Delta’s Telemetry Pipelines. This enables them to automatically collect, process, and route telemetry data from third-party tools at scale without creating custom scripts, managing complex configuration files, or incurring significant costs.
The node has several configurable components that it combines to generate the end HTTP request:
- Endpoint: Full URL of the target API endpoint
- Method: Type of request being made (either GET or POST)
- Headers: Optional request headers (e.g., Authorization, Content-Type) used to authenticate or shape the request
- Query Parameters: Optional tags appended to the URL, which are used to specify which data is to be queried
Users can also modify the pull interval (how frequently to send the specified request) and add retry HTTP status codes (HTTP codes that, when returned, will trigger a retry of the request). For a full breakdown of the HTTP Pull Input Source node internals, be sure to check out our documentation.
It only takes a few minutes to create a new HTTP Pull Input Source node in Edge Delta’s point-and-click pipeline builder interface. Simply hop into edit mode, select the node from the source list, and enter your respective values:
Once data is flowing, users can structure and enrich it pre-index to enhance monitoring and analysis.
See It in Action: Okta Audit Logs
To demonstrate, let’s add a new HTTP Pull Input Source node to our pipeline. We’ll use a local Python API that returns synthetic Okta Access Gateway audit logs in response to GET requests sent to the /logs endpoint. This endpoint has been made publicly available with ngrok, a secure tunneling service:
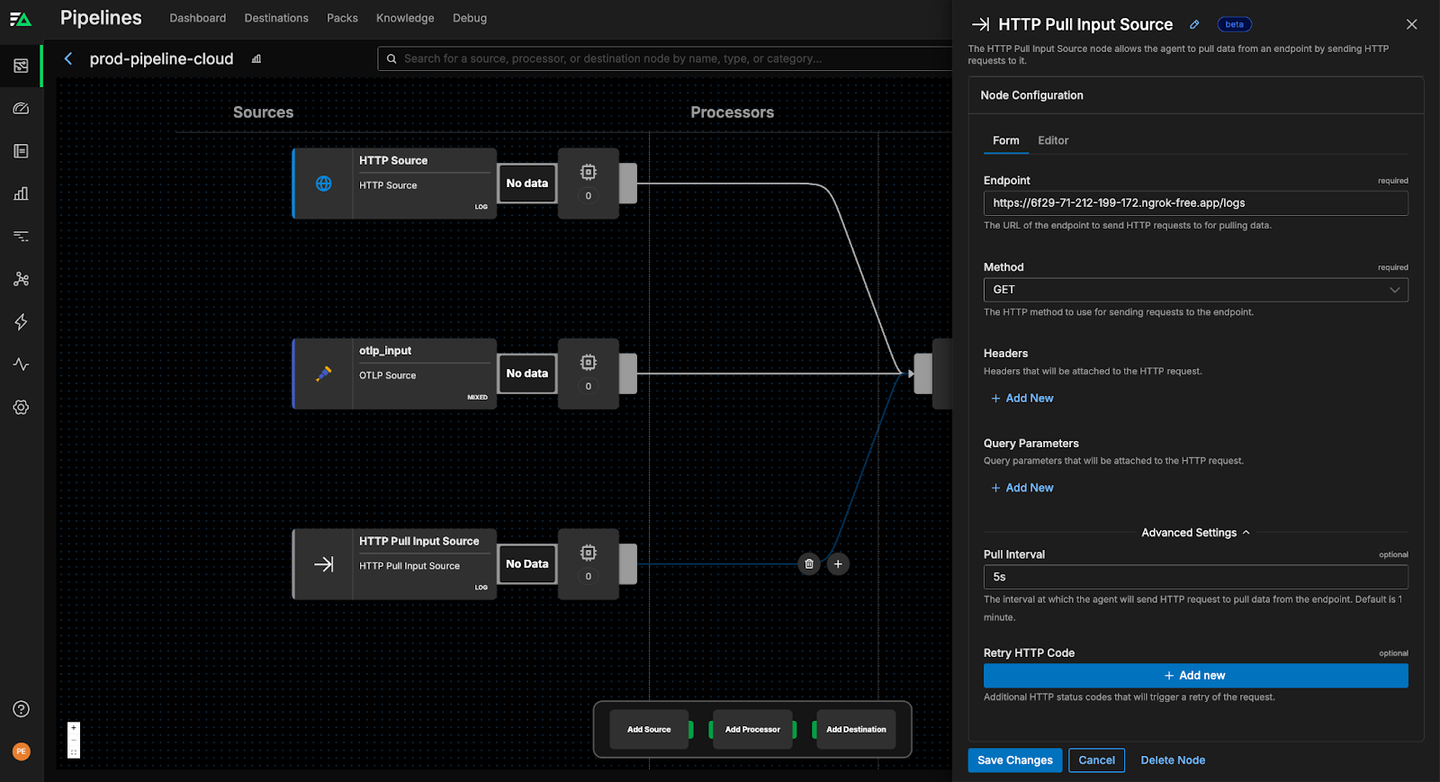
As you can see in the screenshot above, the node’s endpoint component is set to the ngrok endpoint, the request method is set to GET, and the pull interval is configured to be five seconds. For this particular API, no custom headers or query parameters are required.
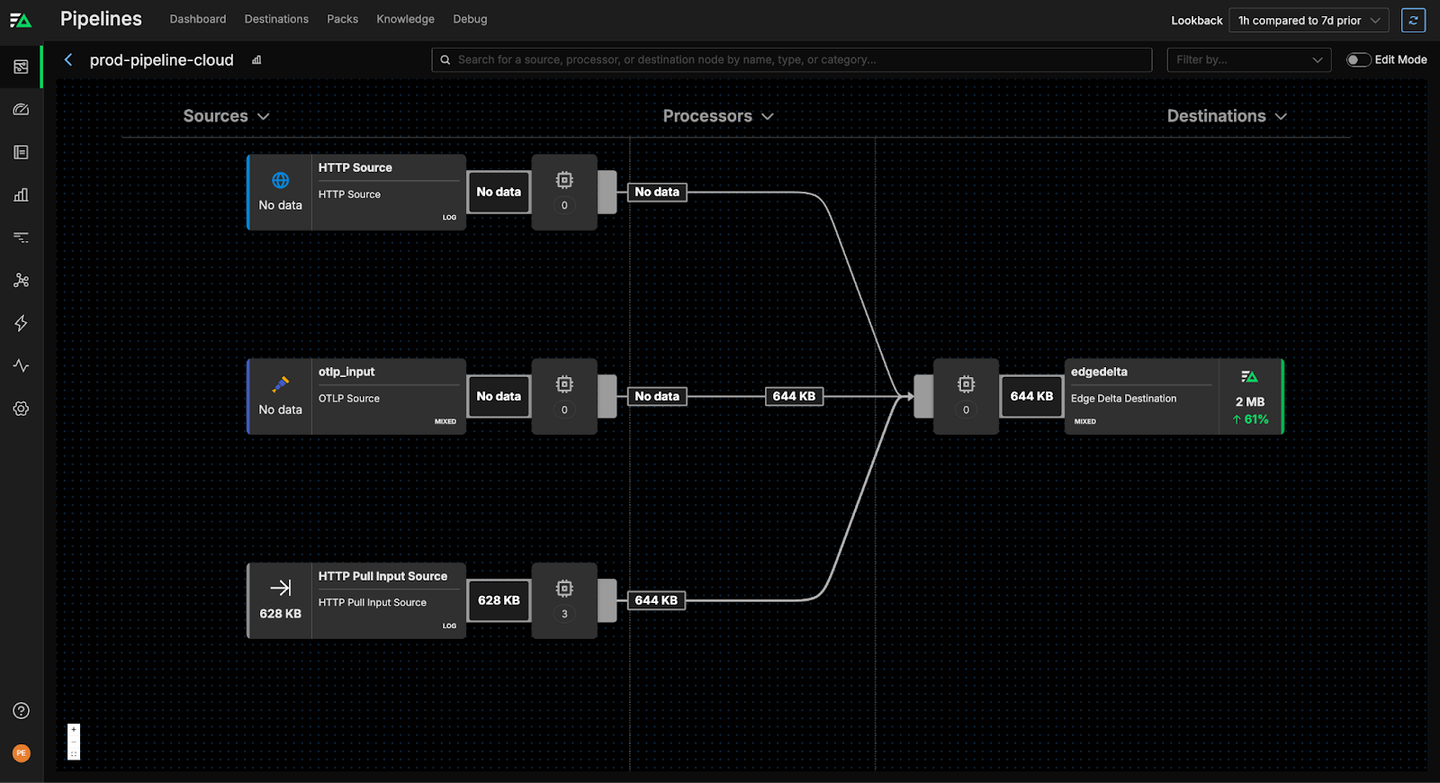
Once the pipeline configuration is updated, the node will begin hitting the local API and collecting telemetry data from the responses:
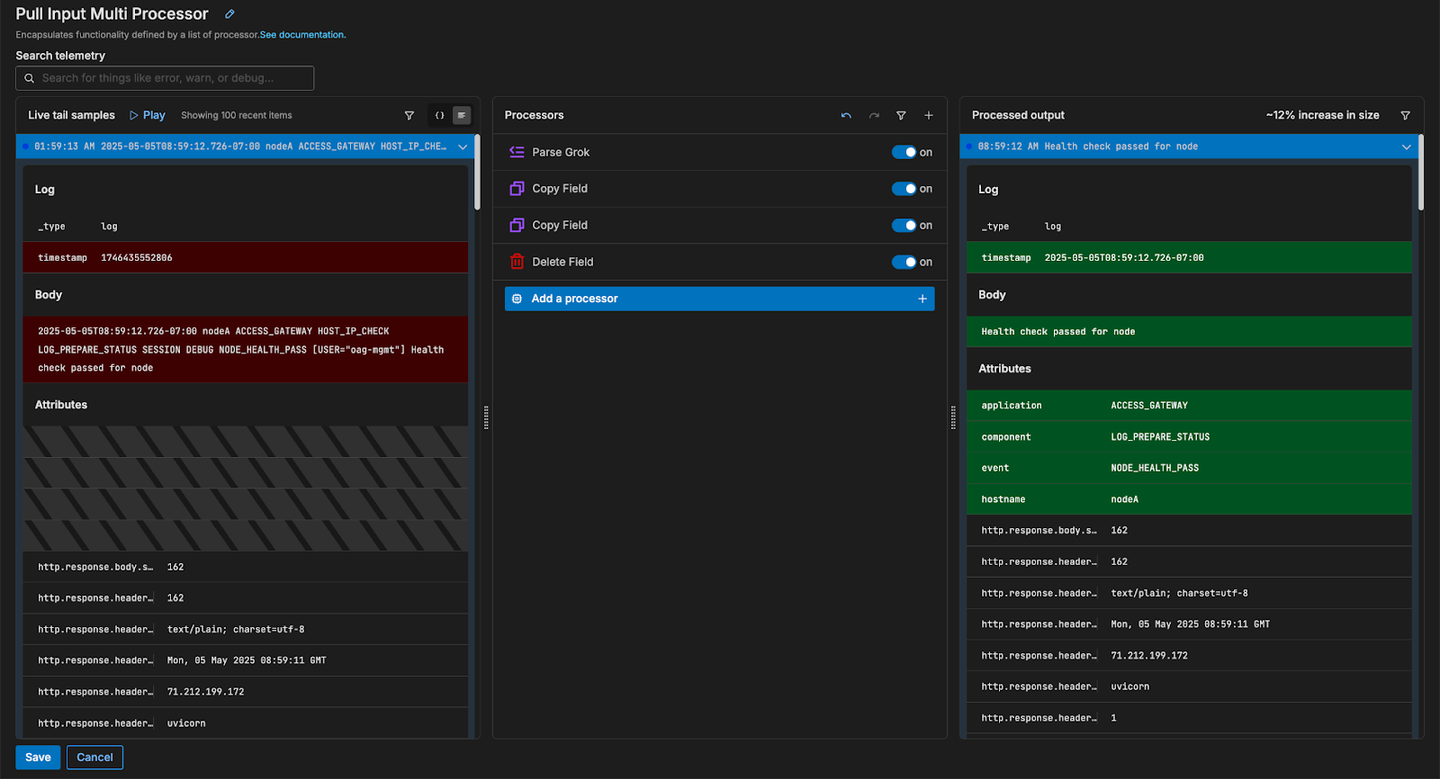
From here, incoming data can easily be parsed, enriched, and optimized within Edge Delta’s Live Capture view:
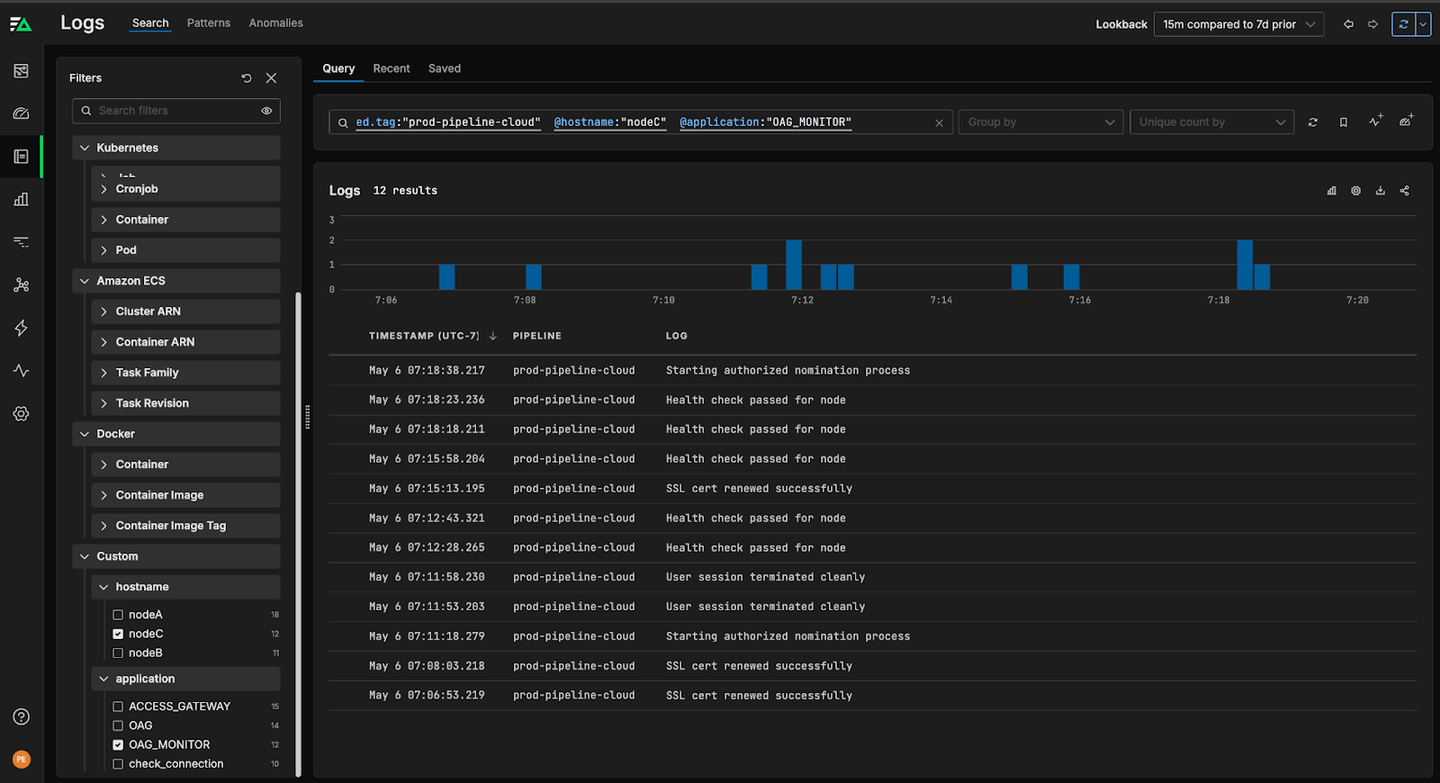
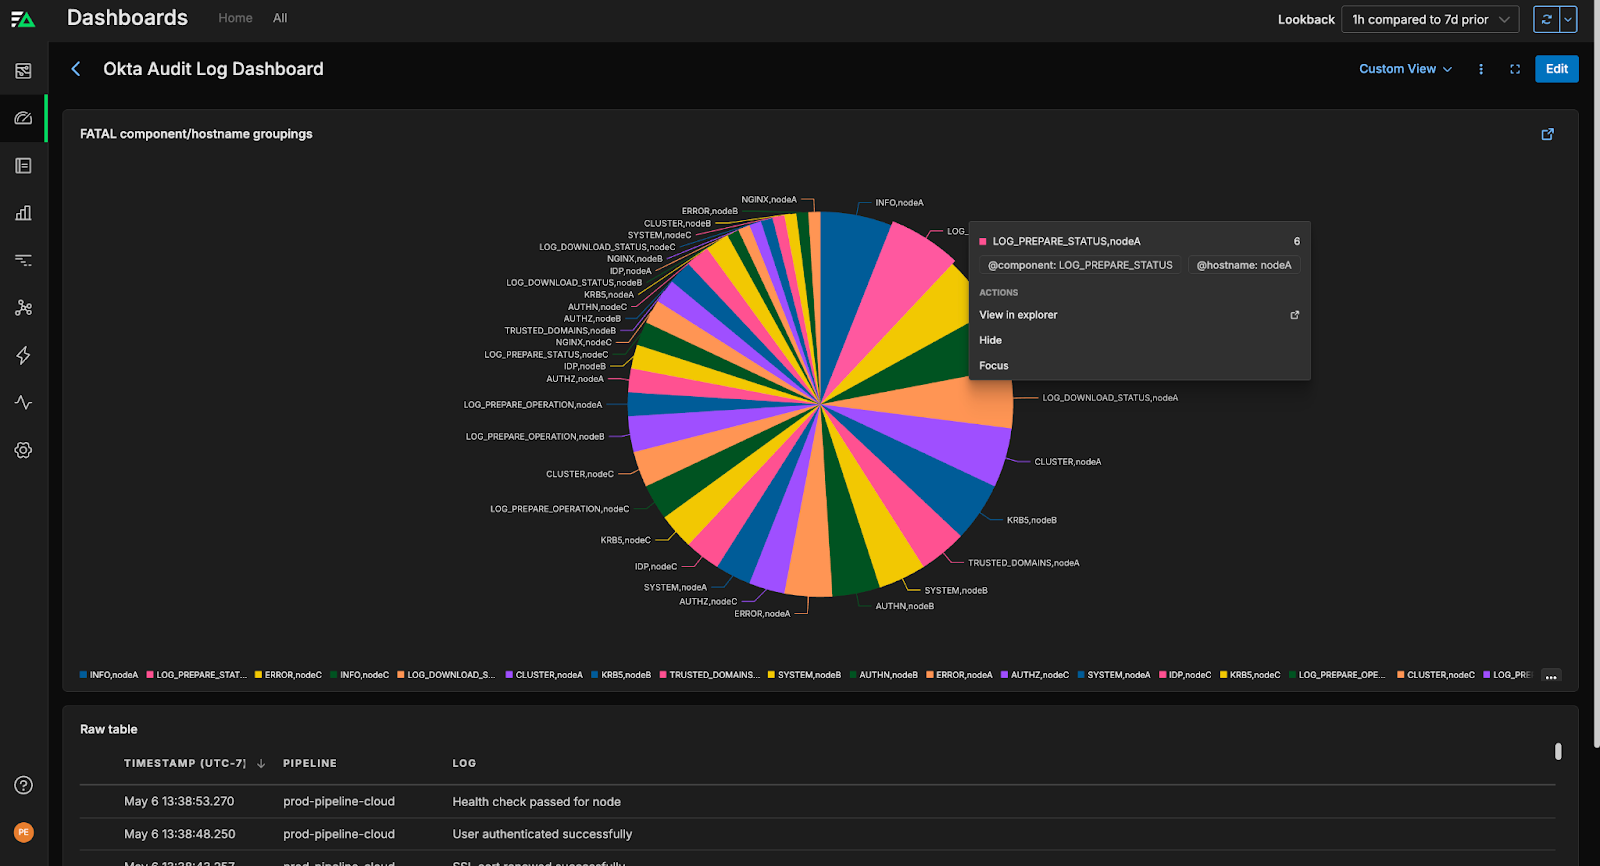
Once ingested, this log data can be sent to any downstream destination — including third-party observability platforms, SIEMs, and archival storage solutions. This particular pipeline is sending data into Edge Delta’s own Observability Platform, where it can be filtered by facet in order to home in on attributes like application or hostname:
Custom dashboards can also be created to visualize the status of important log values. For instance, a pie chart depicting counts for FATAL-type logs grouped by component type and hostname can instantly reveal problematic log segments:
Get Started
Pull-based data collection remains an important part of monitoring third-party SaaS platforms, but traditional approaches require significant manual overhead. With Edge Delta’s HTTP Pull Input node, teams can ingest pull-based telemetry data with ease, ensuring that all critical systems — including third-party services — remain fully visible.
If you’d like to learn more about Edge Delta’s HTTP Pull Input node or intelligent Telemetry Pipelines, check out our playground environment or start a free trial.