(Learn more on optimization here). However, digging a bit deeper into how that optimization occurs reveals that it’s an outcome of automated distributed queries, as are augmented metrics and anomaly detection, and looking at Edge Delta as a cost savings tool is just the tip of the iceberg in functionality and inevitable value.
“Inevitable value”, what does that mean you’re probably asking yourself. Well, that’s exactly what I’m here to discuss. It’s no secret that Kubernetes and microservice architectures are changing the face of modern infrastructure and application architecture, and the amount of logs generated from that and other changes and adaptations in IT continue to grow. According to a recent study, the amount of data created per day was 2.5 quintillion bytes in 2020. Now not all of that is log data, but that’s 2500000000000000000 bytes a day and it’s only growing. Furthermore 90% of all data was created in the last 2 years! As a result, we’re finding ourselves in a place where making sense of those logs in a centralized tool is harder to do, and real time analysis and determination of patterns and correlations is no longer feasible due to both responses in queries as well as pure volumes of data to analyze. This problem is only going to exacerbate further as we gather more and more logs, but there is hope!

At its base, Edge Delta automates distributed queries – it automatically creates patterns based on incoming log messages and then matches subsequent incoming log messages against them. It then pulls out the important information in these patterns while capturing insights about the patterns themselves.
Let’s take a log message for illustration on the extraction. The one below is structured in json, but it could easily be unstructured as well. In this message, there is information that we care about, however the majority of it is wasted bytes.
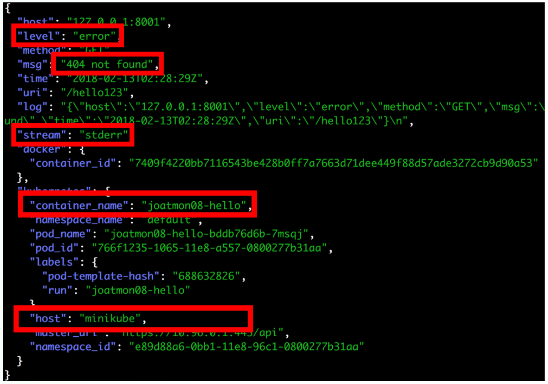
Now think about how many times you normally get a similar log message? By extracting only the information that’s important, the logs are just as meaningful as before but much more optimized.
But why stop there?! Because the Edge Delta Agent is generating patterns off of these messages and extracting the important information, metrics about those patterns themselves can be aggregated, counted, averaged, and analyzed.
In the log lines below, we can see that not only are we automatically identifying the pattern, but we’re also augmenting the meaningful data which would otherwise not be captured by gathering the average, standard deviation, 95th percentile, and 99th percentile for both the response and number of bytes.
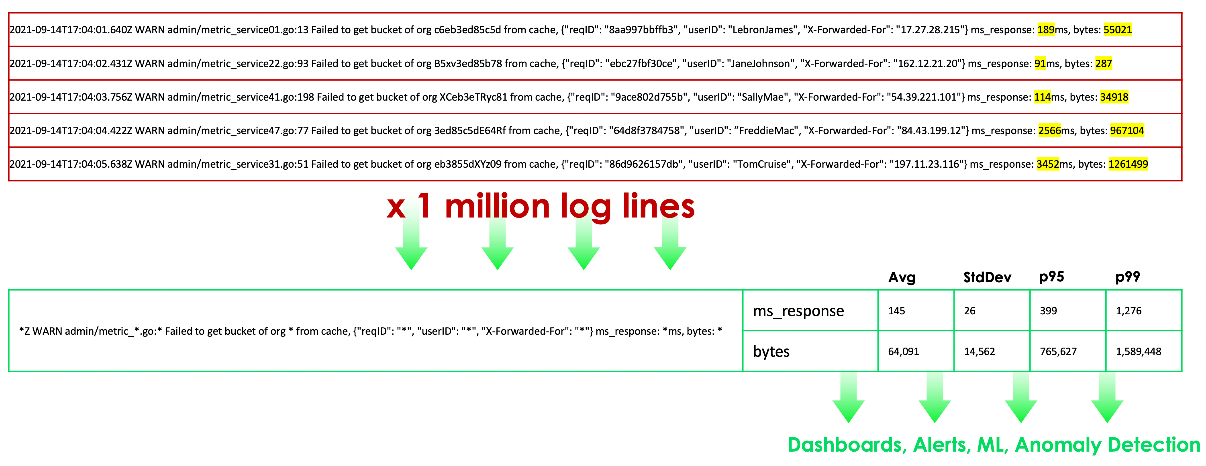
This data can then be forwarded to a centralized logging tool, a time series analysis tool, or the Edge Delta backend for further analysis across multiple agents, however our Agent isn’t done just yet… Now that we have metrics about the log messages themselves we can start looking for anomalies at the agent level, on the edge! We assign these anomalies a confidence score based on deltas in the previous time period, sentiment, and a few other ingredients. For more information about our Anomaly Score and Capture, contact us.
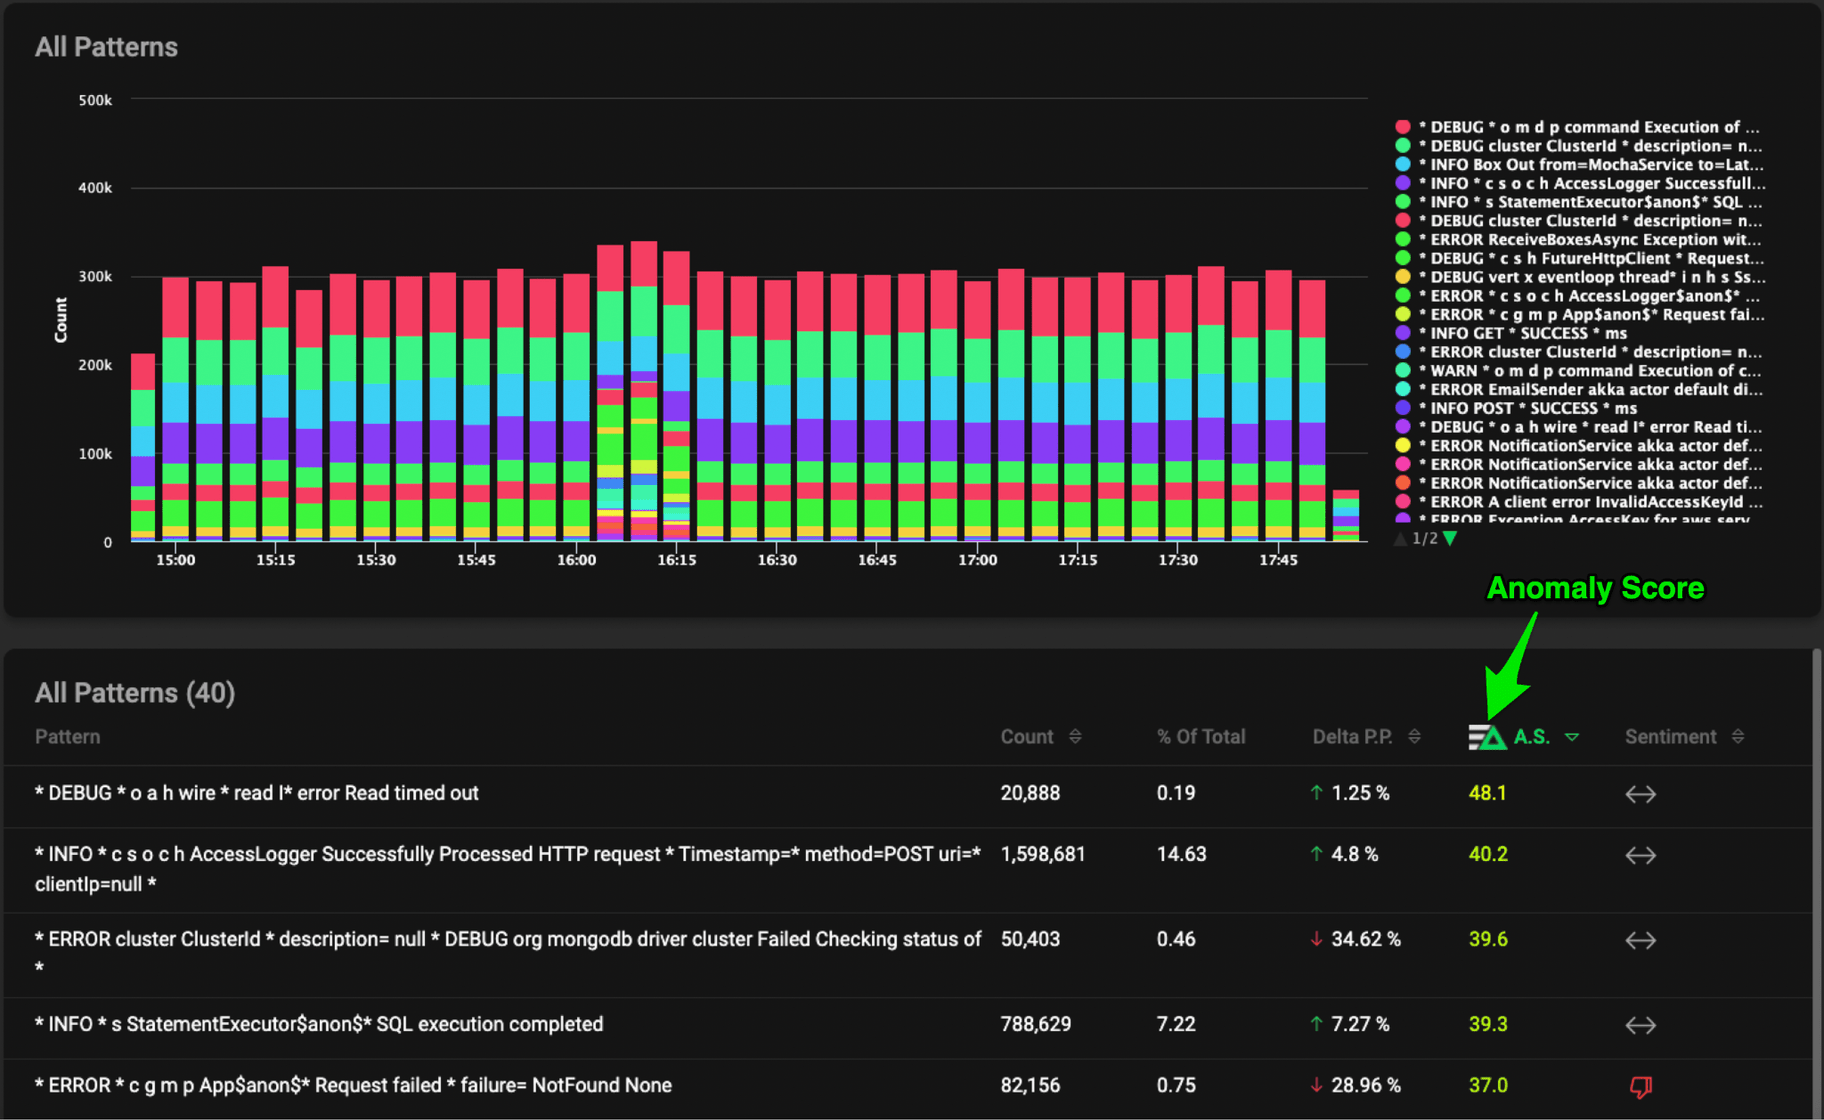
Again, this is all happening at the EDGE!!! Preprocessing the messages and detecting anomalies BEFORE you put the data into your centralized system.
Think you kinda get it, but still not sure why you wouldn’t do it at the centralized level? I know I certainly had that question, so let me break it down:
- You’re getting automated anomaly detection as it happens, not later in the process after the data has been collected and aggregated with many other logs.
- The anomaly detection uses augmented metrics that are insights on the patterns; not in the log messages itself. Simply put, you wouldn’t have this data.
- The patterns are generated automatically by messages coming in. In a centralized system, how would you know what patterns to look for? How long would that take?
Now this data can be sent directly to your centralized logging system or time series tools for further analysis, or to the Edge Delta backend where we look for correlations between anomalies from across agents for an even more holistic view.
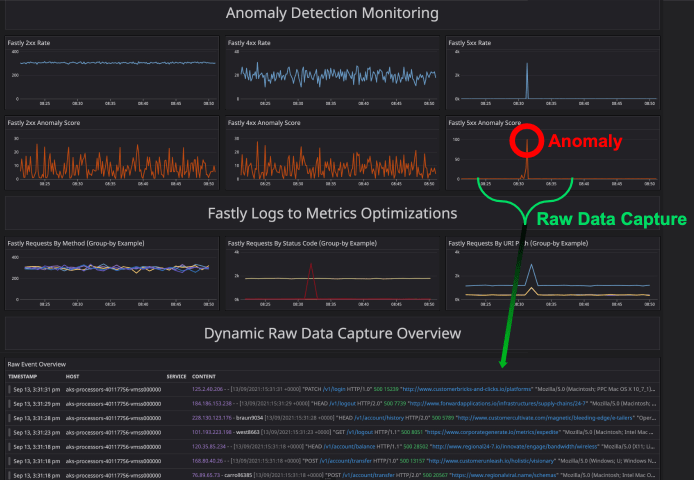
But what about the raw logs? Once an anomaly is detected, nothing is going to beat the raw logs for digging in and troubleshooting. An Edge Delta Anomaly Capture (EDAC) leverages a configurable circular buffer for dynamic raw data capture. This means when an anomaly occurs, you get raw data from before and after the occurrence.
If you are interested in learning more, don’t hesitate to shoot me a message at karl@edgedelta.com, on LinkedIn, or get started with a free trial today!


