Today, we’re launching a free tier of Edge Delta that aims to provide the simplest monitoring and troubleshooting experience for teams running applications in Kubernetes. Edge Delta Free Edition can be set up in a matter of minutes and automates many of the manual tasks traditionally associated with monitoring, so your team can quickly realize value.
It is available now and can be deployed directly from our website.
Before diving into the product in greater depth, let’s discuss why we built it.
Today’s Log Management Tools Are Manual and Complex
When we talk to our customers, we consistently hear that developers want two things from their log management tooling:
- An easy and credible way to check the health of their services
- A quick and seamless way to troubleshoot any issues that arise
Traditional log management tools simply weren’t built to prioritize the developer experience – most of the solutions in market are overly manual and require expertise when investigating issues. These traits have become more problematic as teams adopt microservices and shift to a continuous delivery model.
When monitoring applications running in Kubernetes environments, it’s hard for these tools to keep up with the volume of data being created and the dynamic nature of resources. Moreover, Kubernetes clusters consist of multiple layers of components, each of which needs monitoring. Now, every time teams deploy or update services, the user must be conscious of both the behaviors and the components they’d like to monitor. Then, they must build or update alerts, dashboards, and monitoring logic to ensure the service is working in production.
These manual steps often cause developer teams to either slow down software delivery or delay visibility when they ship code daily. And these problems compound with every deployment since most tools aren’t “set it and forget.”
We also see several shortcomings in the troubleshooting process:
- When an alert fires, engineers must manually sift through error logs and correlate the messages to the issue, slowing resolutions.
- If the anomaly originates with a small subset of users, they might not have rules built to detect the issue before it has a larger impact.
- If the developer is capped on the volume of logs they can collect, they might not even see the anomaly.
Overview of Edge Delta Free Edition
The net impact of the above challenges comes down to this: traditional log management tools ask for a lot of time and effort from their users, and they weren’t built to support applications running in Kubernetes. We want to give time back to these teams by making monitoring and troubleshooting simple in Kubernetes environments.
Edge Delta Free Edition does so by packaging many of our core features into a free, easy-to-setup offering that helps teams:
- Automate Monitoring Toil
- Reduce Noise in Your Log Data
- Improve MTTI and Alert Integrity
Start a free trial
Automate Monitoring Toil
The first area Edge Delta adds value is by automating manual tasks traditionally associated with monitoring and log management. Edge Delta Free Edition requires little-to-no setup. Once deployed, it automatically monitors and baselines your datasets, surfacing insights to help you maintain service health. The platform adapts to every deployment, so your team can ensure each service is working as intended, without spending cycles configuring or updating dashboards, alerts, and other monitoring logic.
This trait is particularly beneficial to teams that are practicing continuous delivery. In these scenarios, Edge Delta automatically discovers new deployments and begins monitoring them as soon as they’re launched. As a result, your log management and analytics tooling can keep up with the pace at which you deliver software.
Reduce Noise in Your Log Data
Log data can be very noisy and difficult to make sense of. Edge Delta provides clarity into these datasets, even when you don’t know what questions to ask. The platform automatically runs analytics on all your log data as soon as it’s created, surfacing insights through intuitive, out-of-the-box dashboards.
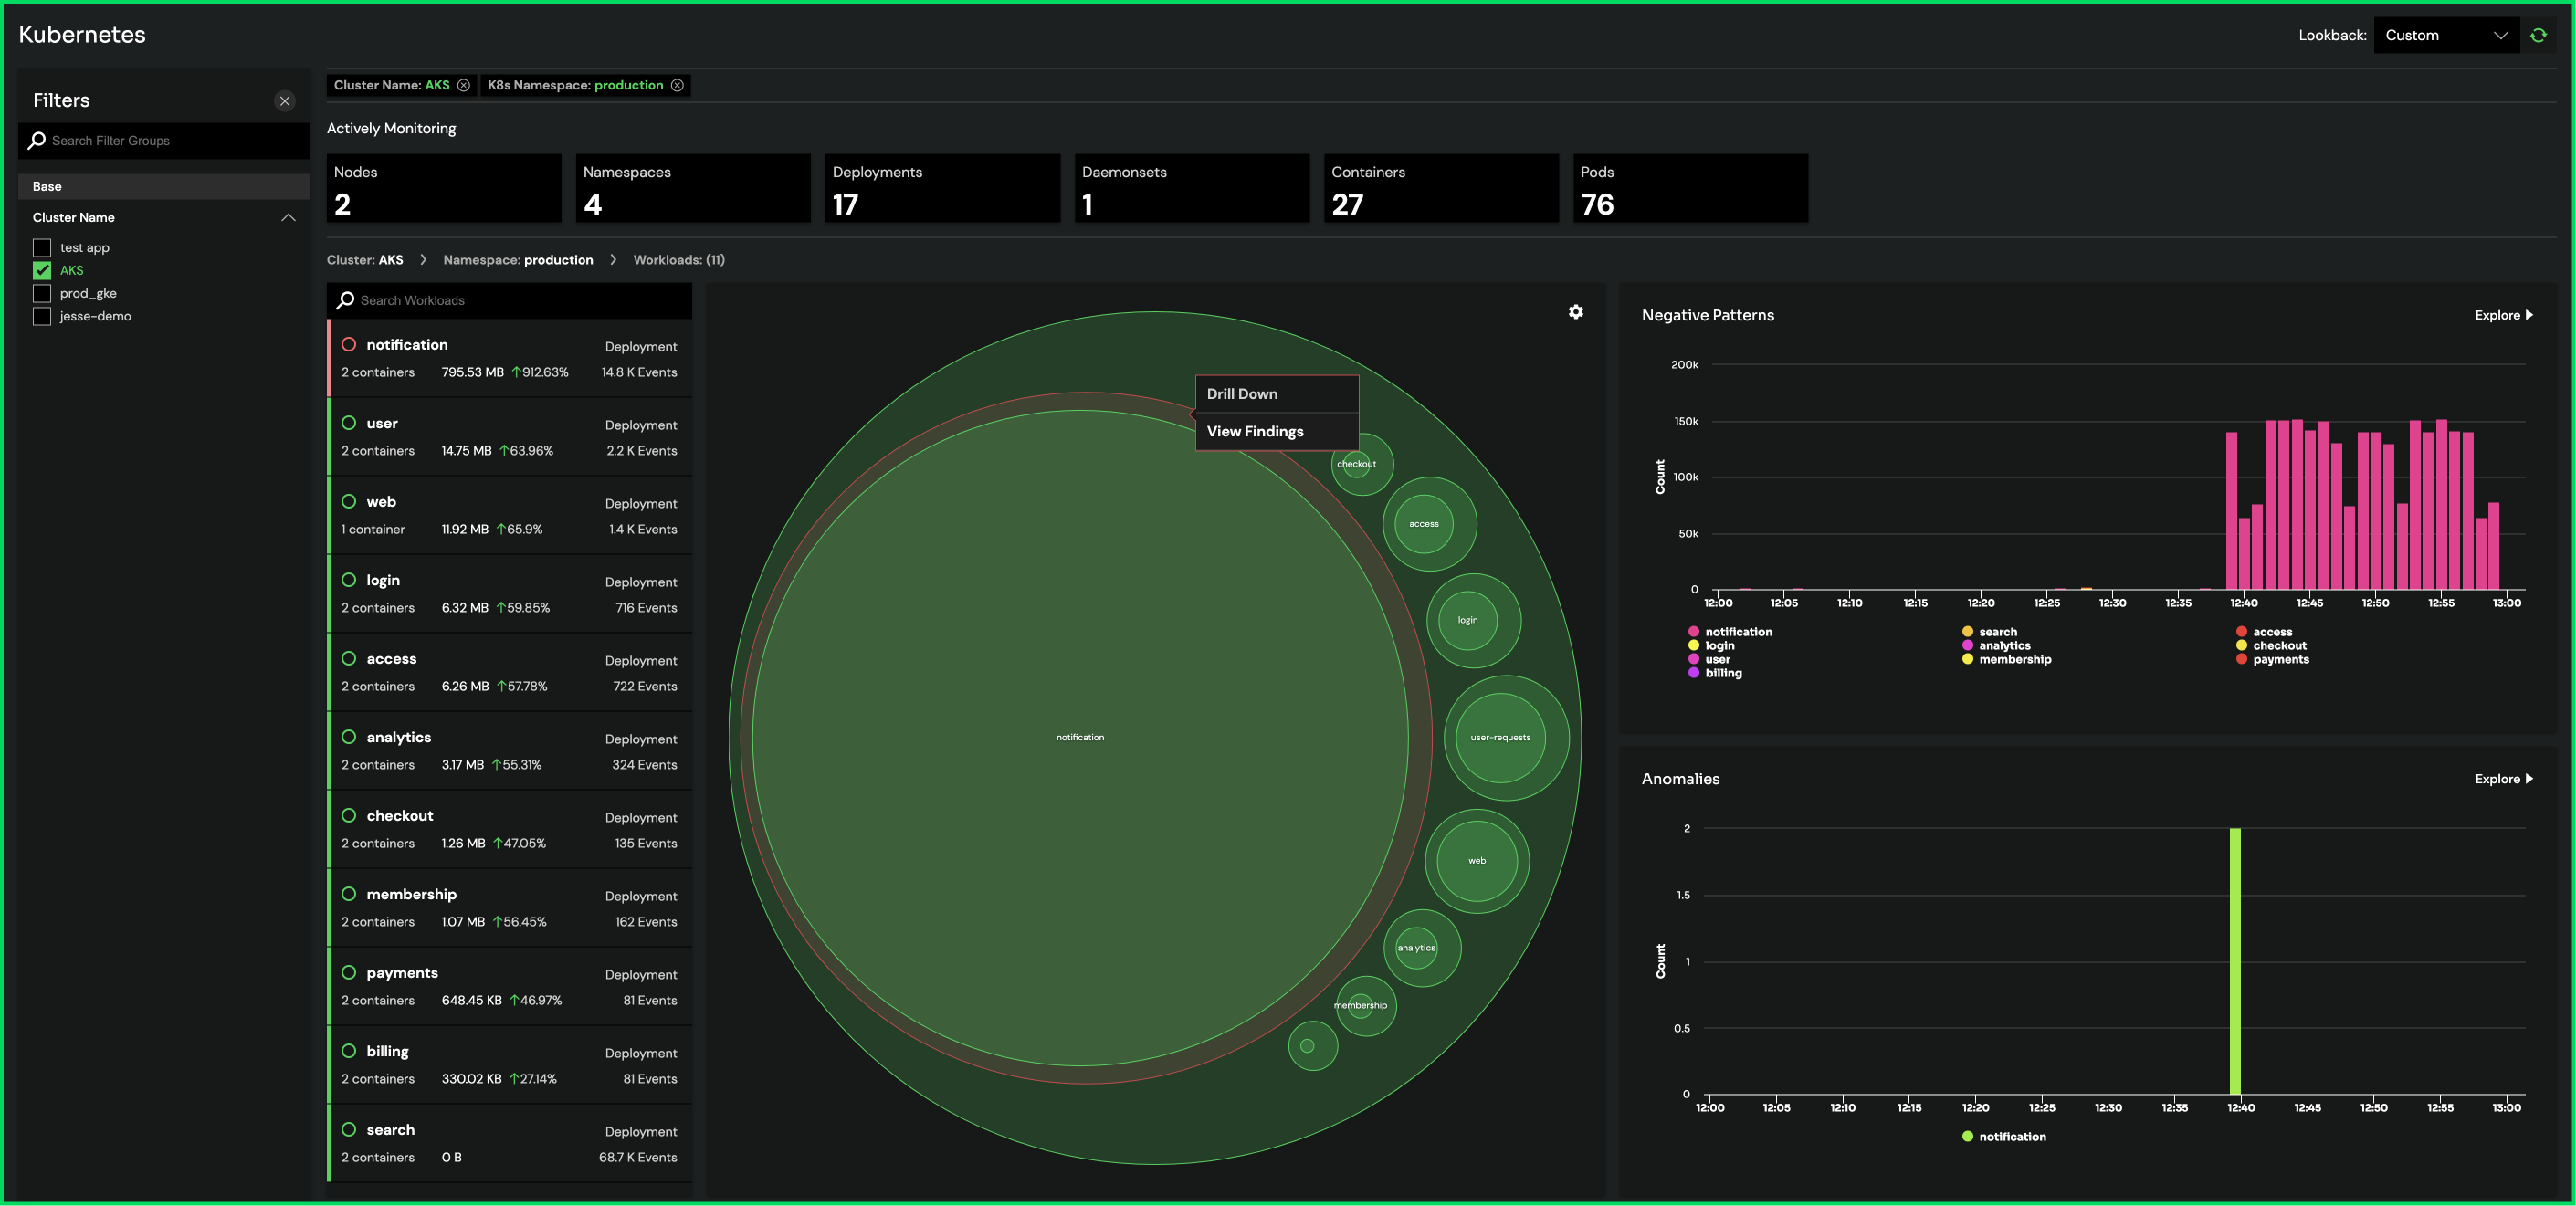
The insights are optimized for Kubernetes environments, making it easy to understand what is happening at each layer of a cluster. Operations teams can leverage our Kubernetes Overview to visualize the health of Kubernetes resources and drill into individual components for investigation.

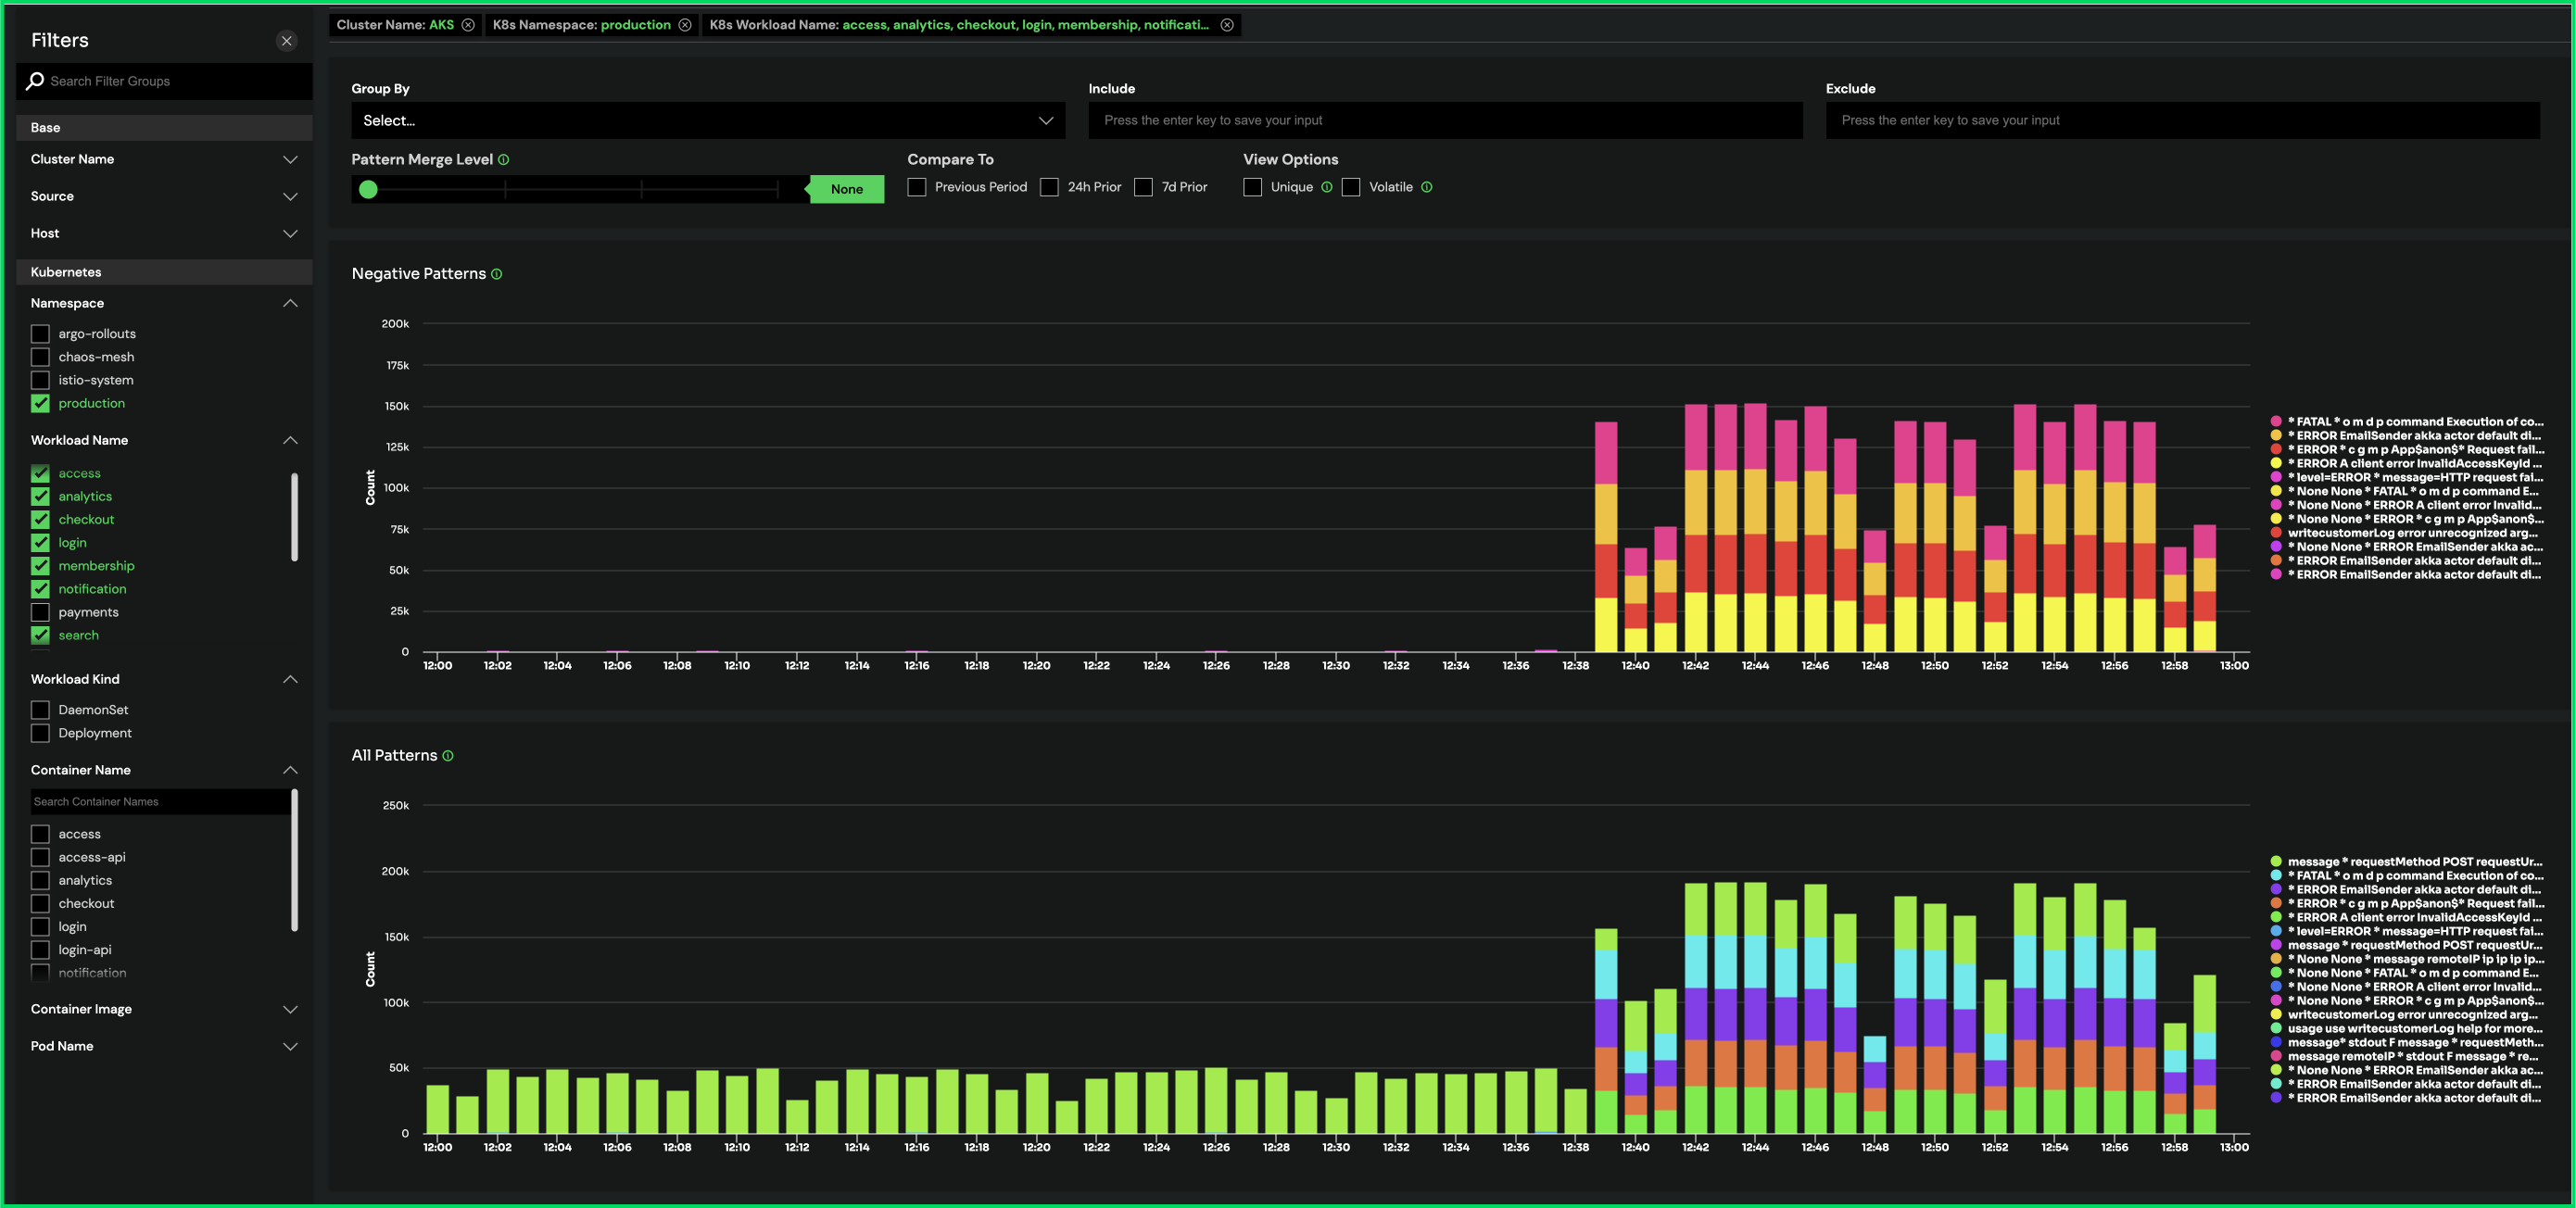
In the Patterns view, every recurring logline is aggregated into a cluster, instead of requiring you to sift through tons of raw data. Edge Delta provides analytics around each Pattern, so you can understand the scope and sentiment of message. This feature makes it easy to spot any changes or new behaviors. Patterns can be organized by different components so, for example, you could isolate behaviors at a namespace or container level.

Improve MTTI and Alert Integrity
Before, teams had to manually create rules-based alerts and sift through loglines to troubleshoot issues. With Edge Delta, you can automatically detect every anomaly – even unknown problems or issues you haven’t built rules to catch. When the platform detects an anomaly, it surfaces the data contributing to the alert and the components that are affected. This makes it easy for teams to understand the root cause, saving hours in troubleshooting time.
Get Started Today
Edge Delta’s free tier can be launched directly from our website. It is completely free to ingest up to 10 GB per day of log data and supports up to 10 nodes.


