
In many modern Linux distributions, systemd serves as the backbone for system initialization and management. It oversees system services, processes, and resources across the host, and provides users with service control through the systemctl command.
One key component of systemd is journald — the logging service that collects, stores, and exposes logs from the kernel to the application, including kernel errors, process crashes, system updates, and more. These logs provide essential infrastructure visibility for observability teams, enabling them to identify and remediate issues as they occur.
While these logs are valuable for maintaining system security and health, collecting and shipping them for analysis presents a few challenges. For one, forwarding journald messages to external systems using custom collectors adds significant processing overhead, making this approach unsuitable for high-throughput environments. Additionally, the verbosity of many journald messages — while valuable for advanced filtering— makes them harder to index and query at scale.
With Edge Delta’s Telemetry Pipelines, teams can efficiently collect high volumes of journald log data, optimize it pre-index, and securely deliver it to downstream platforms for streamlined analysis. In this post, we’ll walk through how to configure a Telemetry Pipeline to route optimized journald logs into the Edge Delta Observability Platform — and how to analyze them effectively once they arrive.
Collecting Journald Logs with an Edge Delta Telemetry Pipeline
Edge Delta offers structured journald log collection for any Linux distribution, removing the need for brittle collectors or complex scripts. To illustrate how it works, let’s configure a Node Pipeline to collect and process journald logs generated by an Ubuntu Linux machine.
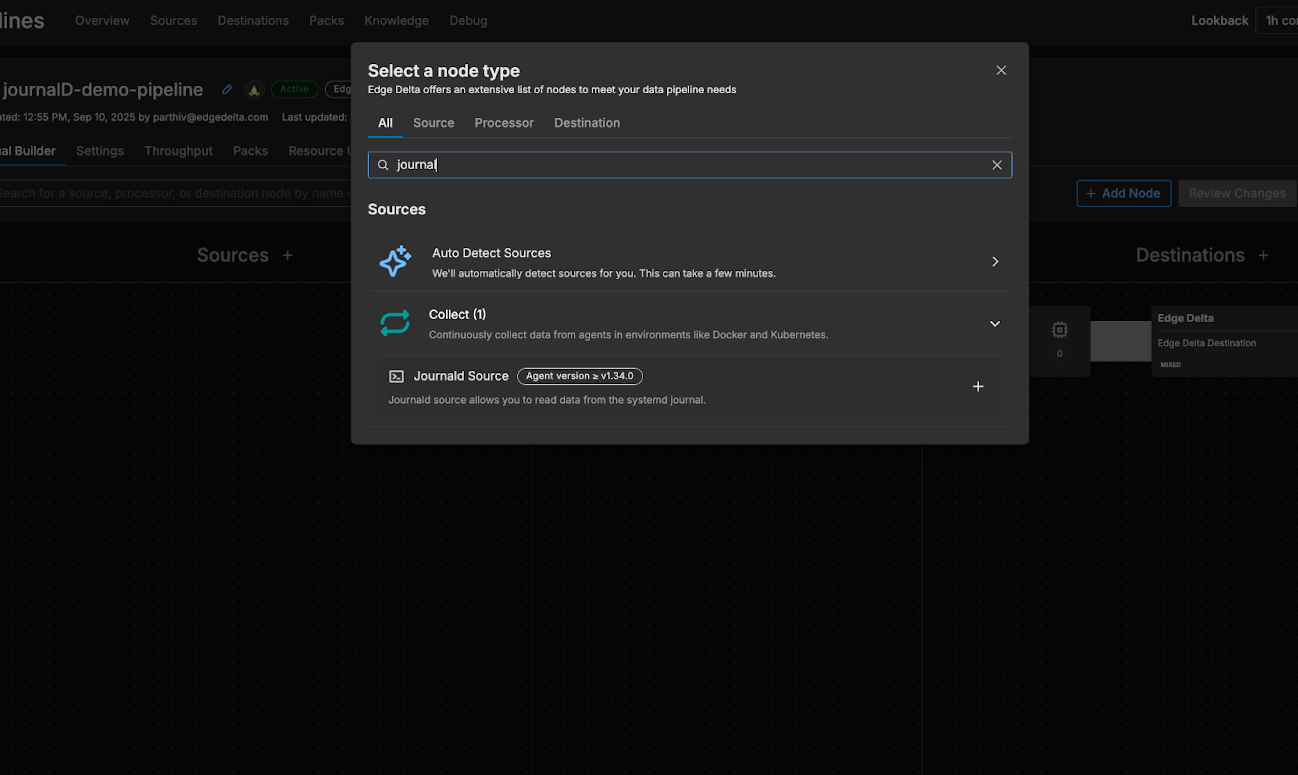
First, we’ll follow the documentation to deploy a new Linux Node Pipeline on our Ubuntu host. Then, we’ll add a new Journald source node to the pipeline by selecting “Add Node” and choosing the journald source node from the menu:
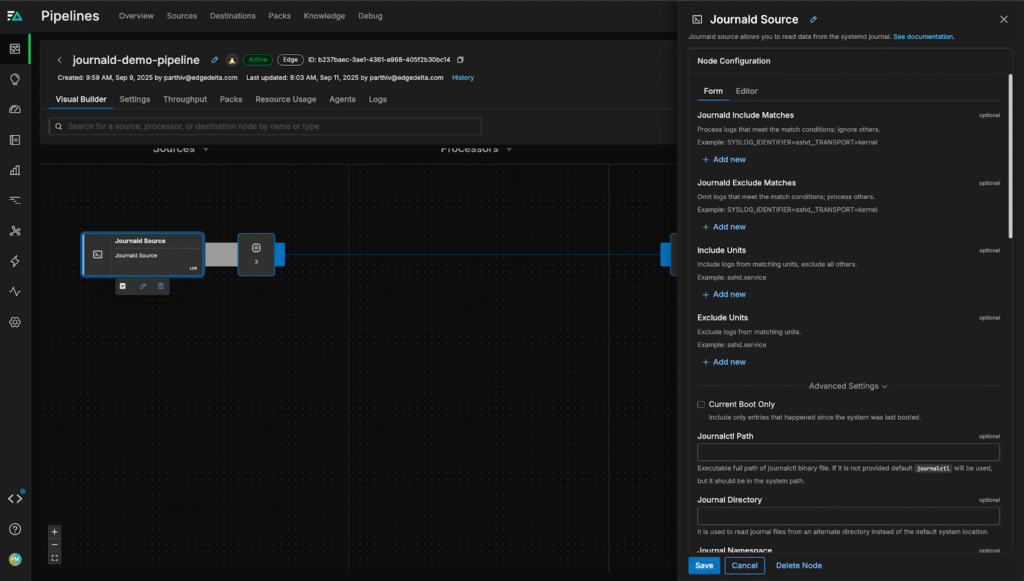
From here, we can configure the node’s “Include Matches” and “Exclude Matches” fields to tell the pipeline what journald log data to collect. For now, we’ll stick with the default settings and collect everything, so we’ll leave both fields blank:
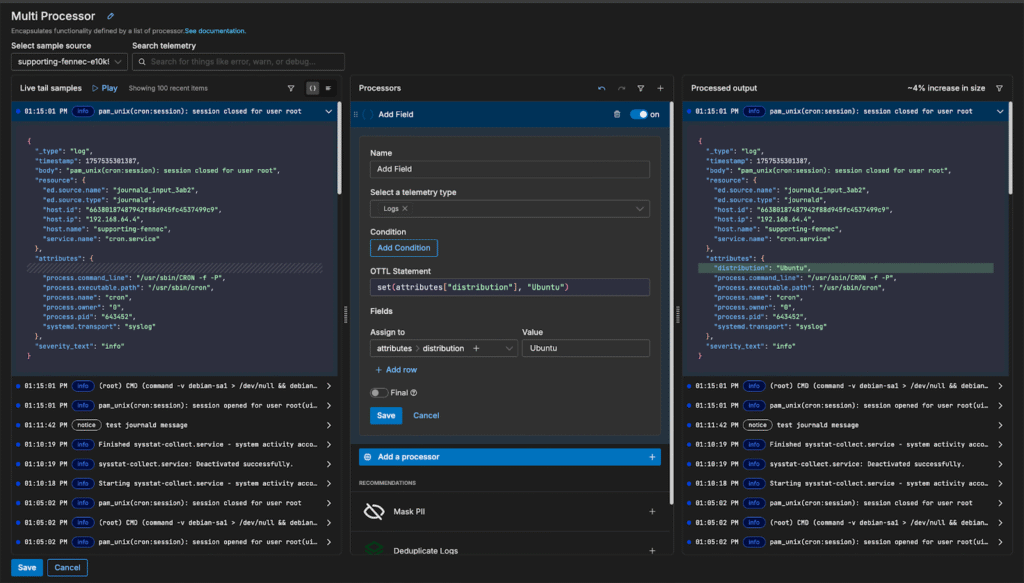
Once the new pipeline configuration is saved, logs will immediately start flowing. We can now enrich the data with key tags to help correlate them with specific workflows or applications. For example, we can tag logs with “Ubuntu” to distinguish them from other distributions and segment them more easily downstream:
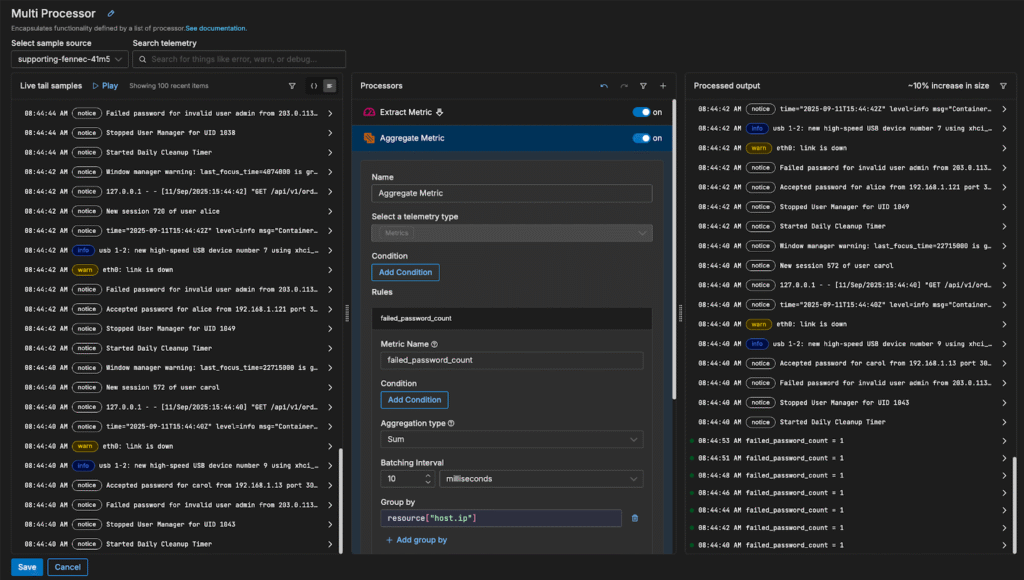
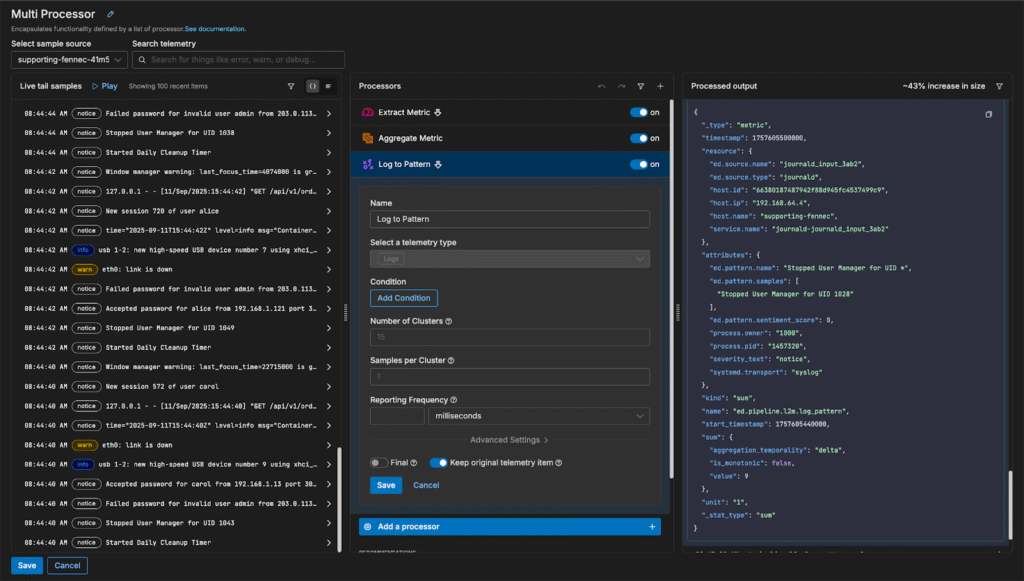
We can also convert logs into metrics before indexing in order to isolate particular trends we’re interested in. In this case, let’s keep track of the number of failed ssh attempts into our machine over time. To do this, we can add an “Extract Metric” processor to capture each failed login attempt, and add an “Aggregate Metric” processor to group them into a single metric:
We’ll also add a Log to Pattern node to leverage Edge Delta’s in-pipeline intelligence and capture dynamic log trends:
Analyzing Journald Logs in Edge Delta’s Observability Platform
Once data is flowing into Edge Delta, we can start analyzing it to identify and resolve issues on our Ubuntu machine. First, we can visit the Metrics page to track the “failed_password_count” metric we created in the previous section:
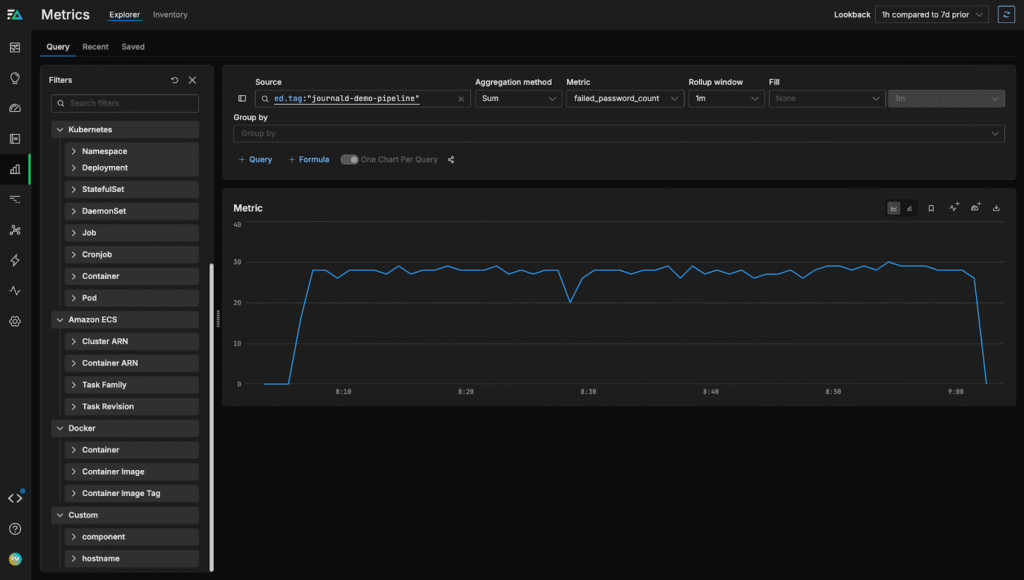
As you can see above, there’s been a spike in failed ssh attempts in the last hour. We can dive into the logs to explore this further:
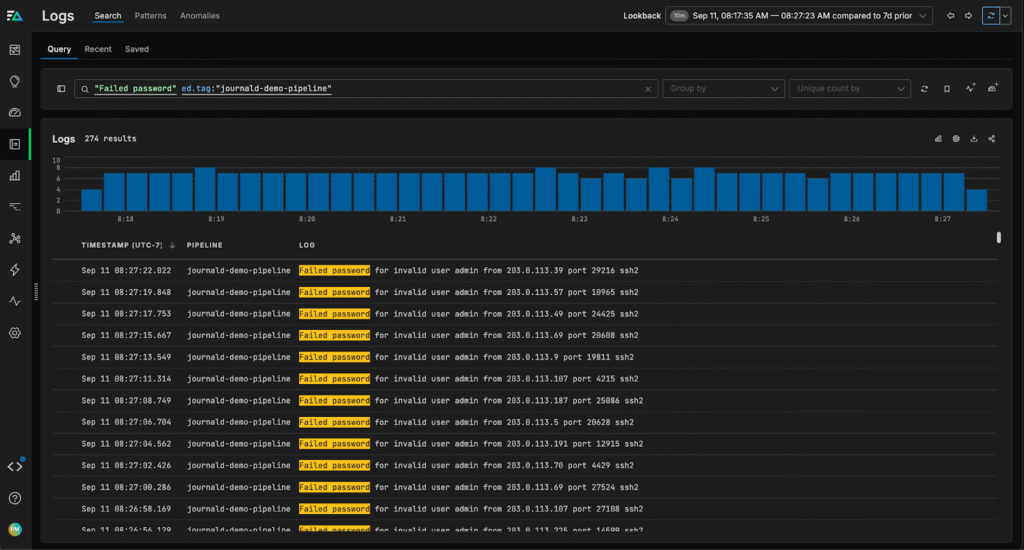
We can see a large number of “invalid user admin” login attempts, which are login attempts without a recognized username. This is a clear security issue, and we can now swiftly take steps to fortify our host and tighten authentication policies to ensure it remains secure.
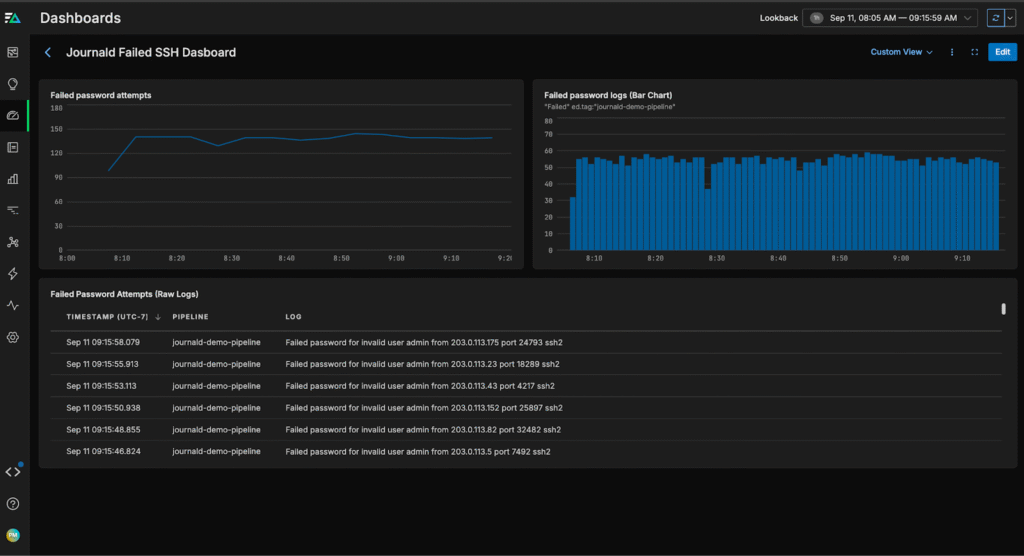
We can also create a custom dashboard for our journald data, which will accelerate issue detection in the future:
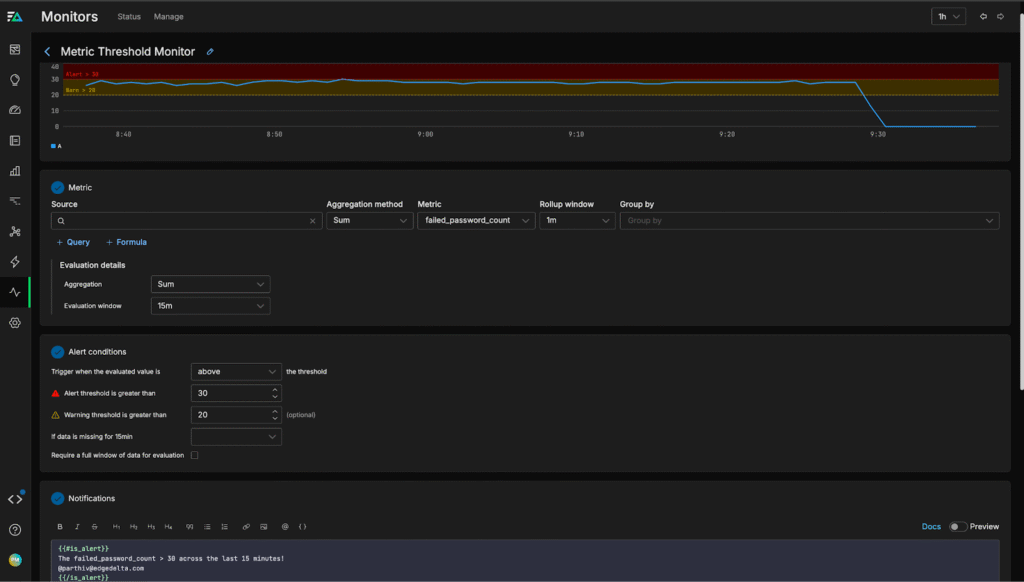
Lastly, we can create a monitor to alert us when failed password attempts cross a pre-defined threshold:
Conclusion
Journald logs provide critical infrastructure visibility for teams running applications on Linux hosts. By capturing key information about kernel events, system services, user commands (like SSH logins), and more, these logs enable teams to analyze system performance and maintain host security.
With Edge Delta’s Telemetry Pipelines, teams can manage modern journald log volumes much more effectively with pre-index processing. This allows them to enrich data, convert logs into metrics, and intelligently identify anomalous patterns in real time. Once the data is indexed downstream (in this case, in Edge Delta’s Observability Platform), teams can quickly visualize these logs and metrics to detect and resolve issues at scale.
To explore Edge Delta yourself, check out our free, interactive Playground environment, or start a free trial.