Distributed tracing is a type of telemetry that enables engineering teams to observe requests as they flow through a distributed system. It provides the information needed to determine the following:
- Where user requests went
- Request processing time
- How services connect
- The failure point of a request
It follows an interaction and tags it with a unique identifier.
Jaeger, a prominent tool in distributed tracing, plays a vital role in distributed ecosystems. It provides a way to collect, store, and visualize traces across microservices, enabling system monitoring and troubleshooting.
It is an open-source distributed tracing tool for monitoring and troubleshooting large-scale microservice environments. Jaeger enables users to track the status of requests as they pass through a network of microservices.
Moreover, Jaeger provides benefits such as:
- Real-time monitoring of transactions and performance
- Root cause analysis
- Service dependency visualization
Jaeger’s Kubernetes integration and support for Elasticsearch and Cassandra make it a reliable solution for large-scale and dynamic environments. Implementing Jaeger helps you understand how different services interact with and depend on each other. It also aids in quickly identifying performance bottlenecks and enhancing debugging capabilities.
This article covers Jaeger’s architecture and essential steps for implementing tracing with Jaeger, from setup to visualizing and analyzing trace.
Key Takeaways
- Distributed tracing tracks requests as they move through the system, providing crucial visibility into microservices interactions.
- Jaeger is a prominent distributed tracing tool that plays an important role in distributed ecosystems.
- Jaeger sheds light on how microservices and requests behave in a distributed system.
- Installing the Jaeger backend for distributed tracing depends on your environment and needs.
- In distributed tracing, sampling is important to find the right balance between a lot of data and useful information.
- Visualizing and analyzing traces involves checking the Jaeger UI for performance issues.
An Introduction To Jaeger Tracing Architecture
Jaeger is made up of several key components that help it run smoothly and efficiently. Its key components work together to gather and visualize data as it travels through the system.
Here’s what Jaeger architecture looks like:
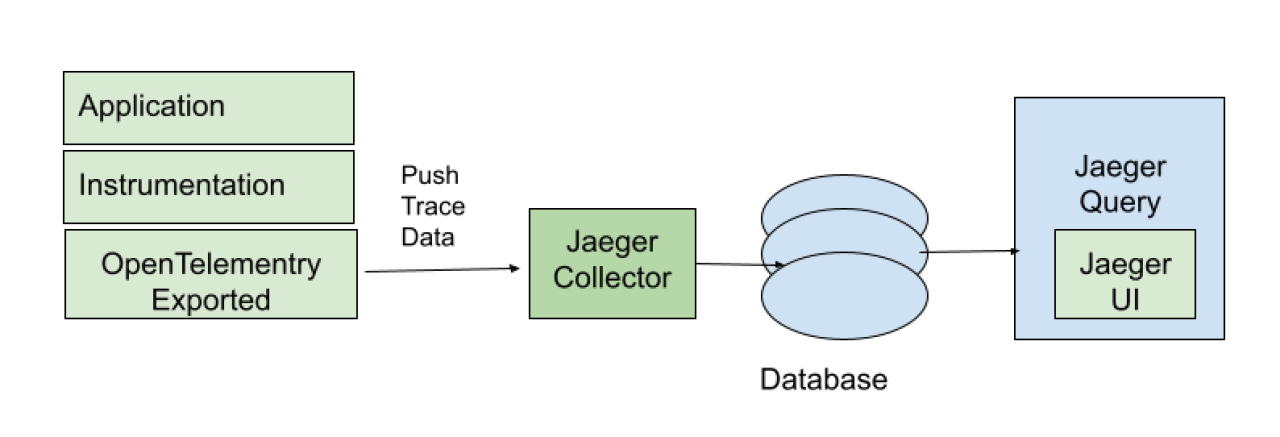
Note:
Jaeger-agent is deprecated. OpenTelemetry data can be sent directly from the OpenTelemetry SDKs (equipped with OTLP exporters) to the Jaeger-collector.
Jaeger Client Libraries — Jaeger provides client libraries for various client programs, like the following:
- Go
- Java
- Python
- Ruby
- PHP
These libraries let developers add tracing code to generate spans and propagate context. They also provide tools for injecting and extracting tracing context from request headers when communicating between services.
Agent
The Jaeger agent batches and sends UDP spans to collectors. This infrastructure component is meant for all hosts. Agents abstract collector routing and discovery from clients. They receive spans from instrumented applications and send them to the Jaeger collector.
Jaeger Collector
The Jaeger collector receives traces from Jaeger agents and passes them through a pipeline for processing. It validates, processes, and saves the traces in the database. It supports various protocols for receiving traces, including Thrift over UDP, gRPC, and HTTP/JSON. The collector can perform span aggregation, sampling, and storage operations.
Query
A service retrieves traces from the storage backend and passes them to developers for tracing through the Jaeger UI. The Jaeger Query Service provides an interface for querying and retrieving trace data from the storage backend. It serves as the backend for the Jaeger UI and other visualization tools. The Query Service supports various query operations, such as searching for traces based on service names, operation names, tags, and timestamps.
Ingester
Ingester is a service that reads trace data from Kafka and writes it to a storage backend like Cassandra or Elasticsearch.
Storage
The Jaeger tracing system receives spans and stores them in a persistent storage backend or database. Persistent storage means the stored data remains intact even if the computer is powered off.
Jaeger Console
A software program that presents all the tracing data using graphs and charts. It has a user interface that you can use to view and analyze traces.
Jaeger provides insights into how microservices and requests behave in a distributed system. As such, the common use cases of Jaeger include the following:
- Performance optimization: Jaeger optimizes resource allocation by visualizing service dependencies and microservice delays.
- Root cause analysis: Jaeger helps developers find application bugs in the microservice architecture.
- Security and compliance: Traces can provide an audit trail of data flow through a system, which is essential for data handling and processing regulations.
- Development and testing: Jaeger tracing in local environments lets developers find errors, latency, and dependency issues before deploying an app.
- Latency optimization: Jaeger analytics can find microservice bottlenecks that slow applications. Jaeger helps developers track and accelerate microservices.
- Distributed transaction monitoring: Jaeger offers alerts to monitor request data across the system to identify and mitigate issues.
- Service dependency analysis: Jaeger helps developers understand complex microservice relationships. It maps and visualizes complex microservice interconnections, showing all dependencies.
- Distributed transaction monitoring: Jaeger can monitor data movements between microservices to help developers patch issues before they affect user experience.
Jaeger assigns a trace ID to each request and propagates it across microservices. Spans represent individual system units, and tracing context is injected into outgoing and extracted from incoming requests. A backend storage system stores trace data for Jaeger UI querying and visualization.
Continue reading to learn the detailed steps for implementing tracing with Jaeger.
Step-by-step Guide on How to Implement Tracing with Jaeger
This Jaeger tutorial will cover five important steps for getting started with Jaeger tracing:
- Setup Jaeger backend (Collector, Query, Storage), including choosing the deployment method
- Instrumenting code by selecting a compatible client library
- Deploying Jaeger agent on the application server
- Configuring sampling strategies to manage the volume of trace data collected
- Visualizing and analyzing traces using Jaeger UI
Before beginning with the installation, it is important to ensure that the following is available:
- Docker: Most components can be deployed using Docker, simplifying the setup process.
- Kubernetes (optional): For deploying in a cloud environment using orchestration.
- Understanding your application’s architecture: Knowing how your services interact is crucial for effective instrumentation.
- Programming environment setup: Ensure the appropriate development tools and libraries are installed.
The following steps discuss how to install tracing with Jaeger:
Step #1: Setup Jaeger Backend
Implementing distributed tracing requires setting up the Jaeger backend, which can be done in various ways depending on your environment and needs. Jaeger can be deployed across various environments, from personal laptops for development to large-scale, high-load production settings.
Here are the main deployment strategies you can consider:
- jaegertracing All-in-One: This simple setup deploys Jaeger as a prepackaged binary or a Docker image. It’s ideal for product testing, development, and demonstrations, packaging all necessary services and in-memory storage in a single instance.
- Production Environment: Designed for high availability and scalability, this deployment strategy separates each Jaeger service into independent deployments. It supports multiple replicas, has scaling options, and uses persistent storage solutions like Elasticsearch or Cassandra for data resilience.
- Streaming: In scenarios with heavy traffic, adding Kafka to the production setup can alleviate pressure on backend storage. This configuration also facilitates the execution of post-processing tasks on trace data before its final storage, enhancing efficiency and scalability.
The all-in-one setup is highly accessible for beginners or those looking to quickly prototype. It includes an executable bundle that simplifies the launch process. Depending on your needs, you can set up Jaeger in a local environment for development or testing or in a cloud environment for production.
All-in-One Setup
The pre-built DockerHub image is the easiest way to start the all-in-one (one command line).
docker run --rm --name jaeger
 -e COLLECTOR_ZIPKIN_HOST_PORT=:9411
 -p 6831:6831/udp
 -p 6832:6832/udp
 -p 5778:5778
 -p 16686:16686
 -p 4317:4317
 -p 4318:4318
 -p 14250:14250
 -p 14268:14268
 -p 14269:14269
 -p 9411:9411
 jaegertracing/all-in-one:1.57
You can also run the jaeger-all-in-one(.exe) executable from the binary distribution archives:
jaeger-all-in-one --collector.zipkin.host-port=:9411This command runs Jaeger in a Docker container with all necessary ports bound. You can access the UI by navigating to http://localhost:16686.
The main Jaeger backend components are released as Docker images on Docker Hub and Quay.
Production Setup
In a production environment, it’s crucial to ensure reliability and scalability:
- Cloud Deployment: Deploy Jaeger on a cloud platform. Most cloud providers support Kubernetes, which can be used to manage Jaeger instances effectively.
- Load Balancing and Auto-Scaling: Configure load balancers to distribute traffic evenly across Jaeger instances and enable auto-scaling to adjust resources based on traffic.
- Replication: Ensure data is replicated across multiple instances or zones to provide fault tolerance and high availability.
Step #2: Instrumenting Your Code
Before your applications can send tracing data to Jaeger, they must be instrumented. This means integrating tracing code that will collect data about the operations performed by your applications.
Instrumenting code with OpenTelemetry
Since the Jaeger SDKs, which used the OpenTracing API, are no longer supported as of 2022, it is recommended to use OpenTelemetry. OpenTelemetry provides APIs, libraries, agents, and instrumentation that can help capture traces and metrics from applications.
Here’s how to instrument your code using OpenTelemetry SDKs:
1. Setup and configuration steps
- Choose the appropriate OpenTelemetry SDK for your application’s programming language.
- Install the SDK and any necessary libraries or agents according to the OpenTelemetry manual.
- Integrate the OpenTelemetry SDK to instrument your code. This typically involves initializing a tracer, creating spans, and adding context propagation.
Here’s an example for Java:
SdkTracerProvider tracerProvider = SdkTracerProvider.builder()
   .addSpanProcessor(BatchSpanProcessor.builder(new JaegerGrpcSpanExporter.builder().setEndpoint("http://localhost:14250").build()).build())
   .build();
OpenTelemetrySdk openTelemetry = OpenTelemetrySdk.builder()
   .setTracerProvider(tracerProvider)
   .buildAndRegisterGlobal();
Runtime.getRuntime().addShutdownHook(new Thread(tracerProvider::shutdown));
Here’s a simple Python script that configures OpenTelemetry to send traces to a Jaeger instance running locally:
from opentelemetry import trace
from opentelemetry.exporter.jaeger.thrift import JaegerExporter
from opentelemetry.sdk.trace import TracerProvider
from opentelemetry.sdk.trace.export import BatchSpanProcessor

# Configure the tracer to use Jaeger
trace.set_tracer_provider(TracerProvider())
tracer = trace.get_tracer(__name__)

# Configure Jaeger Exporter
jaeger_exporter = JaegerExporter(
   agent_host_name='localhost',
   agent_port=6831,
)

# Configure the processor to use the Jaeger Exporter
trace.get_tracer_provider().add_span_processor(
   BatchSpanProcessor(jaeger_exporter)
)

# Example of a custom function that could be traced
def some_operation():
   with tracer.start_as_current_span("someOperation"):
       # Your operation code here
       print("Performing some operation...")

if __name__ == "__main__":
   some_operation()
After instrumenting your applications, run them in a controlled environment to ensure that the tracing is working as expected and that the trace data is visible and correct.
2. Instrumenting code
- Create Tracers: A tracer is used to create spans. Create and manage a tracer instance in your application.
Tracer tracer = openTelemetry.getTracer("instrumentation-library-name", "1.0.0");- Generate Spans: Spans represent individual operations or transactions. Wrap the operations in your application with span code to capture the performance metrics and operations details.
Span span = tracer.spanBuilder("operationName").startSpan();
try (Scope scope = span.makeCurrent()) {
   // Your operation here
} catch (Throwable t) {
   span.setStatus(StatusCode.ERROR, "Error description");
   throw t;
} finally {
   span.end(); // Always end the span
}
Here are some best practices for instrumenting code:
- Context Propagation: Ensure that the context (which includes the trace information) is propagated across different operations, especially in distributed systems or microservices. The process might involve passing context through HTTP headers or other protocols.
- Attributes and Events: Add attributes (metadata) and events (time-stamped annotations) to spans to provide additional insights into the traced operations.
- Consistent Naming: Use consistent and clear naming conventions for services, spans, and traces to facilitate navigation and understanding of the trace data.
- Tagging Spans: Tags span relevant metadata, such as HTTP status codes, user IDs, error messages, or other contextual information that helps understand the transaction’s scope and result.
Step #3: Deploying Jaeger Agent
The agent needs to reside with your application so the Jaeger client libraries can access it on localhost and send the data over UDP without the risk of data loss due to network hiccups.
The ways to achieve co-location in Kubernetes environments are either as a sidecar or as a daemonset.
Note:
Jaeger-agent is deprecated. OpenTelemetry data can be sent directly to jaeger-collector via OpenTelemetry SDKs (which include OTLP exporters).
1. Jaeger Agent as a DaemonSet
Installing the agent as a deamonset is the simplest and most economical option. This will provide one Agent instance on the node, serving all the pods on that node.
However, This strategy may prove too simple for production environments involving multi-tenancy, security segregation requirements, or multiple instances of Jaeger for different applications.
To deploy Jaeger Agent as a daemonset, you need to specify it as daemonset:
apiVersion: jaegertracing.io/v1
kind: Jaeger
metadata:
 name: my-jaeger
spec:
 agent:
   strategy: DaemonSet
2. Jaeger Agent as a Sidecar
The sidecar option means the agent will run as an additional container with each pod. This setup can support a multi-tenant environment, where each tenant has its own Jaeger
Collector and each agent can be configured to ship to its relevant Collector. You can also get more control over memory allocation, which can prevent cannibalization by specific tenants. Security configuration is simpler as well when running in the same pod. The sidecar approach naturally comes with the overhead of the additional containers. Some installation tools can auto-inject the agent sidecar and simplify management.
Step #4: Configuring Sampling Strategies
In distributed tracing, where apps comprise many microservices, sampling is important to find the right balance between a lot of data and helpful information. The primary challenges addressed by sampling include:
- Data volume: Traces can generate a large data volume, and storing and processing every trace can be costly.
- Performance impact: Continuous tracing of data can negatively impact application performance
- Insight quality: Effective sampling strategies can provide a representative view of system performance and behavior without recording every trace.
Note:
This section only applies to the old Jaeger SDKs, which are now deprecated. It is recommended that the OpenTelemetry SDKs be used.
Various sampling strategies can be employed to meet specific goals. Jaeger libraries support the following samplers:
1. Probabilistic (sampler.type=probabilistic)
Makes a random sampling decision with the probability of sampling equal to the value of sampler.param property. For example, a 1% sampling rate means that 1 out of every 100 traces will be captured. The configuration example will be:
Services:
     -service: my-service
      Sampling rate: 0.01
2. Constant (sampler.type=const)
Also known as head-based sampling, it samples a trace or not based on the decision made at an entry point of the system. If a trace is sampled, all spans within the trace are captured. This sampling strategy is useful for complete trace analysis but can be biased toward certain requests. Here’s an example of configuring a constant sampler:
services:
    -service: my-service
    type: const
    param: 1
3. Rate-limiting (sampler.type=ratelimiting)
This approach limits the number of traces sampled per second to avoid overwhelming the systems during peak loads. It uses a leaky bucket rate limiter to ensure traces are sampled with a certain constant rate. Here’s an example of how to configure this sampling:
services:
    - service: my-service
     type: rate-limiting
     param: 10
4. Remote (sampler.type=remote)
This sampling strategy is the default. It is the Jaeger client that sampling is taken from the Jaeger backend. It consults Jaeger-agent for the appropriate sampling strategy for the current service.
The remote sampling strategy resembles probabilistic sampling probability but allows dynamically getting the sample rate settings from the Jaeger agent. Jaeger adopts the 0.1% sampling policy to minimize costs, i.e., sampling 1 in 1,000 traces.
Step #5: Visualizing and Analyzing Traces
Visualizing and analyzing traces involves checking the Jaeger UI to identify a performance issue. The Jaeger UI lets you search and filter spans by:
- Service
- Operations
- Attributes
- Timeframe
- Duration
It offers a timeline view for each trace, like almost any observability product. A basic trace graph view is also possible. Other views include a span list, trace statistics, and a raw JSON mode. Additional advanced features include a trace comparison view and a system architecture view.
Here’s how you can use Jaeger’s UI effectively:
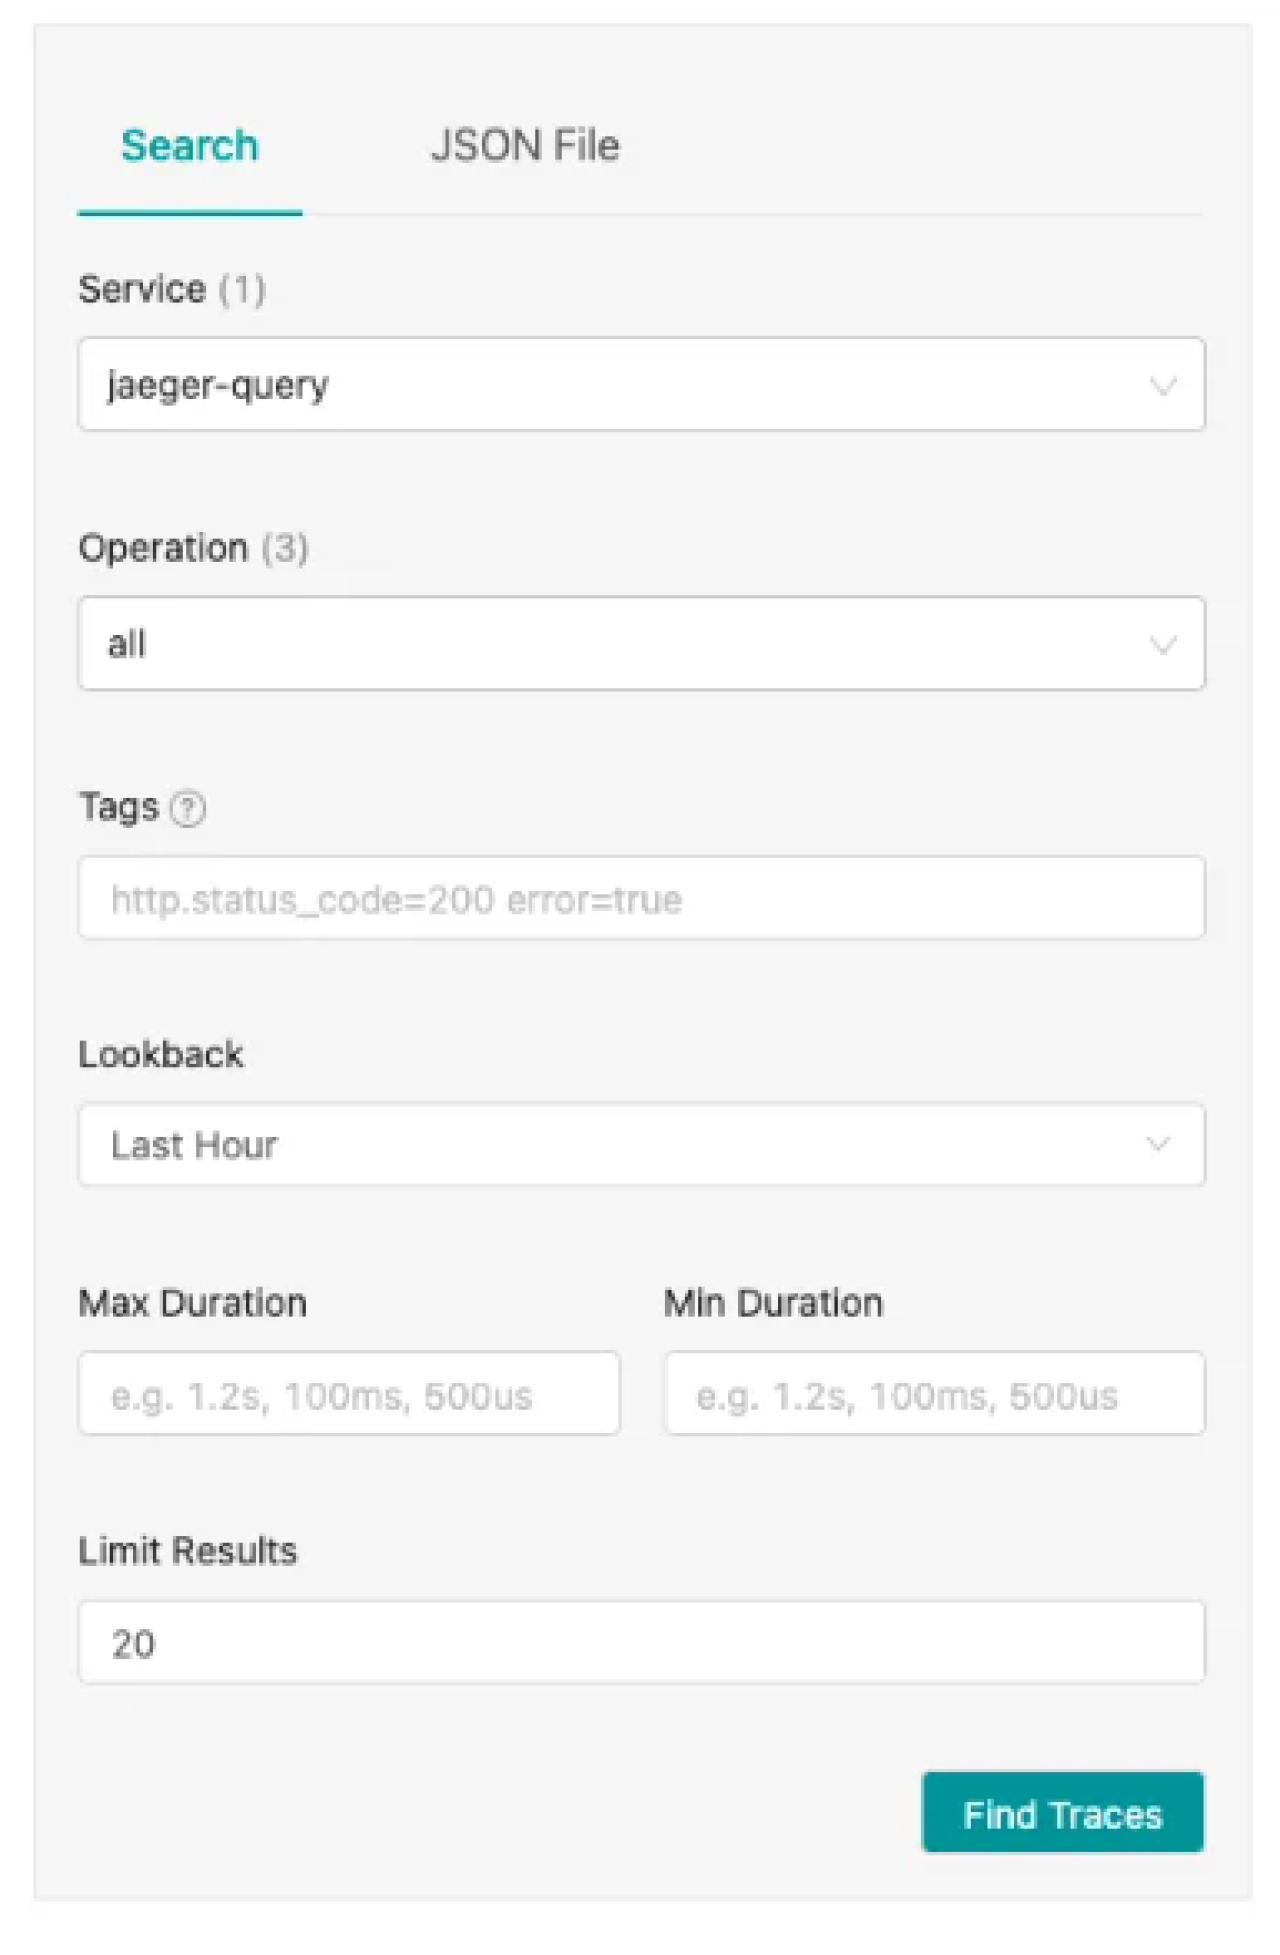
1. Searching for traces
You can use Jaeger’s UI to search for traces with specific properties. To do this, follow the steps below:
- Start by accessing the Jaeger UI.
- Use the search function. The search function lets you find traces by service name, operation name, tags, and time frame.
- You can refine your search by adjusting the lookback period, setting minimum and maximum trace durations, and filtering based on specific tags.
2. Viewing service dependencies
Jaeger creates a dependency diagram by tracing how requests flow and showing it on the dashboard. Use the dependency graph to identify identical paths in service interactions and potential bottlenecks.
3. Analyzing trace timeline
Once a trace is selected, Jaeger displays a detailed timeline view. This view lists all the spans of a trace, which represent individual operations or service calls. Click on any span to see detailed information such as start time, duration, and any tags or logs associated with that span. This helps in understanding what happens at each step of a service interaction. You can compare multiple traces to understand variations in performance or behavior under different conditions.
4. Interpreting trace data
Look for spans with high latency, which may indicate a performance issue. Longer spans may indicate slow service responses or problems with resource allocation. Pay attention to any spans that show errors.
Error logs and tags can explain what went wrong in a service call. Examining span parent-child relationships reveals the trace’s calls and dependencies.
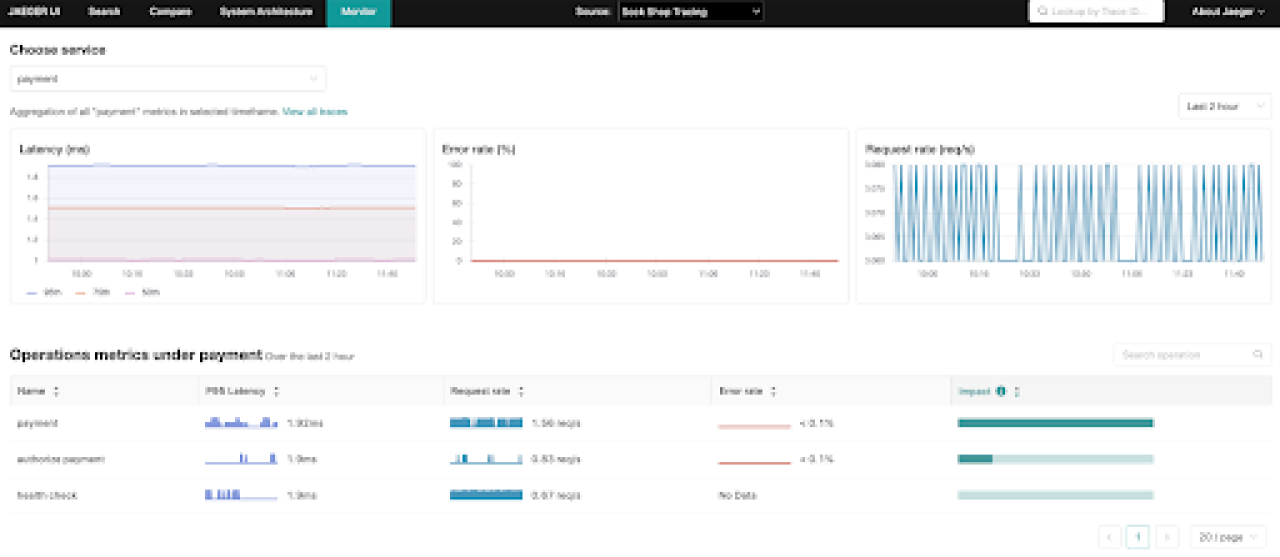
Source: Jaeger
Tips for interpreting trace data to identify performance issues and optimize service interactions:
- Focus on critical paths
- Regularly review dependencies
- Optimize based on data
Conclusion
As microservices architectures evolve and grow in complexity, the importance of distributed tracing increases. Jaeger is an essential tool, providing comprehensive visibility into request flows and deep insights into latency, errors, and dependencies. This tool is crucial for effectively monitoring and troubleshooting complex systems.
With Jaeger, organizations can better manage the complexities of distributed systems. Jaeger enhances the organization’s ability to deliver outstanding user experiences, ultimately improving business success in the fast-paced digital world.
FAQ for Implementing Tracing with Jaeger
How to use Jaeger tracing?
To use Jaeger tracing, install the Jaeger backend using Docker. Integrate Jaeger client libraries into your app, then configure tracers. The final step is to use the Jaeger UI to track operations and analyze traces with spans.
What is the difference between OpenTracing and Jaeger tracing?
OpenTracing is an instrumentation library, while Jaeger is an end-to-end distributed tracing tool. Jaeger has a web UI component, whereas OpenTracing requires you to select an analysis backend tool.
What is the difference between Zipkin and Jaeger tracing?
Zipkin has a simple trace data query language for analysis and troubleshooting. In contrast, Jaeger’s Query Language (JQL) offers advanced querying for further analysis. Zipkin uses a single-process architecture for all tasks, while Jaeger has modular, scalable collectors and query services.
What is the purpose of Jaeger?
You can use Jaeger to monitor and troubleshoot problems with microservices. It provides distributed tracing, performance optimization, root cause analysis, observability, and service dependency analysis.