

AWS Lambda is a serverless compute service that runs code in response to events without requiring teams to manage the underlying infrastructure. It powers everything from lightweight scripts to enterprise-scale applications, handling tens of trillions of executions each month across over 1.5 million active accounts.
As serverless adoption accelerates, logging remains one of the most critical — and most overlooked — aspects of application performance and health.
Poor logging can slow down debugging, delay incident response, and inflate CloudWatch costs by 20–30% or more. In fact, inadequate logging is one of the top reasons teams struggle to troubleshoot serverless workloads.
This guide breaks down the fundamentals of AWS Lambda logging: how it works, how to configure it properly, and how to optimize for cost and clarity. You’ll also find best practices for structuring logs, protecting sensitive data, and building effective monitoring and alerting workflows.
Whether you’re launching your first Lambda function or running serverless at scale, mastering logging will help you operate with greater speed, confidence, and visibility.
Key Takeaways:
• AWS Lambda automatically sends logs to CloudWatch, but you must manage retention and access controls.
• Structured logging improves filtering, debugging, and traceability across distributed services.
• Poor logging design can increase costs by 20–30% or more — especially in high-throughput systems.
• Environment-based log levels reduce noise in production and improve focus in development and staging.
• Extract custom metrics from logs and automate alerts using CloudWatch Logs Insights and metric filters.
• Secure log data with IAM policies, encryption, and sanitization to prevent exposure of sensitive or regulated information.
Lambda Logging Fundamentals
AWS Lambda simplifies observability by seamlessly integrating with Amazon CloudWatch Logs, allowing developers to capture and analyze logs without setting up additional infrastructure.
By default, Lambda captures all output written to stdout and stderr and sends it to CloudWatch Logs.
How Lambda Logging Works
Every time a Lambda function is invoked, AWS automatically creates a log stream within a specific log group in CloudWatch Logs.
The log group is named /aws/lambda/<function-name>, and each log stream corresponds to a specific container instance of the Lambda function. Logs are grouped by function name, while streams represent individual invocations over time.
The execution context plays a key role in how logs are handled. When a Lambda function is cold-started (i.e., a new container is spun up), initialization logs are captured along with the function’s first invocation.
In contrast, during a warm start, only the invocation logs are emitted, since the execution environment is reused. This behavior can affect log patterns and performance diagnostics.
Types of Lambda Logs
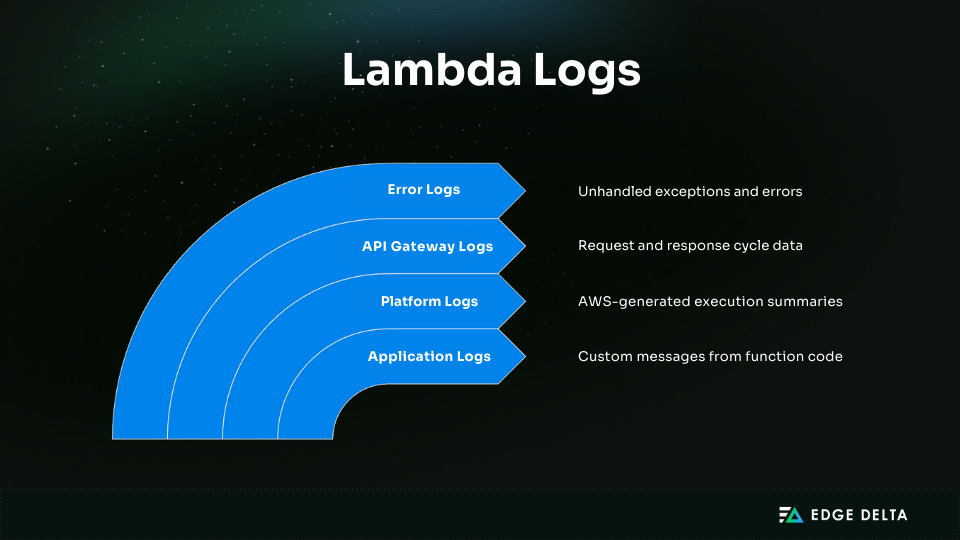
Lambda logs generally fall into four categories:
- Application Logs: These are custom log messages written by the function code using standard logging libraries like Python’s
loggingor Node.js’sconsole.log. These logs capture business logic, events, or debugging information. - Platform Logs: These include AWS-generated logs such as
START,END, andREPORTlines that summarize function execution time, memory usage, and initialization duration. These are always included unless disabled with custom runtimes. - API Gateway Logs: When Lambda is invoked via Amazon API Gateway, additional logs can be enabled to capture full request and response cycles. This includes latency data, HTTP status codes, and headers.
- Error Logs: Any unhandled exceptions or errors in your code will be logged automatically. These logs are critical for monitoring and alerting and often appear alongside stack traces or exception messages.
Log Levels and When to Use Them
Using structured logging with severity levels can help you separate meaningful signals from background noise:
- ERROR: For critical failures such as unhandled exceptions, service outages, or broken dependencies.
- WARN: For recoverable issues like deprecated API usage, performance bottlenecks, or unexpected input.
- INFO: For important business events, such as “user created” or “payment processed.”
- DEBUG: For step-by-step flow validation or input/output inspection during development.
Setting Up Lambda Logging
By default, AWS Lambda captures anything written to stdout or stderr and sends it to CloudWatch Logs.
A log group is automatically created for each function under the /aws/lambda/<function-name> namespace unless one already exists. These logs are retained indefinitely unless you configure a retention policy.
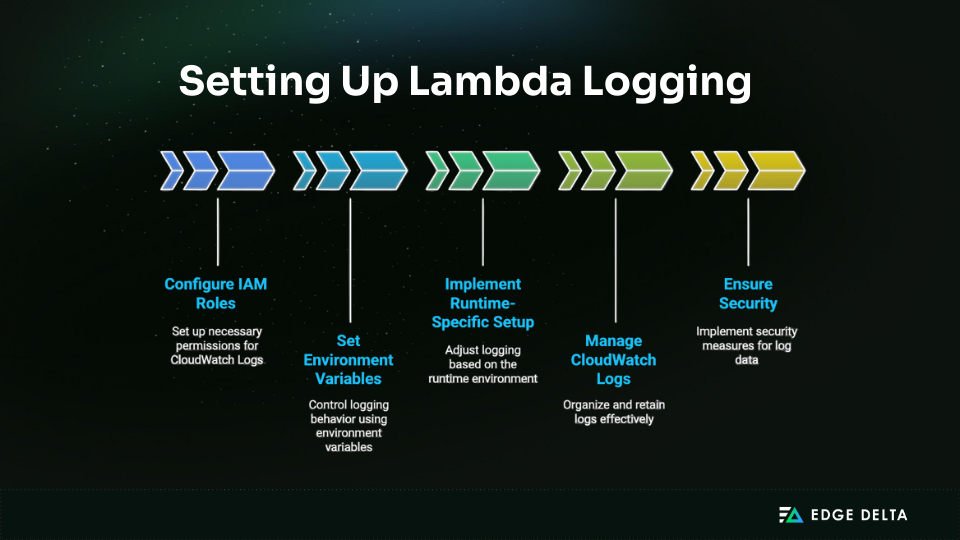
To take full advantage of Lambda’s logging capabilities, you need to configure the right IAM permissions, runtime-specific logging libraries, and CloudWatch log settings. This section covers how to set up logging effectively across different environments.
Basic Configuration
Lambda logging requires proper permissions and runtime setup. Below are key steps for configuring IAM roles, environment variables, and execution behavior.
IAM Role Requirements for CloudWatch Logs
To enable logging, your Lambda function’s execution role must include specific CloudWatch Logs permissions. At a minimum, the role should allow:
logs:CreateLogGrouplogs:CreateLogStreamlogs:PutLogEvents
These permissions are bundled in the managed policy AWSLambdaBasicExecutionRole, which is commonly attached to Lambda roles. Without these permissions, Lambda cannot generate log streams or write log data.
Environment Variables for Log Control
Use environment variables to control logging behavior without modifying code:
LOG_LEVEL: Dynamically adjusts verbosity (e.g., DEBUG, INFO, WARN)ENABLE_LOGGING: Toggles logging features on or off
This approach supports feature flagging and enables runtime tuning across development, staging, and production environments.
Runtime-Specific Setup
Different Lambda runtimes have distinct logging behaviors. For example, Node.js and Python automatically route stdout and stderr to CloudWatch, while Java and .NET may require explicit logger configuration.
Ensure each runtime’s logging libraries are initialized during the function’s cold start to capture the full execution context.
Programming Language Examples
Each Lambda runtime uses different logging libraries and syntax. Below are examples for Python, Node.js, Java, and C# to help you implement structured and readable logs.
Python
Use the built-in logging module for structured logging:
import logging
logger = logging.getLogger()
logger.setLevel(logging.INFO)
logger.info("This is an info message")
Node.js
Basic logging can be done using console.log():
console.log("Info log");
console.error("Error log");
const winston = require('winston');
const logger = winston.createLogger({
level: 'info',
format: winston.format.json(),
transports: [new winston.transports.Console()],});
logger.info("Structured log message");Java
Java developers often use Log4j2 or SLF4J:
import org.apache.logging.log4j.LogManager;
import org.apache.logging.log4j.Logger;
Logger logger = LogManager.getLogger(MyHandler.class);
logger.info("Logging from Java Lambda");
C#
Use dependency injection with ILogger<T> to log structured messages in .NET Lambdas.
public class Function{
    private readonly ILogger<Function> _logger;
    public Function(ILogger<Function> logger)
    {
        _logger = logger;
    }
    public async Task FunctionHandler(...) {
        _logger.LogInformation("Lambda log entry");
    }
}
CloudWatch Logs Management
Once logs are flowing, it’s important to optimize their storage, retention, and organization. The following practices help reduce costs and make logs easier to access and analyze:
- Create Custom Log Groups: By default, Lambda functions create log groups with the pattern
/aws/lambda/<function-name>. You can pre-create log groups with custom retention and encryption settings to override defaults. - Set Retention Policies: CloudWatch log groups retain data indefinitely by default. Set explicit retention periods (e.g., 1 day, 7 days, 90 days, up to 10 years) using the console or
put-retention-policyAPI. - Configure Log Stream Naming: Lambda log streams are auto-generated using the function version, container ID, and timestamp. You can’t rename these, but you can tag Lambda functions with metadata to organize and filter logs using CloudWatch Logs Insights.
- Use Cross-Region Logging: To centralize logs across regions, use Kinesis Data Firehose or AWS Lambda destinations to stream logs to a unified S3 bucket or OpenSearch domain in a single region.
Lambda Logging Best Practices
Logging in AWS Lambda is essential for debugging, monitoring, and maintaining the health and security of serverless applications. But poor logging can add performance overhead, increase costs, and risk exposing sensitive data.
Below are best practices across six key areas to help teams implement logging that is effective, secure, and scalable in Lambda environments.
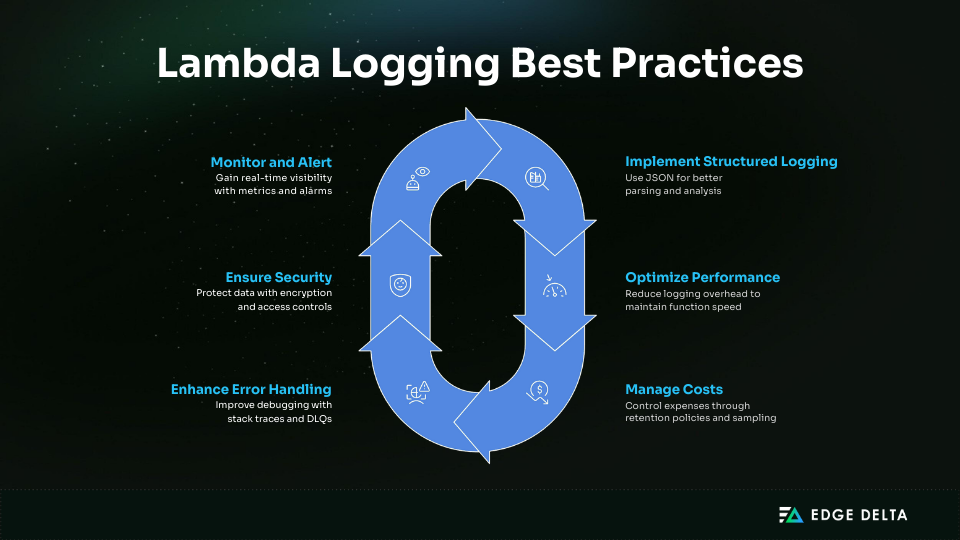
Structured Logging
Structured logging uses a consistent, machine-readable format to record log events. Unlike plain-text logs, structured logs are easier to filter, search, and analyze with tools like CloudWatch Logs Insights or OpenSearch.
A typical log entry should include fields like:
timestamp: ISO 8601 or Unix formatlevel: Log severity (e.g., INFO, ERROR)message: A clear description of the eventrequestId:The Lambda invocation ID (for traceability)
Including correlation IDs is especially useful in distributed systems. Passing them through headers or payloads lets you trace a single request across services like API Gateway, Lambda, and DynamoDB.
Keep the schema consistent across all functions. This simplifies querying and makes it easier to set up alerting and dashboards.
Performance Optimization
Logging can impact Lambda performance, especially when writing large volumes of data or using synchronous APIs. To prevent this:
- Keep logging overhead under 5 ms per function invocation. AWS benchmarking and user reports indicate that excessive synchronous logging (e.g.,
console.log()in tight loops) can increase cold start time and memory usage. - Use asynchronous logging with non-blocking APIs or external log processors (e.g., AWS Firehose or S3 with Lambda extensions). This decouples logging from business logic execution.
- Minimize log volume for high-frequency or low-latency functions. Avoid logging every request in real time unless needed for compliance or security auditing.
- Buffer logs and batch them where possible, especially when forwarding to downstream log storage or analytics tools.
Cost Management Strategies
Pricing in CloudWatch Logs is based on ingestion volume, storage duration, and API usage. Poor logging practices can lead to unexpected cost spikes.
As of July 2025, CloudWatch Logs charges $0.50 per GB of log data ingested and $0.03 per GB per month for archived storage in most regions.
For example, logging 100 MB per Lambda function per day across 10 functions will cost:
- Ingestion: 100 MB × 10 functions × 30 days = 30 GB → $15/month
- Storage (30-day retention): 30 GB × $0.03 = $0.90/month
That’s $15.90/month just for basic logging, not including additional analysis or exports. In high-throughput environments, these costs can easily climb into hundreds per month.
In high-throughput environments, it’s often worth forwarding only filtered, relevant logs to reduce ingestion. One approach involves using a custom CloudWatch forwarder to control what actually gets stored.
Key Strategies:
-
Set appropriate retention periods by environment. For example:
- Production: 30–90 days
- Staging: 7–14 days
- Development: 1–3 days
-
Use log sampling to reduce log volume in high-throughput applications. For example, only log 1% of successful transactions while capturing all failures.
-
Implement conditional logging based on severity. Use environment variables or configuration flags to suppress debug logs in production.
-
Monitor CloudWatch costs using AWS Budgets and billing alerts. Integrate with AWS Cost Explorer to track logging expenses across services and regions.
-
Use a telemetry pipeline solution like Edge Delta to filter and optimize logs in-flight — reducing ingestion volume and sending only the most valuable data to CloudWatch or your preferred destination.
Error Handling and Debugging
Effective error logging accelerates root cause analysis and improves incident response time.
Best Practices:
- Include stack traces in exception logs to capture failure context. Many languages (Python, Node.js, and Java) support built-in stack trace logging.
- Log function input/output sparingly. Avoid logging large or sensitive payloads, but capture enough data to recreate the error scenario.
- Capture execution context, including environment variables, memory usage, and execution duration.
- Use Dead Letter Queues (DLQs) to log failed asynchronous invocations. DLQs help isolate and debug failures that Lambda couldn’t process.
Security and Compliance
Logging adds visibility but also introduces security and compliance considerations. The following practices help protect sensitive data and maintain access control:
- Use least privilege IAM roles. Avoid wildcard permissions like
logs:*. Grant only the necessary actions (e.g.,logs:PutLogEvents) on the specific resources the function needs. - Sanitize log content. Never log sensitive data such as credentials, access tokens, personal identifiers (PII), or credit card numbers. Use middleware or logging wrappers to strip or mask fields before writing to logs.
- Encrypt logs at rest. Enable server-side encryption in CloudWatch Logs using AWS-managed or customer-managed KMS keys. Make sure the Lambda execution role has
kms:Decryptaccess to the relevant CMK. - Secure VPC access. Functions running in a VPC need outbound connectivity (via NAT gateway or VPC endpoint) to send logs to CloudWatch. Without this, logging will silently fail.
- Control cross-account log access. To centralize logs or support shared services, use resource policies on log groups and cross-account IAM roles. Restrict access to only what’s required.
These steps help ensure that log data doesn’t create a new attack surface or compliance risk as your serverless workloads scale.
Monitoring and Alerting
Real-time visibility into your Lambda functions helps detect failures, latency issues, and usage spikes before they affect users.
Use these approaches to turn logs into signals:
- Create custom metrics using CloudWatch Logs metric filters. Alternatively, you can extract telemetry earlier in the pipeline by sending log data through an OpenTelemetry collector, giving you more flexibility in how and where metrics are generated.
- Set up CloudWatch Alarms on those metrics. Alert when error rates exceed thresholds, timeouts increase, or invocations drop unexpectedly. Alarms can notify via Amazon SNS, AWS Chatbot, Slack, or email.
- Automate alerts with EventBridge rules or Lambda triggers based on specific log patterns or metrics.
Advanced Logging Techniques
As serverless applications scale in complexity, developers must move beyond basic logging and adopt advanced techniques for deeper observability, performance tuning, and cost-effective operations.
The following practices enhance visibility, enable faster debugging, and support enterprise-level monitoring across environments.
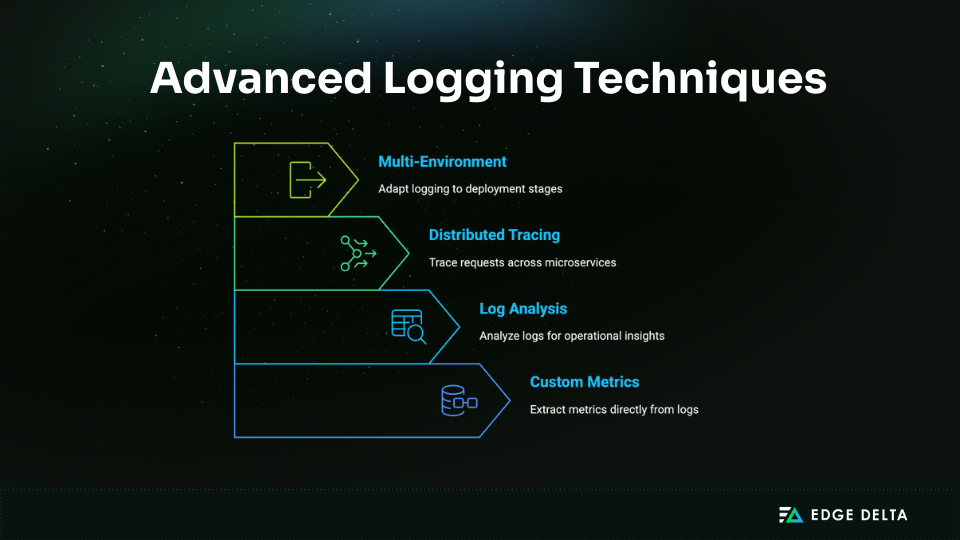
Multi-Environment Logging
Adapt logging behavior by environment. Use environment variables (e.g. LOG_LEVEL, ENABLE_LOGGING) to control verbosity between dev, staging, and production without changing code. This helps limit noise and manage costs in production while keeping visibility high during development.
Distributed Tracing
Add trace context to logs using tools like AWS X-Ray or OpenTelemetry. Include trace IDs (traceId, segmentId) in structured logs to follow a request across Lambda, API Gateway, and other services. Sampling in production can reduce overhead while preserving enough data for debugging.
Log Analysis
Use CloudWatch Logs Insights or a third-party tool to query logs for patterns and trends. Filter by log level, user ID, or request path to identify bottlenecks, anomalies, or regressions. Pair this with metrics to get both high-level signals and deep dive capability.
Custom Metrics
Extract metrics from logs using CloudWatch metric filters. For example, count the number of errors, track sign-ups, or measure function latency; all without changing application code. These metrics can trigger alerts or feed dashboards.
These techniques give teams the flexibility and visibility needed to operate serverless workloads at scale. By combining environment-aware logging, traceable logs, custom metrics, and log analysis, you build a stronger foundation for observability and incident response.
Troubleshooting Common Issues
Efficient Lambda logging requires more than just enabling logs. It involves monitoring for issues related to missing data, degraded performance, unexpected costs, and security misconfigurations. Below are common challenges and how to resolve them.
Missing or Incomplete Logs
One of the most frequent issues in Lambda logging is the absence or incompleteness of expected logs.
A primary cause is insufficient IAM permissions. The Lambda execution role must include logs:CreateLogGroup, logs:CreateLogStream, and logs:PutLogEvents to write logs to CloudWatch. If these are missing or incorrectly scoped, logs won’t appear.
Another culprit is hitting CloudWatch service limits. CloudWatch Logs has quotas on the number of log groups, log streams and PutLogEvents requests per second. Exceeding these can cause log delivery failures.
Some of the key CloudWatch Logs limits to watch for:
- PutLogEvents request limit: 5 requests per second per log stream (with bursts up to 10)
- Log event size: 256 KB max per event (including metadata)
- Log stream quota: 50,000 streams per log group
- Log group quota: 500,000 log groups per Region
Exceeding these limits can result in throttling errors (ThrottlingException) or dropped logs, especially in high-throughput environments. Use retries with exponential backoff or spread log traffic across multiple log streams when needed.
Function timeouts also affect logging. If a function times out before writing to stdout or completing a PutLogEvents API call, logs may be partially missing. Ensure timeout settings are appropriate for your workload.
Additionally, network connectivity issues can affect VPC-connected Lambda functions. If your function relies on NAT gateways or endpoints to reach CloudWatch Logs, network misconfiguration can prevent logs from being sent.
Performance Problems
High logging overhead is another common concern. Excessive log volume, frequent console.log() or logger.debug() calls, or large log payloads, can significantly slow down execution, especially in memory-constrained environments.
To mitigate this, consider optimizing memory allocation. Lambda performance scales with memory, so increasing the allocation can speed up execution and reduce logging delays.
Long logging operations can also extend the function duration. Use asynchronous or batched logging when possible, and avoid logging inside performance-critical loops.
Also, beware of CloudWatch API throttling. Each AWS account has per-region limits on PutLogEvents requests. Throttling can delay or drop logs under high load.
Cost Optimization Issues
CloudWatch Logs pricing is based on ingestion volume, retention time, and API usage. Unexpected billing spikes can occur due to verbose debug logs, especially in high-throughput systems.
A frequent cause is retention misconfiguration. By default, log groups are retained indefinitely. Set appropriate retention policies (e.g., 7, 14, or 30 days) to control long-term costs.
Watch for over-logging, where unnecessary DEBUG or INFO messages bloat the log volume. Use log sampling or dynamic log levels in production environments.
In multi-region architectures, logs generated in multiple regions can lead to complex and fragmented billing. Use AWS Cost Explorer to track usage and consolidate logs when feasible.
Security and Access Issues
Logging sensitive data — like credentials, tokens, or personally identifiable information (PII) — is a critical security risk. Implement input sanitization and avoid logging raw payloads from external sources.
Cross-account access issues can occur when log groups are accessed via resource policies or shared services. Ensure proper trust relationships and IAM permissions are configured.
Misconfigured encryption settings, such as missing KMS key permissions, can block log delivery or access. CloudWatch Logs supports customer-managed keys (CMKs) for encryption.
Finally, regularly audit logs for compliance violations. Services like AWS CloudTrail and AWS Config can help monitor and flag non-compliant behavior related to log access or content.
Tools and Integration
Effective Lambda logging is not just about capturing output. It’s about making logs actionable.
With the right tools, you can search, analyze, visualize, and automate log-driven processes across your stack. Below, you’ll find key AWS-native services, third-party integrations, and local development utilities that help streamline and enhance your Lambda logging workflows.
AWS Tools
Optimizing Lambda logging requires more than capturing output. It demands tools for querying, managing, and testing logs efficiently. AWS provides native solutions that streamline these tasks across development and production environments.
CloudWatch Logs Insight Queries
CloudWatch Logs Insights provides a powerful query engine for analyzing log data in real time. Developers can use it to troubleshoot issues, identify patterns, and extract metrics without exporting logs. For example:
fields @timestamp, @message
| filter @message like /ERROR/
| sort @timestamp desc
| limit 20
AWS CLI Logging Commands
The AWS Command Line Interface (CLI) allows users to manage CloudWatch Logs from the terminal. You can create log groups, set retention policies, or fetch log events.
aws logs get-log-events --log-group-name /aws/lambda/my-function \
  --log-stream-name my-log-stream
CloudFormation Logging Template
CloudFormation enables infrastructure-as-code for provisioning log groups and setting policies. You can define log group creation, retention, and KMS encryption in your templates to ensure a consistent logging infrastructure.
SAM CLI Local Testing
The AWS Serverless Application Model (SAM) CLI allows you to simulate Lambda execution locally. It mirrors AWS’s logging behavior, so you can see what would appear in CloudWatch before deploying.
Third-Party Solutions
Legacy observability platforms like Datadog, New Relic, and Splunk support log forwarding via Firehose, APIs, or Lambda extensions, but they come with high storage and ingestion costs.
To reduce observability spend and gain more control, many teams now use telemetry pipelines like Edge Delta. Edge Delta lets you process and optimize Lambda log data in-flight — filtering, transforming, or extracting metrics before forwarding logs to any destination, including Amazon S3 or other third-party tools. This approach ensures you get the insights you need without overpaying.
Development and Testing Tools
During development and in CI/CD pipelines, logging tools help verify behavior, enforce standards, and automate validation before and after deployment.
- Local Debugging with SAM: SAM CLI allows developers to mimic the Lambda runtime environment locally, capturing logs as they would appear in CloudWatch. This accelerates debugging without deploying to AWS.
- Log Analysis Utilities: Tools like jq, grep, or third-party log parsers can help extract insights from exported JSON logs for offline analysis or reporting.
- Automated Testing Frameworks: Testing tools such as Pytest (Python), JUnit (Java), and Jest (Node.js) can assert log outputs during unit or integration testing to validate error handling and logging behavior.
- CI/CD Pipeline Integration: Logging setup can be automated in CI/CD pipelines using IaC tools (CloudFormation, Terraform), and logs can be analyzed post-deployment as part of validation steps in platforms like GitHub Actions or AWS CodePipeline.
Real-World Implementation Examples
Effective logging in real-world systems goes beyond capturing output. It’s about meeting compliance standards, controlling costs, and quickly pinpointing issues when things go wrong.
Companies across sectors like e-commerce, finance, and IoT are adapting AWS logging services to match specific operational needs without overcomplicating their stacks.
E-commerce
A large e-commerce platform running on AWS uses Lambda and API Gateway to handle transactions. Structured JSON logs capture key fields like order ID, user ID, SKU, and payment status, then stream to CloudWatch and Amazon OpenSearch for analysis.
Customer journey tracking is achieved by tagging each request with a unique session ID. Logs from login, browsing, and checkout are linked by this ID, helping the team identify friction points.
Performance is tracked using CloudWatch Metrics and Log Insights to flag slow endpoints and optimize Lambda execution time. A large e-commerce platform running on AWS uses Lambda and API Gateway to handle transactions. Structured JSON logs capture key fields like order ID, user ID, SKU, and payment status, then stream to CloudWatch and Amazon OpenSearch for analysis.
Customer journey tracking is achieved by tagging each request with a unique session ID. Logs from login, browsing, and checkout are linked by this ID, helping the team identify friction points.
Performance is tracked using CloudWatch Metrics and Log Insights to flag slow endpoints and optimize Lambda execution time. To reduce noise and avoid storing unnecessary data, the team uses Edge Delta’s Telemetry Pipelines to filter logs in-flight and route only meaningful events to CloudWatch and OpenSearch — cutting costs by 30% without sacrificing observability.
Finance
A financial services firm uses AWS Lambda and RDS to manage sensitive operations. To meet PCI DSS and SOC 2 requirements, all user and admin activity is logged with metadata like timestamp, IP, and role. Edge Delta is used to enforce sanitization policies and redact sensitive fields before logs are stored — ensuring compliance while preserving operational visibility.
Logs are written to CloudWatch and mirrored to encrypted S3 buckets with versioning. They’re stored for over seven years to satisfy audit retention rules.
Security events are monitored with GuardDuty and CloudWatch Alarms. When suspicious behavior is detected, Lambda functions auto-trigger incident responses such as access revocation or admin alerts.
IoT Data Processing
An energy monitoring company processes real-time sensor data from thousands of IoT devices using AWS IoT Core, Lambda, and Kinesis Data Streams. Scalability is achieved by auto-scaling Lambda functions based on queue depth and implementing shard-level monitoring for Kinesis streams. To streamline observability at scale, they use Edge Delta to extract custom metrics directly from logs as they’re generated, route enriched telemetry to downstream systems, and detect anomalies before logs hit storage — saving on costs and accelerating response time.
Conclusion
Effective logging is essential for the health and performance of AWS Lambda applications. As serverless workloads grow, so do the challenges of observability, cost management, and incident response.
A robust logging strategy depends on implementing structured logging, enforcing retention policies, securing log data, and integrating monitoring tools. Combining AWS-native features with third-party observability platforms and telemetry pipelines delivers real-time insights, faster debugging, and improved operational efficiency.
Logging should never be an afterthought — it’s a fundamental pillar of system reliability. By adopting the best practices outlined in this guide, teams can reduce complexity, enhance visibility, and ensure their serverless applications run securely and cost-effectively at scale.
Frequently Asked Questions
How do I log errors in Lambda?
Wrap your function logic in try-catch blocks and log exceptions using stderr or a structured logger (e.g., console.error, logger.error). Include stack traces for better debugging and tag logs with severity levels like ERROR for easier filtering in CloudWatch Logs Insights.
What causes missing or delayed logs?
Common causes include missing IAM permissions (logs:PutLogEvents), CloudWatch API throttling, or function timeouts that prevent logs from flushing. In VPC-based Lambdas, ensure NAT gateways or VPC endpoints allow outbound access to CloudWatch Logs. Check service quotas and retry policies for high-volume workloads.
How do I enable AWS X-Ray tracing with Lambda logs?
Enable active tracing in the Lambda console or via IaC tools. X-Ray will automatically generate traceId, segmentId, and other metadata. To correlate logs, include these fields in your structured log output. This improves end-to-end visibility across distributed systems.
Can I disable automatic log group creation?
Yes. Remove the logs:CreateLogGroup permission from your Lambda’s execution role. You can pre-provision log groups with the correct naming, retention, and encryption settings using CloudFormation or the AWS CLI. This gives you more control over the logging infrastructure.
What are CloudWatch Logs’ key limitations?
CloudWatch Logs queries are scoped to a single log group, making cross-service analysis harder. High ingestion volumes can lead to throttling and increased cost. Latency can occur with large queries. Use telemetry pipelines, log sampling, structured logs, and aggregation tools to mitigate these issues.
Does Edge Delta integrate with AWS Lambda?
Yes. Edge Delta integrates seamlessly with AWS Lambda by ingesting and processing Lambda logs in real time through its Telemetry Pipelines. It allows you to filter, enrich, and route log data from Lambda functions before forwarding it to your preferred storage or observability tools — including Amazon S3, CloudWatch, or third-party platforms like Datadog and Splunk. This integration helps reduce storage costs, improve log quality, and enhance observability across your serverless applications.
References
- AWS Lambda
- AWS CloudWatch Log
- AWS Lambda Runtime
- AWS API Gateway
- Lumigo
- Python
- AWS Lambda Permission
- Nodejs
- Apache
- Microsoft
- AWS CloudWatch Pricing
- AWS User Guide
- AWS Security Best Practices
- AWS Lambda Extension
- AWS Lambda Functions
- AWS CloudWatch
- AWS Lambda Function
- AWS Security Pillar
- AWS CloudWatch Log
- Creating Metric Filters
- CloudWatch
- Amazon Data Firehose
- OpenTelemetry
- AWS X-Ray
- AWS Lambda Troubleshooting Guide
- CloudWatch Logs Quotas
- CloudWatch API Throttling
- Aws
- Amazon CloudWatch Logs
- AWS CLI
- AWS CloudFormation Templates
- AWS SAM Developer Guide
- Datadog
- New Relic
- AWS
- AWS Industry Lens
- AWS IoT Core
- Monitoring AWS Lambda
- AWS X-Ray
- AWS Developer Guide
- AWS Logs
- AWS CloudWatch Pricing
- AWS

