Amazon Relational Database Service (RDS) is a managed AWS service that simplifies the setup, operation, and scaling of relational databases in the cloud. With RDS, users can quickly deploy instances of popular database engines like PostgreSQL and MariaDB without worrying about managing the underlying infrastructure — including backups, patching, and monitoring — while also gaining high availability, fault tolerance, and security features out of the box.
By default, RDS sends key database metrics like CPU utilization, replication status, and read/write IOPS into AWS CloudWatch for monitoring and analysis. However, CloudWatch users are unable to correlate RDS metrics with telemetry data generated by external applications, making it difficult to trace issues holistically across components within their environment. Additionally, CloudWatch is incredibly expensive at scale — forcing many users to choose between cutting metric ingestion and paying exorbitant observability costs.
With Edge Delta’s Telemetry Pipelines, teams can collect any data from any source, standardize and correlate it with external telemetry data pre-index, and route it to more cost-effective downstream destinations. In this blog post, we’ll walk through how to use an Edge Delta pipeline to extract RDS metrics from AWS CloudWatch, structure them, and ship them into Edge Delta’s Observability Platform to build holistic monitors and dashboards for smarter and more efficient troubleshooting.
Migrating RDS Metrics Off CloudWatch
Monitoring database health with RDS metrics in CloudWatch is both costly and inefficient, especially for organizations running hybrid infrastructure at enterprise scale. Implementing a pipeline layer that supports routing data to alternative downstream destinations allows teams to migrate off of CloudWatch without negatively impacting their alerting infrastructure and troubleshooting workflows. With Edge Delta’s Telemetry Pipelines, teams can re-format their metric data however they choose, which is critical for standardizing CloudWatch-formatted metrics onto open standards like OTel.
To perform the migration, teams first need to create AWS Metric Streams to export CloudWatch Metrics into an S3 bucket. From there, they’ll need to create an SQS queue that our pipeline will pull from to collect the metrics in real time. The required flow is shown in the architectural diagram below:
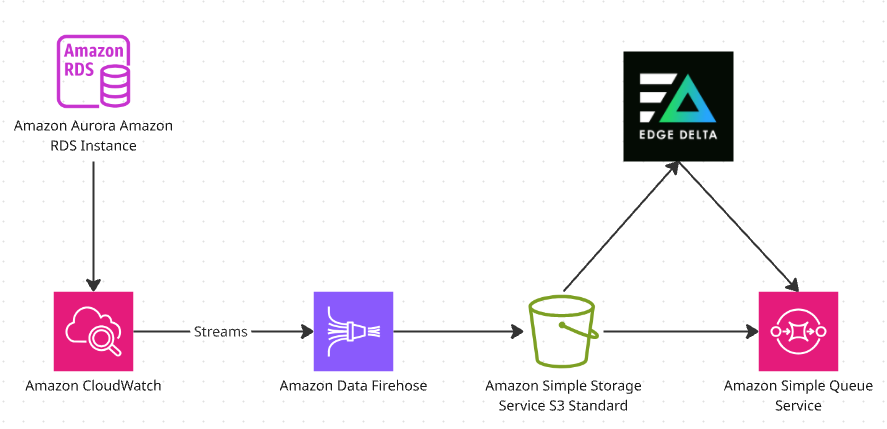
Once a new object is added to S3, it notifies SQS that new content is ready to be ingested. Edge Delta then inspects the queue, sees it has a new notification, and pulls the relevant data into the pipeline directly from S3.
In the following section, we’ll walk through how to configure each AWS and Edge Delta component to begin sending RDS metrics through an Edge Delta pipeline.
AWS Setup
First, we’ll need to create an SQS queue to read from the S3 bucket that the RDS metrics will be sent to. Edge Delta’s documentation has detailed instructions on how to configure a new SQS queue with the correct policies and permissions. After walking through the listed steps, we now have a new Queue which looks like this:
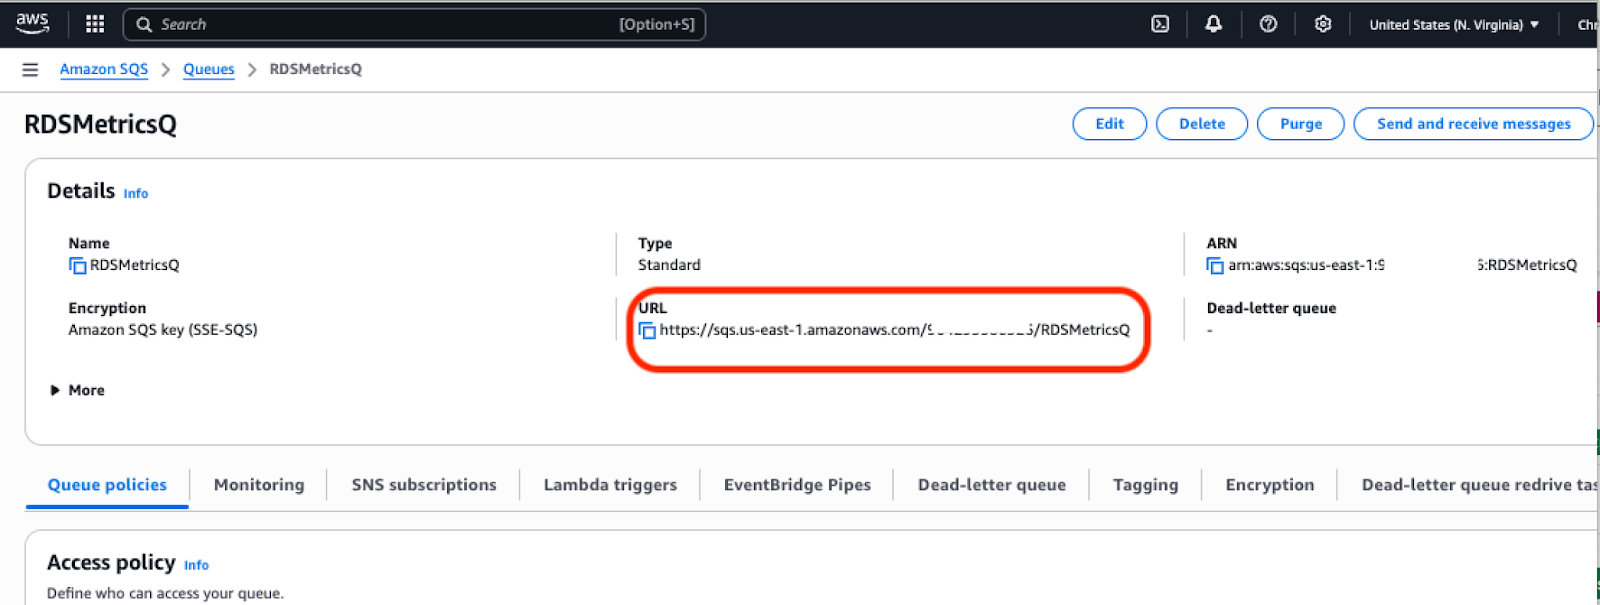
Our S3 bucket will use this queue to notify Edge Delta that new data is ready for ingestion. We’ll need to save the SQS queue URL, as we’ll be using it later to configure our S3 input within Edge Delta.
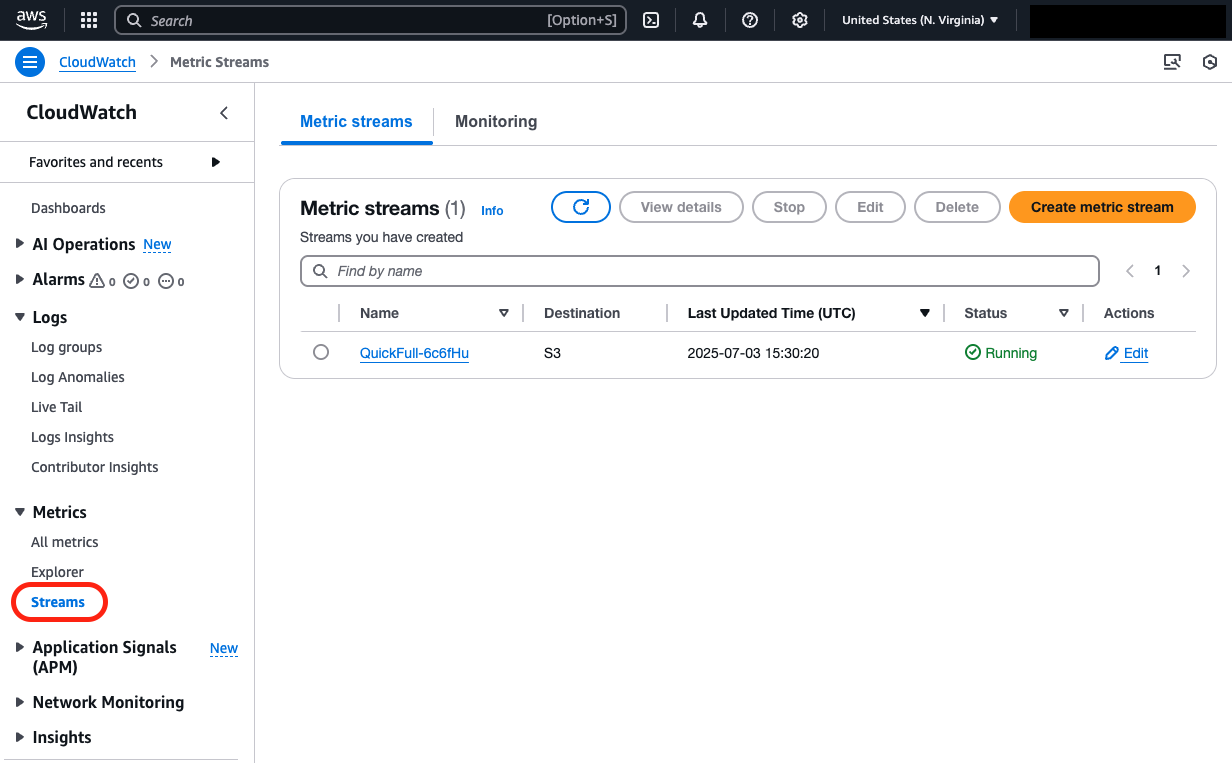
Next, we’ll need to configure a metric stream to extract RDS metrics from CloudWatch. We first need to navigate to CloudWatch within our AWS account, and select the “Stream” tab under the “Metrics” category:
From there, we can select the “Create metric stream” button, and in the following screen, we can specify which metrics we’d like to include in the stream. In this case, we have selected the “AWS/RDS: All metric names” to stream all generated RDS metrics for simplicity:
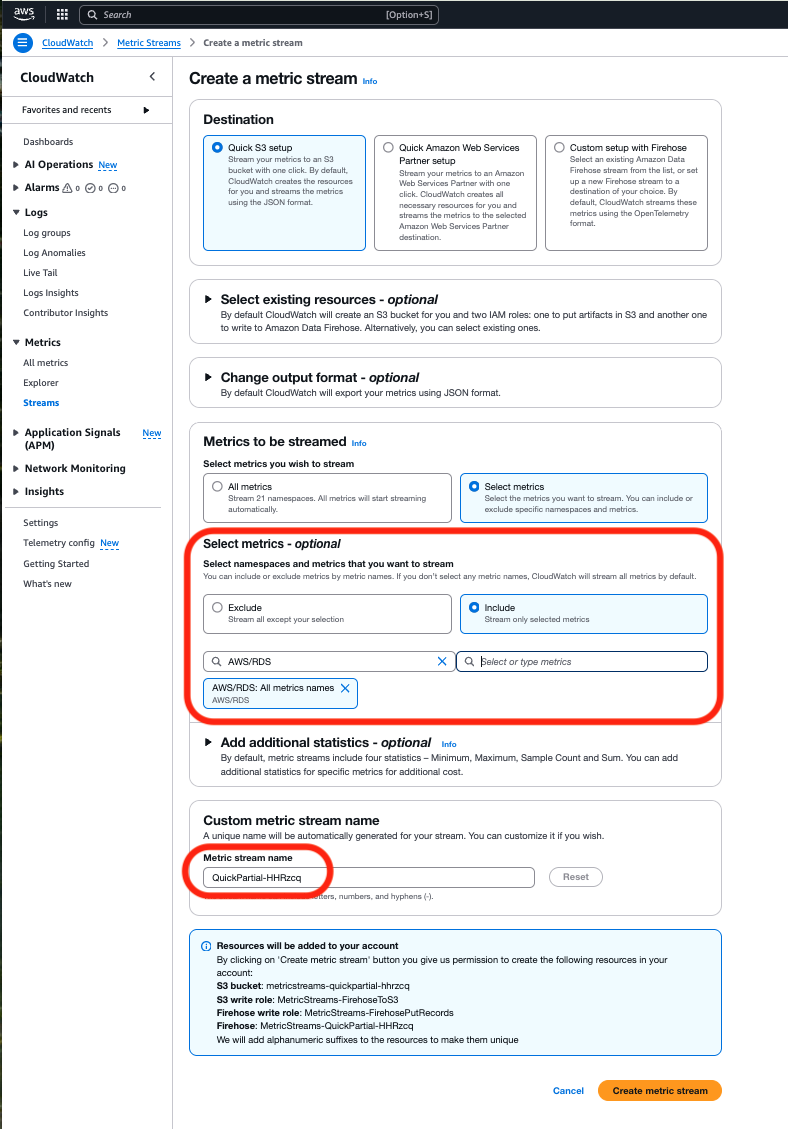
Once the stream is created, we’ll take note of the {Metric stream name}, as we’ll need it when setting up S3 notifications for SQS.
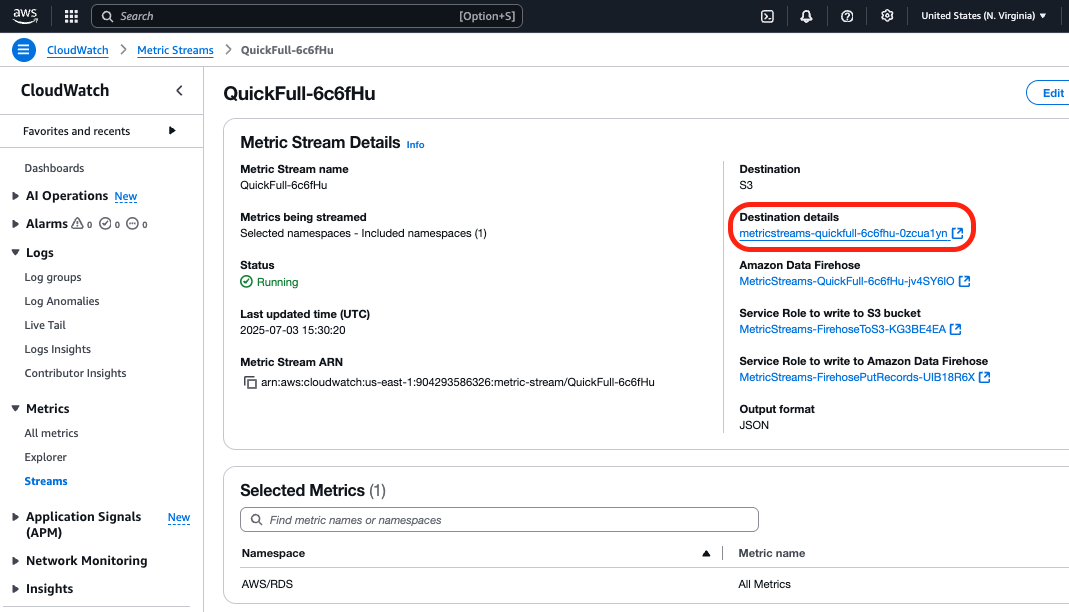
After the stream has been created, click the link under “Destination details” to visit the associated S3 bucket:
From here, we’ll click on the “Create event notification” button in the “Event notifications” section under the bucket’s “Properties” tab:
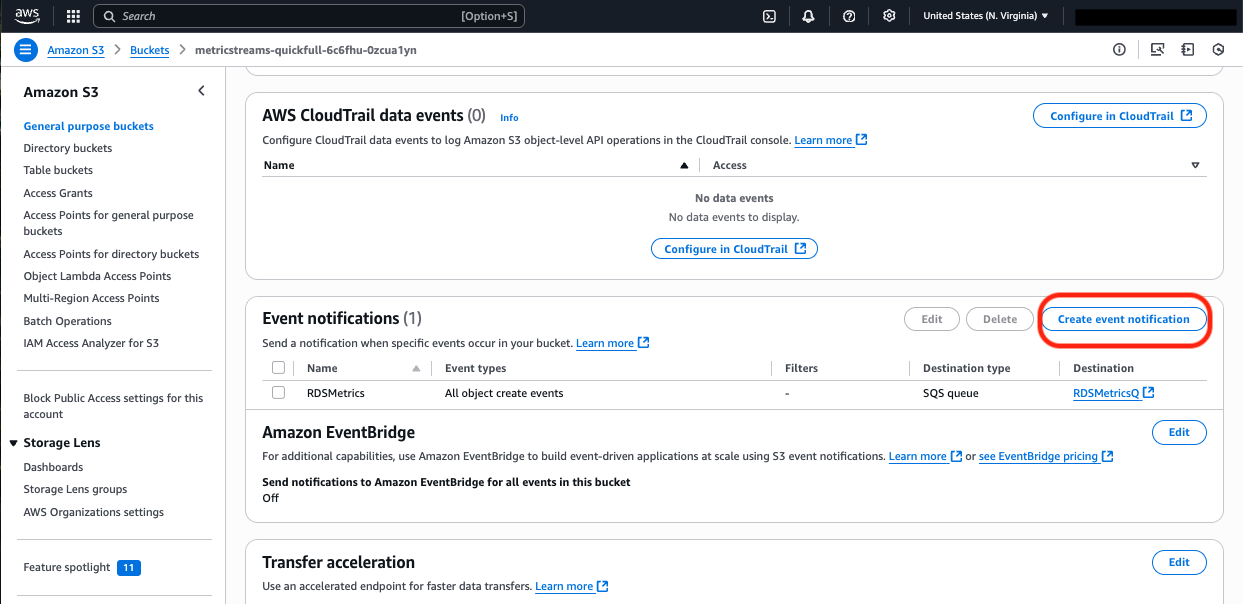
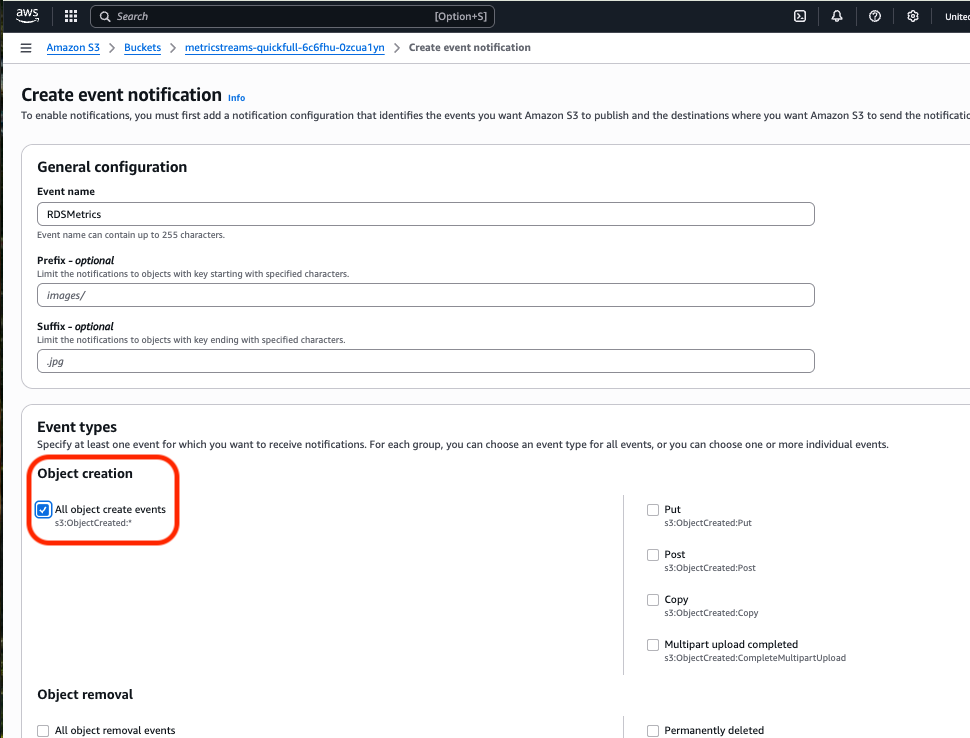
We’ll configure the event notification to support the “All object create events” event type, which will configure the SQS queue to generate notifications whenever any new object is shipped into the bucket:
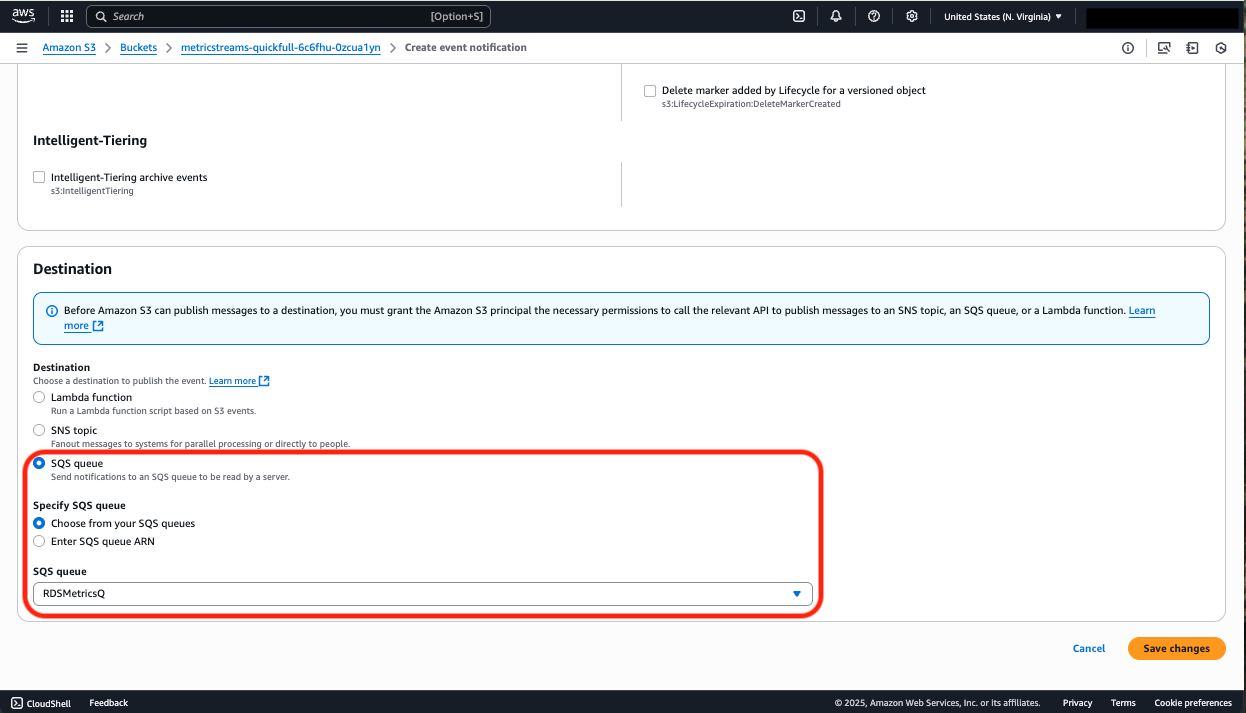
We’ll also configure the destination to be the SQS queue that was created at the beginning of this setup:
After we hit “Save changes,” we now have a functioning metric stream that will ship data into S3, and an SQS queue that will notify Edge Delta when new data is ready to be ingested from the bucket.
Edge Delta Setup
Now that the AWS side is properly set up, we’ll need to configure Edge Delta’s agents to ingest the RDS metrics that are streaming into S3. To do this, we’ll spin up a cloud pipeline, and add to it an S3 source node.
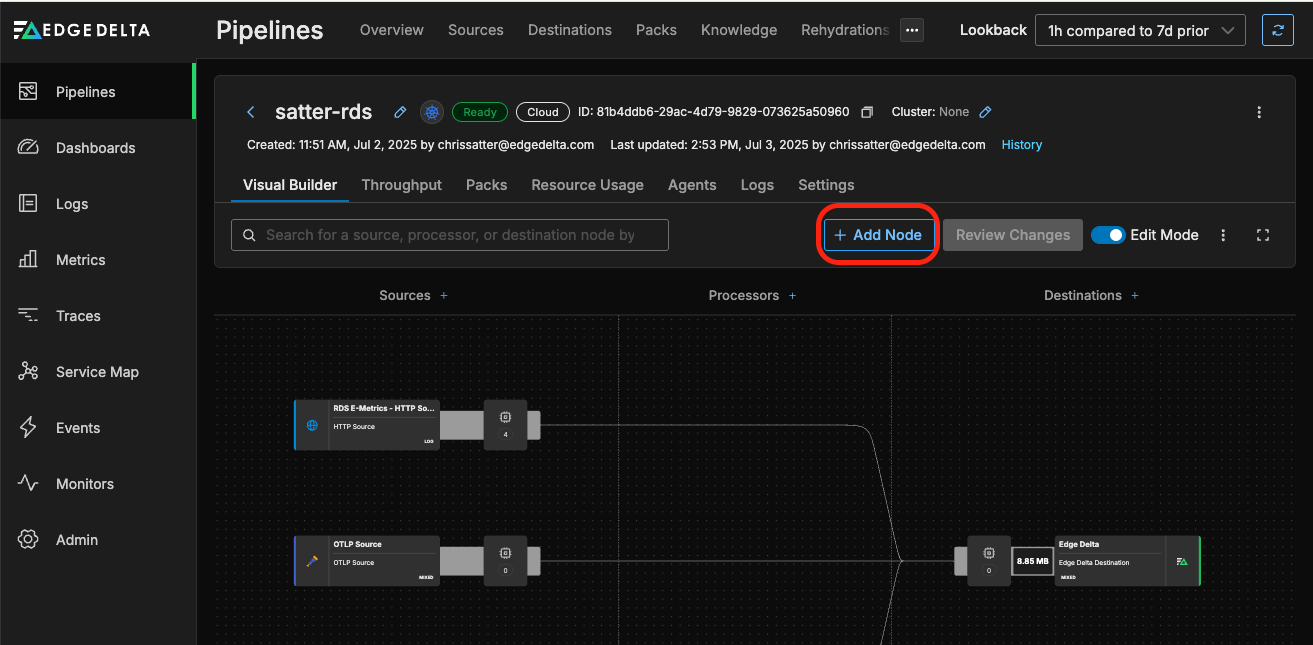
To provision a cloud pipeline, we’ll follow the instructions laid out in the docs. Once the pipeline has been created, we’ll add the new S3 source node by selecting “Add Node”:
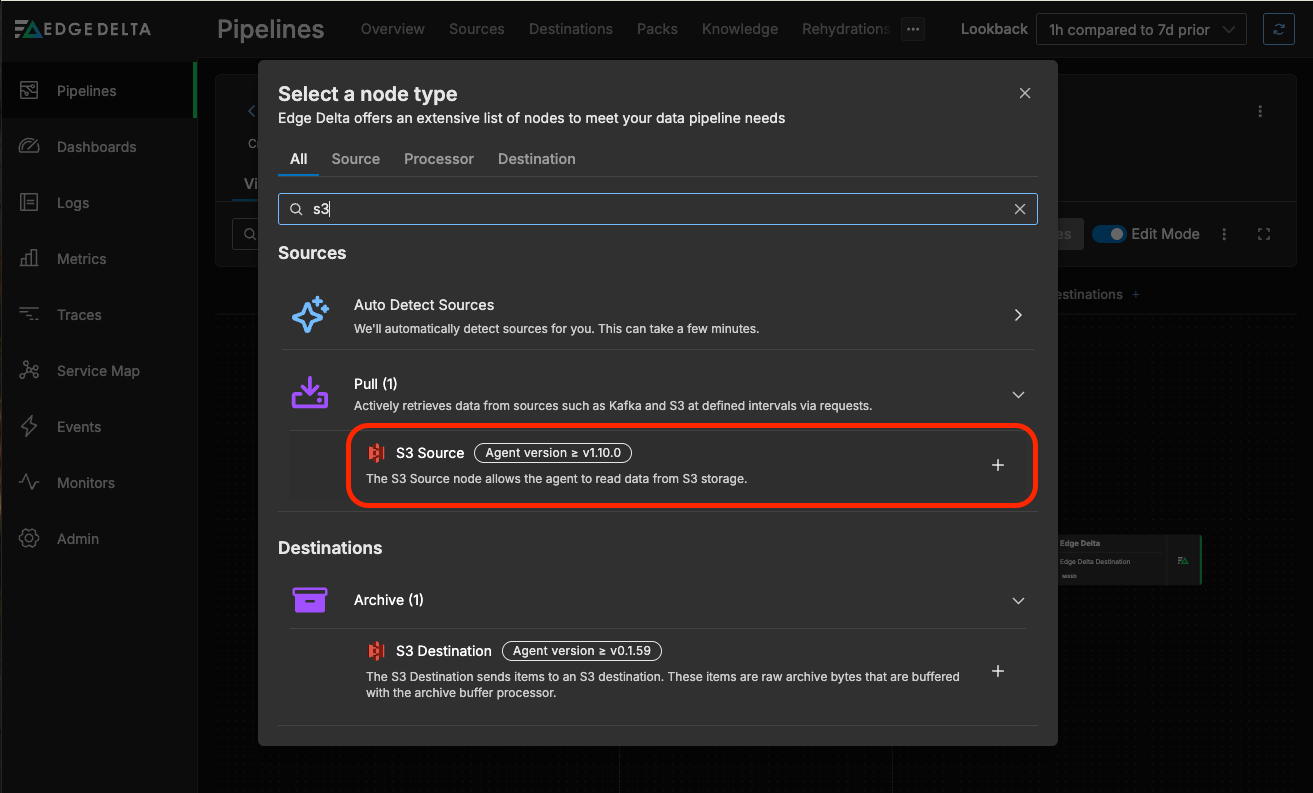
Then, we’ll select the S3 source node:
And finally, we’ll fill in the required fields with information gathered from the AWS setup above:
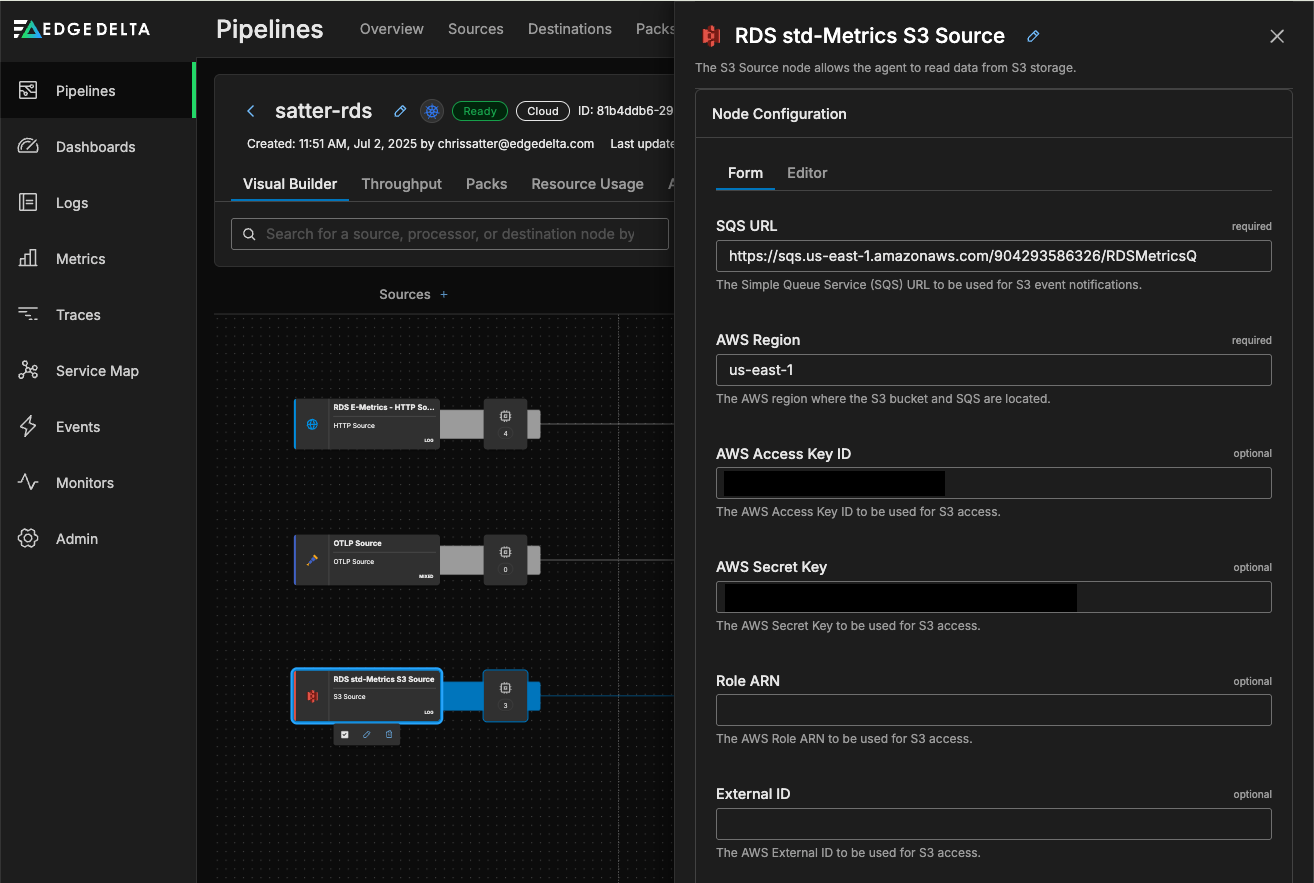
After saving and deploying the change, our Cloud Pipeline will start polling the SQS queue for new objects added to the S3 bucket and begin the ingestion process. After a minute or so, data will begin streaming into the pipeline via the S3 input in JSON format.
Replacing CloudWatch with Edge Delta’s Observability Platform
Edge Delta’s Observability Platform supports monitoring and analysis for all telemetry data, and is a modern, cost-effective alternative to CloudWatch. Let’s ship the extracted RDS metrics into Edge Delta and quickly create powerful dashboards to visualize database health and performance.
Before routing the data downstream, however, we’ll need to parse and structure the metric items to prepare them for visualization as shown in the multi-processor node screenshot below:
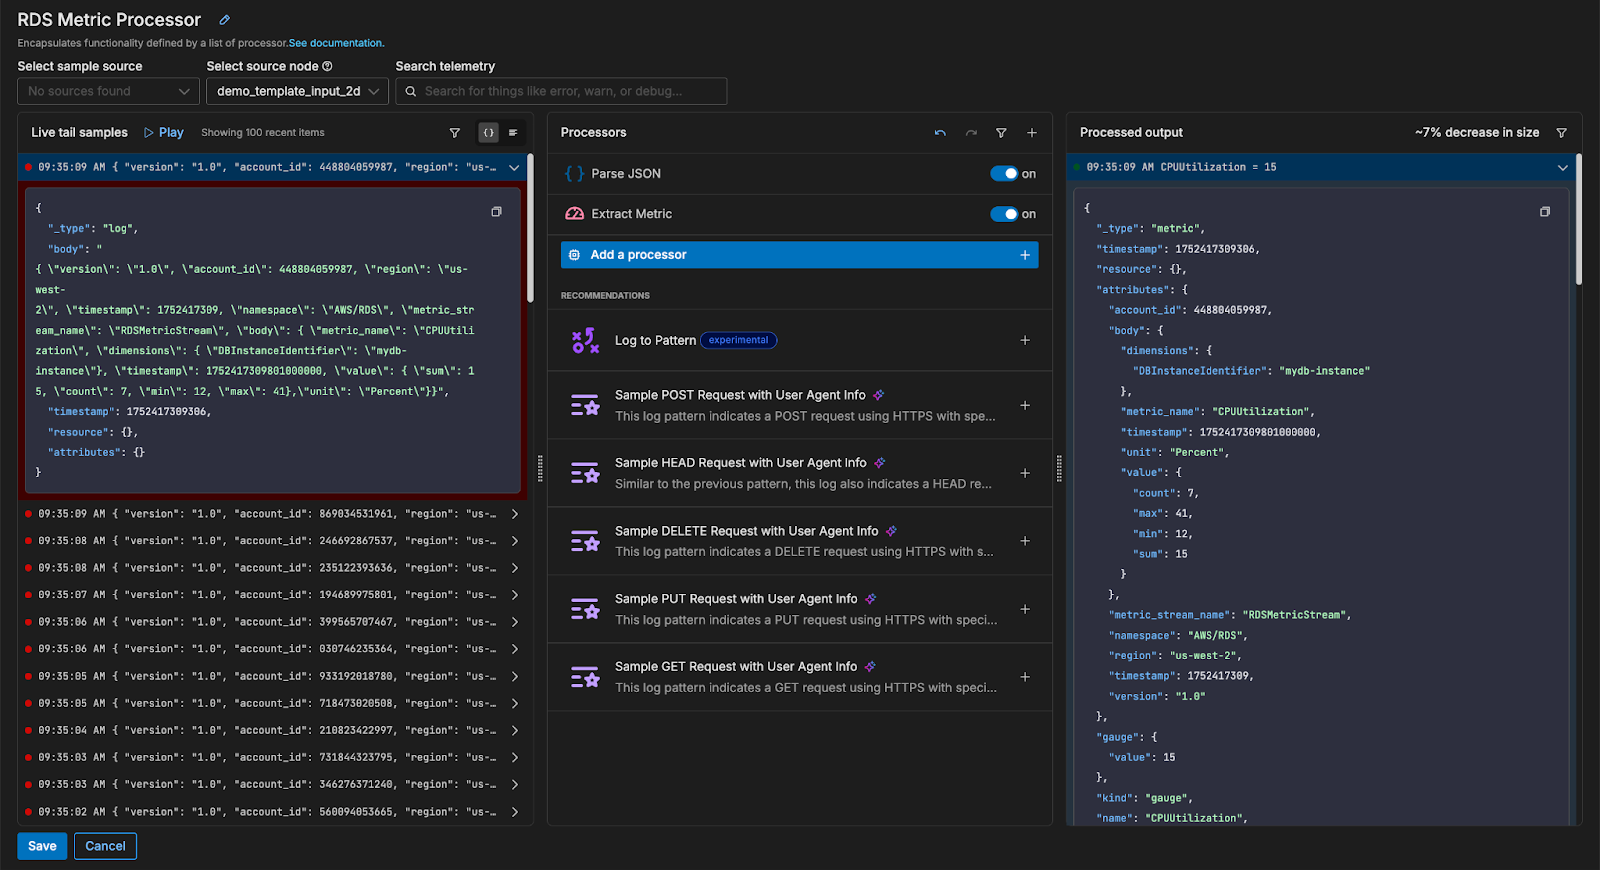
Live Capture image depicting the parsing and structuring of RDS metrics through the Edge Delta pipeline. For access to the multi-processor node configuration YAML, visit our public repo.
Once the metric is processed and routed into Edge Delta, we can configure a dashboard to visualize it within our platform:
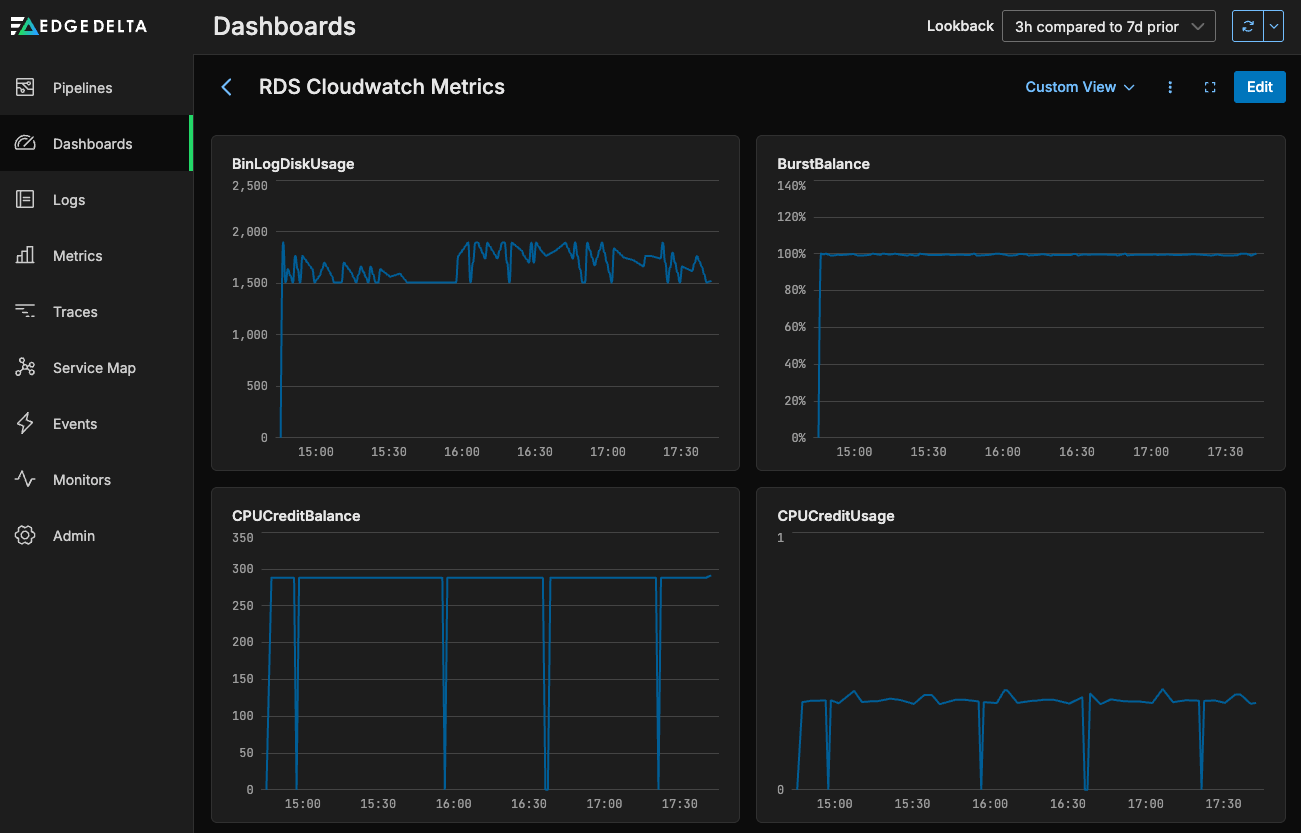
With this dashboard configuration in place, we can quickly identify unusual resource usage or allocation behavior — and build monitoring and alerting infrastructure to notify us when our RDS database is acting abnormally. Additionally, we can convert logs into intelligent patterns from within the pipeline to assist during troubleshooting and remediation.
Conclusion
Whether you’re building a small web application or a large-scale enterprise system, RDS provides the database flexibility and scalability to support a wide range of use cases with minimal management overhead. However, for organizations that require long-term metric retention, cross-service correlation, or more advanced alerting and visualization capabilities, AWS CloudWatch often falls short from a cost and performance perspective.
With Edge Delta’s Telemetry Pipelines and Observability Platform, teams can export RDS metrics, correlate them with telemetry data from across their environment, and build complex monitors and visualizations to maintain and troubleshoot database performance at scale.
If you want to get hands-on experience with Edge Delta, check out our free Playground or start a free trial.