

Real-time visibility is an essential part of modern observability and security workflows. Telemetry data typically streams in from several different sources and passes through a variety of processing steps before reaching multiple destinations, and teams must have deep insight into the full journey in order to detect and remediate incidents.
Visibility into pipeline health and performance is equally critical. Without easy access to key metrics like agent-level CPU usage, memory allocation, and latency, it’s incredibly difficult to troubleshoot pipeline-level issues such as agent failures or configuration errors.
Edge Delta’s Telemetry Pipelines, together with our Observability Platform, pair full control and flexibility with deep visibility into telemetry data flows and pipeline health, enabling proactive monitoring, pipeline self-awareness, and an enriched troubleshooting experience.
In this blog post, we’ll use Edge Delta’s free, interactive Playground environment to demonstrate how these two layers of visibility help teams quickly identify and resolve issues — including unexpected changes in throughput and pipeline processing errors — all within an intuitive UI.
Troubleshooting Data Flow Deviations
Edge Delta’s Observability Platform gives teams a clear, system-wide view of telemetry data flowing through their environment. With it, they can monitor their data flows holistically through a collection of detailed visualizations and key metrics, helping them isolate specific issues in real time.
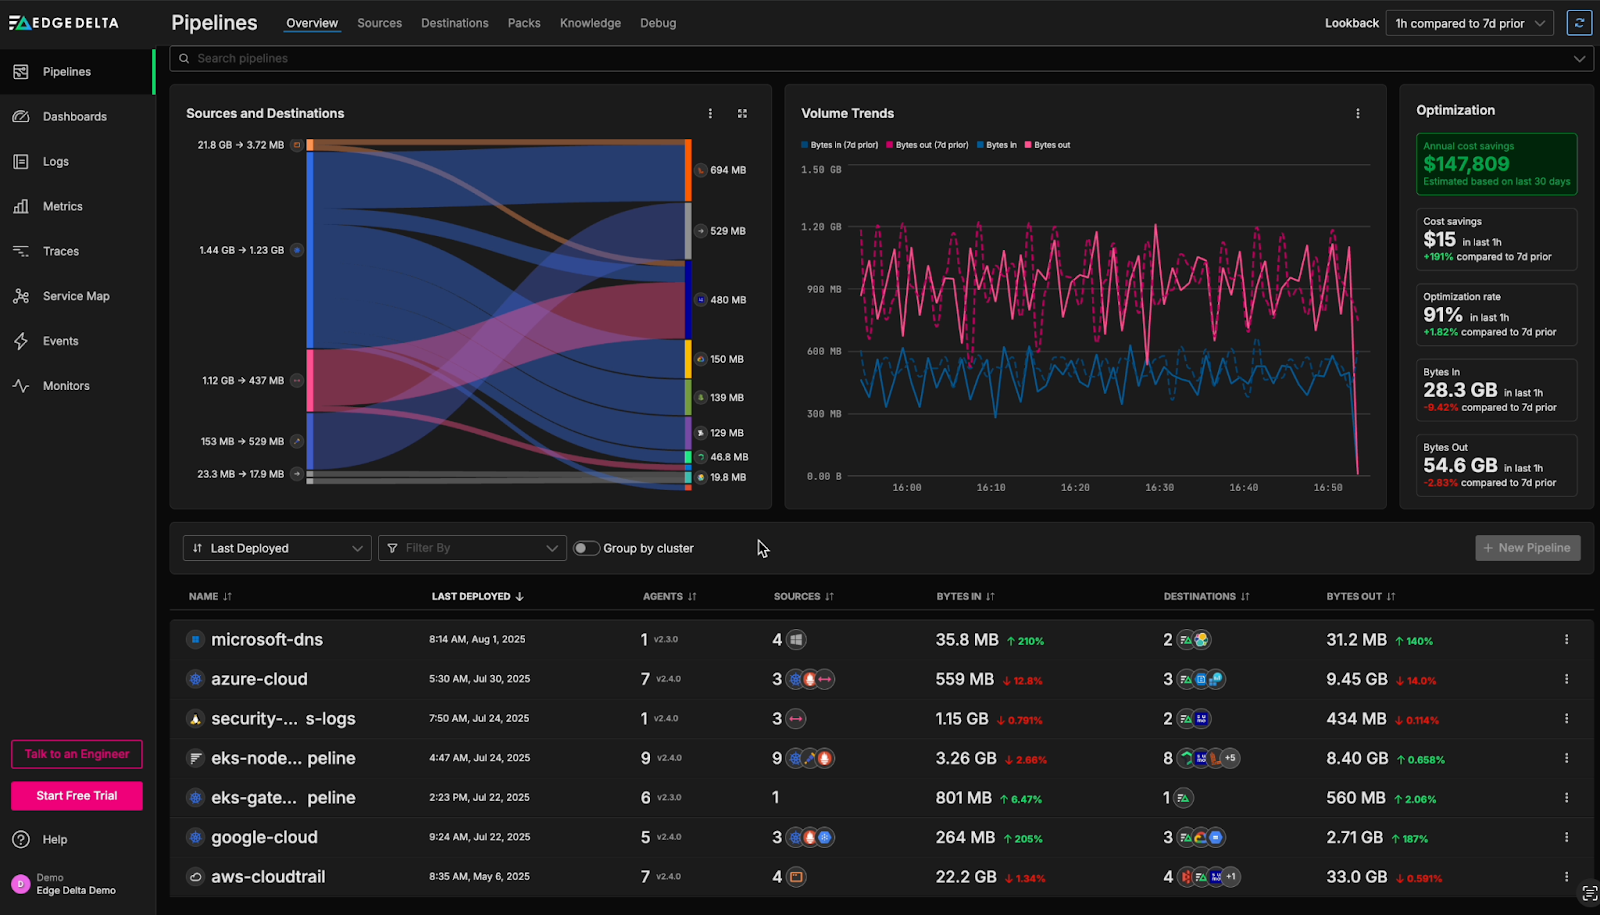
The Edge Delta Playground’s Pipelines Overview Page
Currently, the optimization metrics in the top right reveal a recent ~10% reduction in data ingestion across the environment in the last hour, with the most notable decreases coming from the eks-node-pipeline pipeline. This indicates a potential issue, as we are actively optimizing data volumes post ingestion, but aren’t anticipating any reduction in overall ingestion volume.
To investigate further, we can pivot to the intuitive pipeline builder interface, which enables teams to interact with their pipeline configurations graphically and provides processor-level visibility into data flow:
Within the graphical pipeline builder, we see a ~22% decrease in log volume from the
kubernetes_logs source node. This reduction is a major contributor to the overall drop in telemetry data volume. From here, we can begin investigating the underlying Kubernetes infrastructure to determine the root cause.
Destination-Based Issue Detection
We can also identify telemetry data flow irregularities by exploring detailed metrics for individual destinations, and tracing them back to the corresponding pipeline. The “Destinations” page highlights which systems are receiving the highest volumes of telemetry data, and compares them to historical baselines or trends.
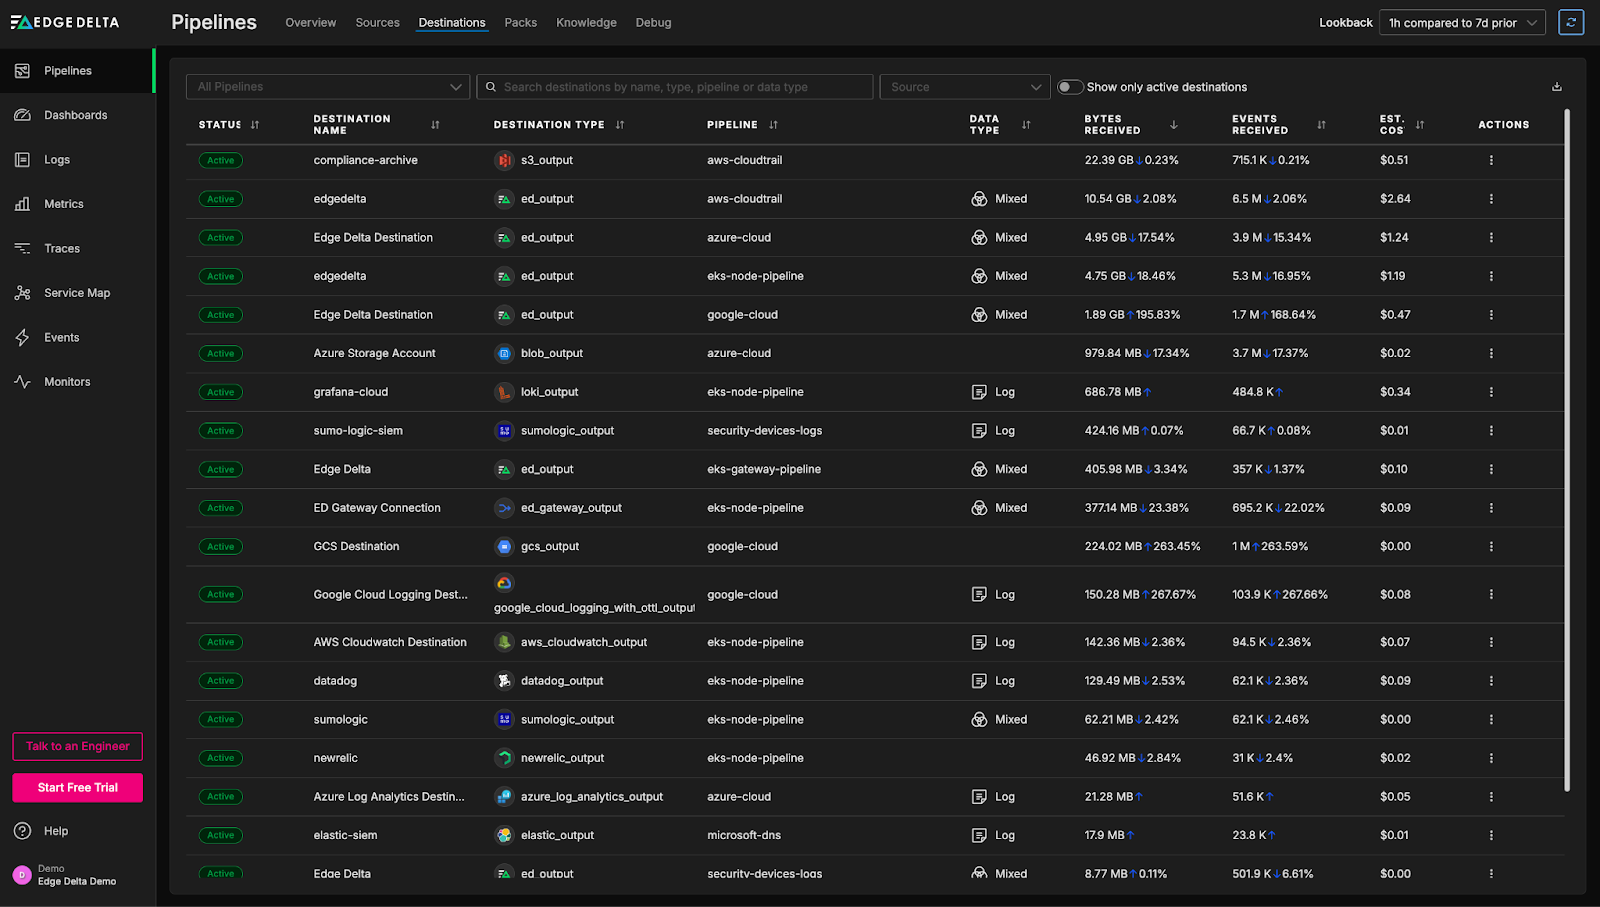
As we can see in the image above, the google cloud pipeline pipeline in the Playground environment is currently sending 169% more data into Edge Delta’s Observability Platform than its typical baseline. This type of spike may indicate a misconfiguration, an unexpected surge in application activity, or a change in log verbosity. With this insight, we can investigate further by turning our attention to the relevant Kubernetes infrastructure generating the data that’s flowing into our Google Cloud instance.
Thanks to the high-level metrics surfaced directly within the Pipelines tabs, it only takes a few seconds to identify these issues. From there, teams can quickly drill into the associated pipeline or source, and begin remediation efforts — including reviewing recent deployment changes, inspecting logs, or adjusting processing rules.
Remediating Pipeline Errors
Edge Delta Telemetry Pipelines include a comprehensive set of health and performance metrics that allow teams to quickly identify and resolve issues as they arise. This built-in visibility makes it easy to monitor pipeline behavior and address pipeline errors in real time.
To demonstrate, let’s jump into the “Throughput” tab of the azure-cloud pipeline in the Playground environment:
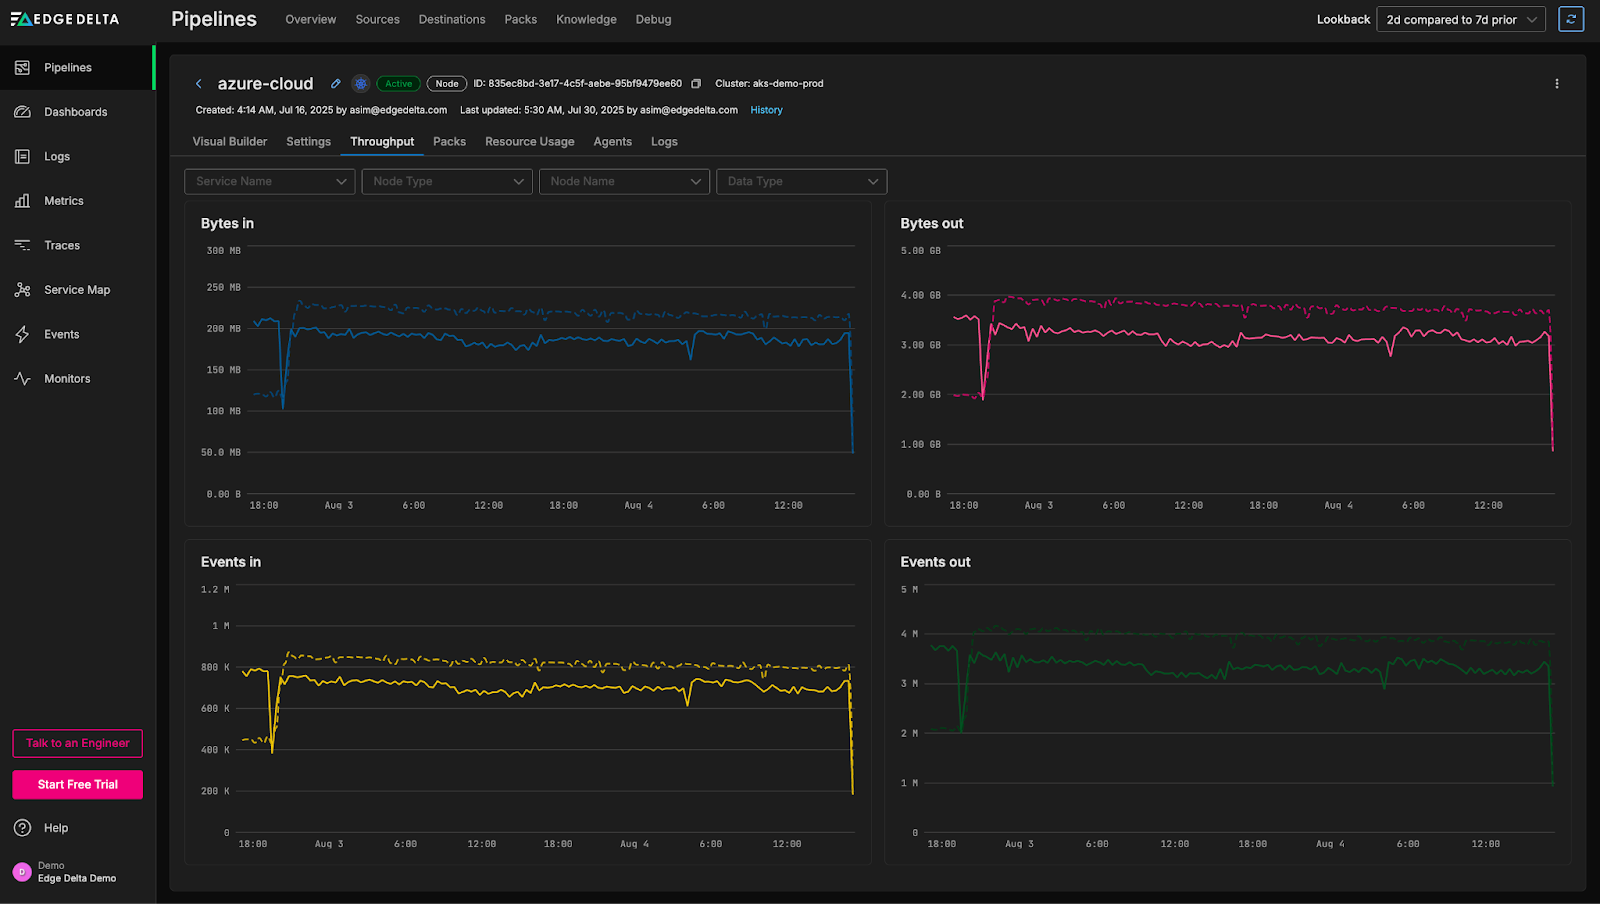
From this view, we can see a noticeable drop in throughput over the past few hours. While drops in throughput can sometimes originate from problems in the sources themselves, they can also be attributed to pipeline-level issues. To investigate further, we can review overall agent-level CPU and memory utilization to determine whether resource constraints may be contributing to the decline:

Interestingly, the CPU and memory usage aren’t elevated; if anything, they’re slightly lower than normal. Let’s evaluate agent health next:
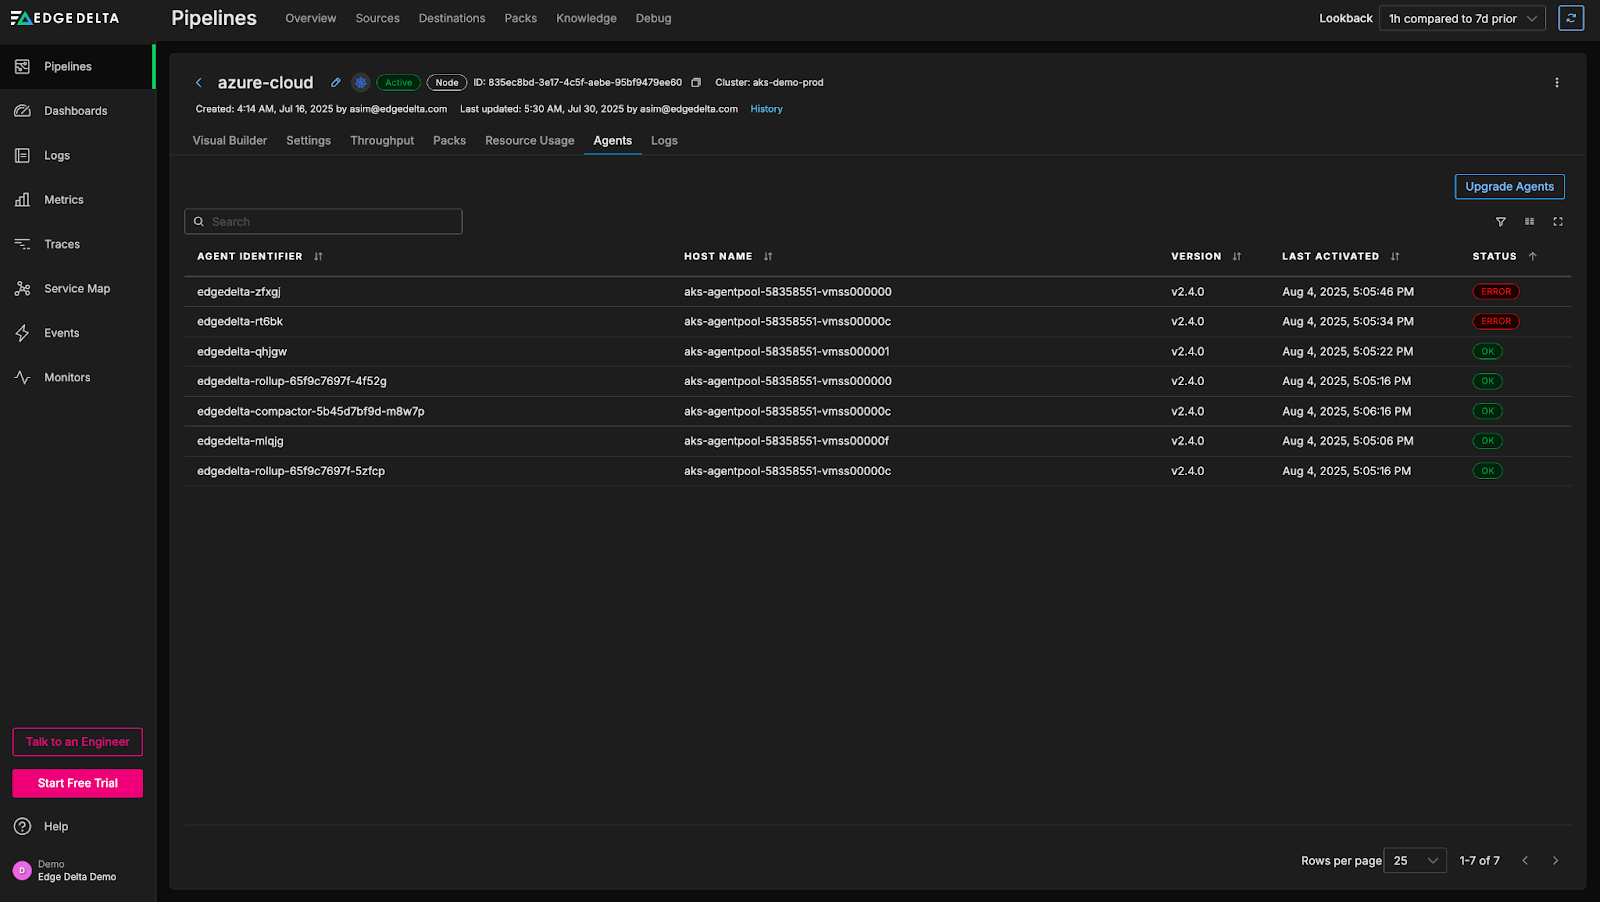
We can see here that there are some errors with a few of our agents. We can quickly drill into the associated logs to see what’s going on:
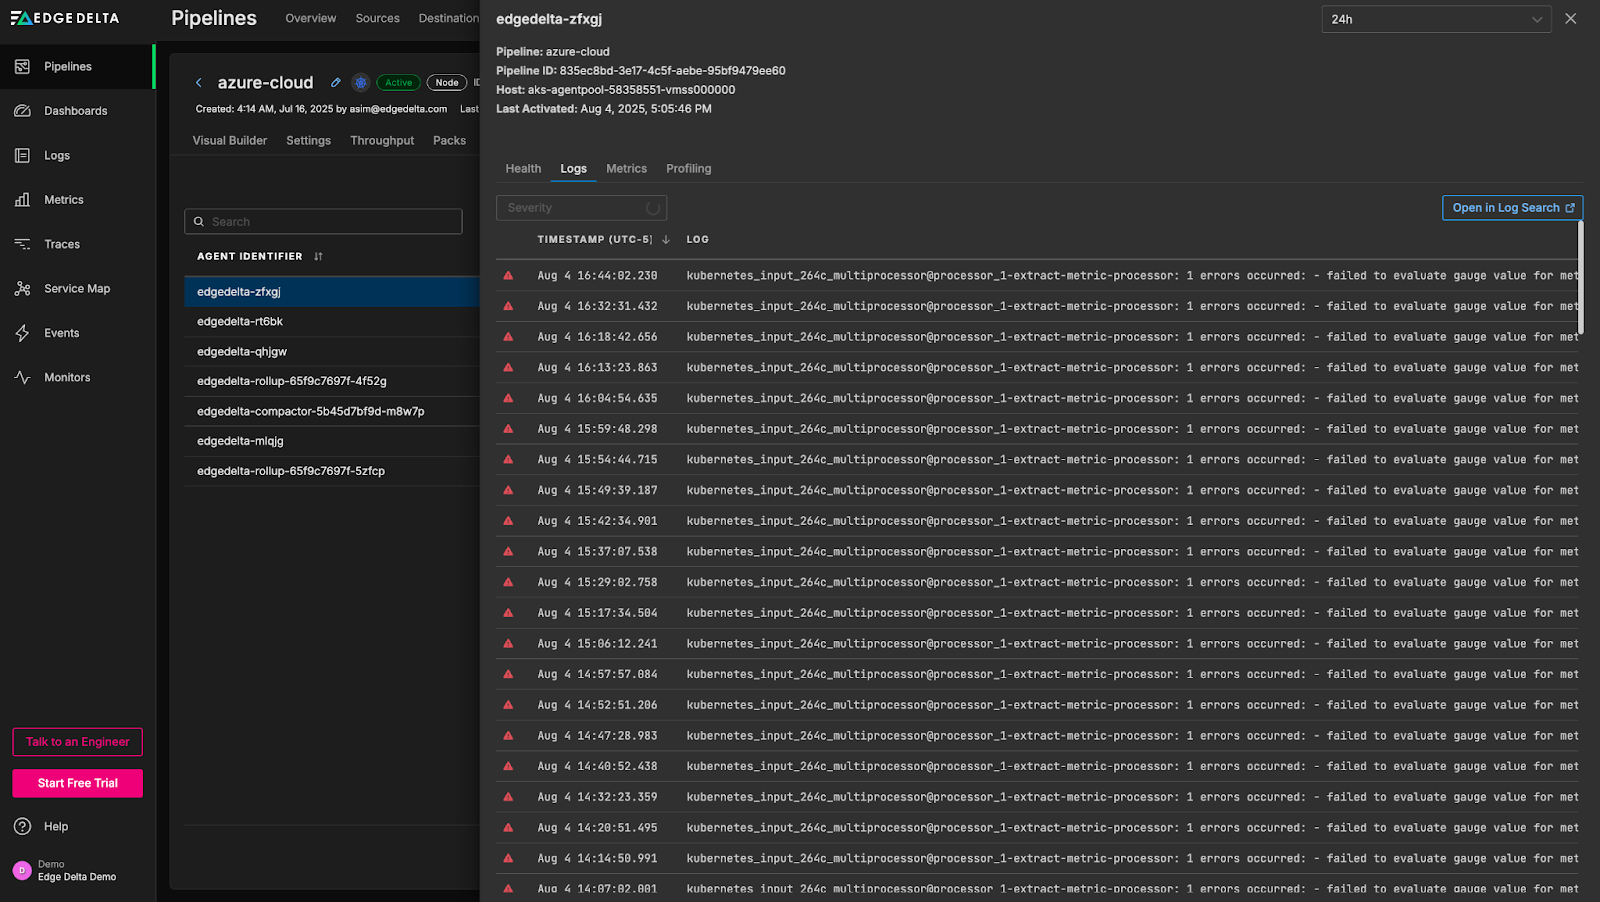
A significant number of error logs have been generated by the agent relating to the extract metric processor within the Kubernetes input multi-processor node, with the following message:
kubernetes_input_264c_multiprocessor@processor_1-extract-metric-processor: 1 errors occurred: - failed to evaluate gauge value for metric: http_code, err: incompatible value type: <nil>This indicates an issue with the extraction of the “http_code” metric — more specifically, that the “http_code” attribute seems to be missing in certain log items. From here, we can investigate the specific processor and correct the metric extraction logic, or add an additional processor to ensure the http_code is present.
With this in-depth visibility into pipeline health, teams can rapidly pinpoint root causes and immediately focus on resolving the issue — in this case, by simply fine-tuning a few processing rules — without wasting time sifting through thousands of irrelevant logs or metrics.
Conclusion
In today’s complex environments, deep visibility into both telemetry data and the pipelines that process it is critical for effective monitoring and troubleshooting. By combining high-level visualizations with granular, node-level performance metrics, Edge Delta enables teams to easily maintain pipeline health and identify and remediate incidents as soon as they occur.
Want to try it for yourself? Explore these capabilities firsthand in Edge Delta’s interactive Playground environment, or start a free trial.


