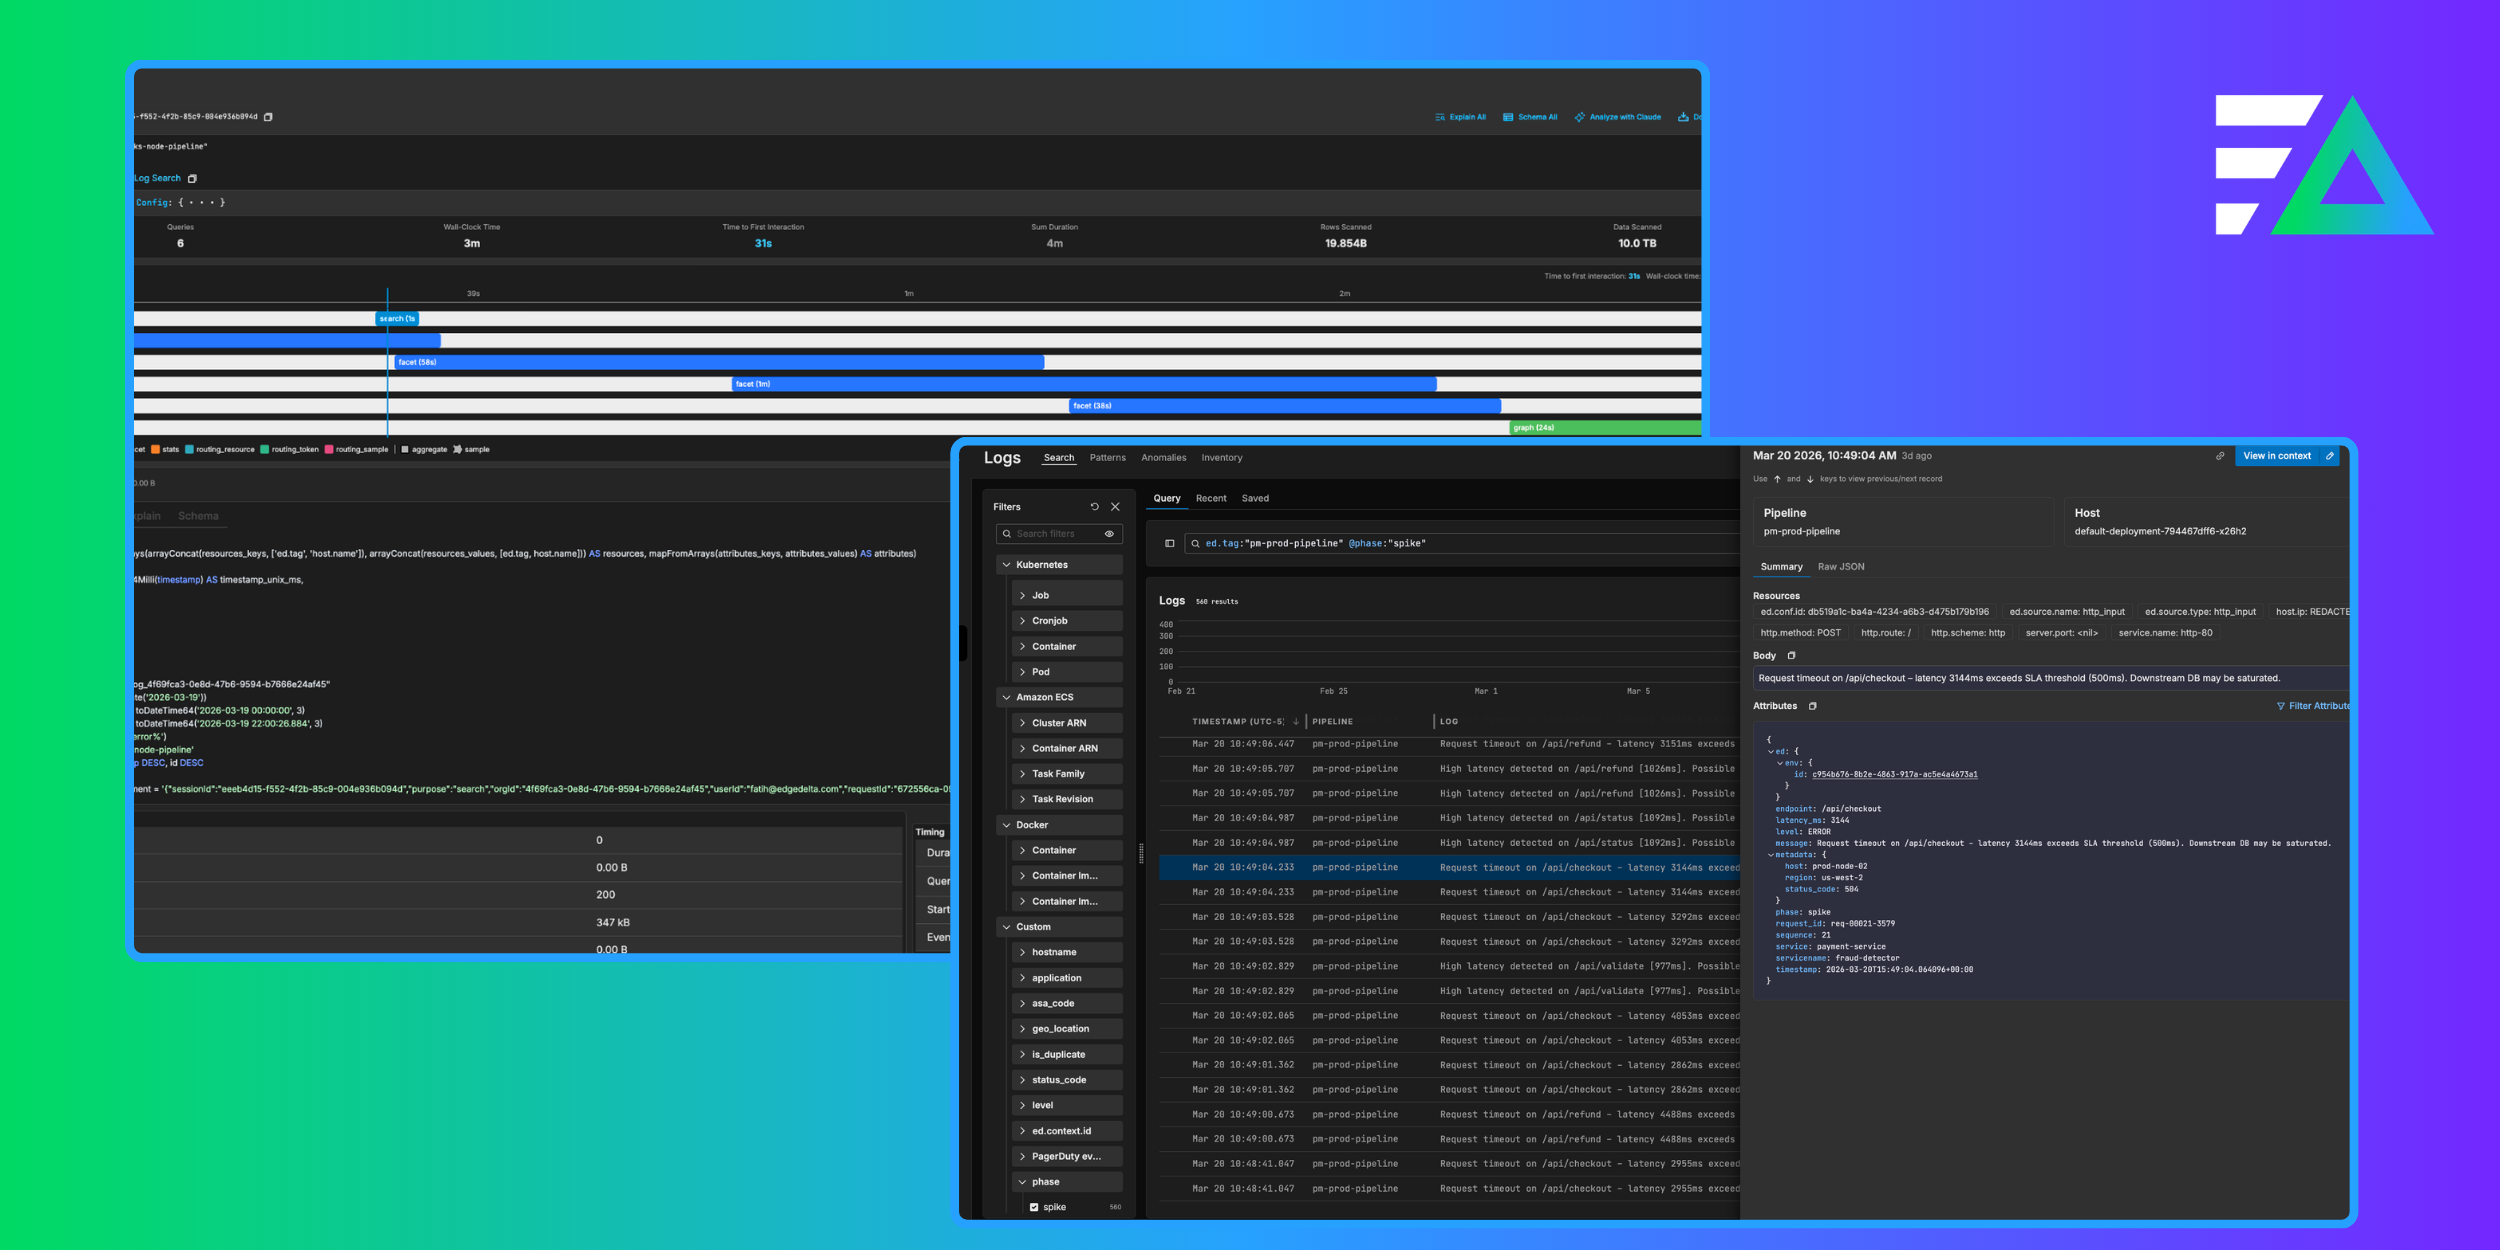
OpenSearch is an open-source observability platform that provides full-text search and advanced analytics for both structured and unstructured telemetry data. It was derived from Elasticsearch and Kibana and is maintained by the OpenSearch Project under the Apache 2.0 License, making it an ideal choice for organizations seeking flexibility, transparency, and freedom from vendor lock-in.
However, high-throughput streams of verbose, high-cardinality data can put heavy load on indexing and replication in OpenSearch’s backend, significantly slowing aggregations and driving up hardware requirements. Without pre-ingestion optimization, modern telemetry data volumes quickly degrade OpenSearch performance and escalate costs, leaving teams struggling to identify and remediate issues in real time.
By adopting Edge Delta’s Telemetry Pipelines, OpenSearch users gain end-to-end control over their telemetry data. They can feed clean, structured, and optimized data into their OpenSearch indexes, dramatically reducing log volume, eliminating inconsistent formats, and improving monitoring and analysis.
In this blog post, we’ll demonstrate how to stream data into OpenSearch with an Edge Delta Telemetry Pipeline — from cloud endpoint setup to intelligent, pre-index processing for workflow optimization.
Example Scenario: AWS-Hosted OpenSearch
In this example, we’re running OpenSearch v2.19 on AWS (which is the latest available version at the time of writing) and using a simple template to format the timestamp field within the incoming log data. For this environment, the OpenSearch domain is accessible over the internet only to a master user, with minimal resources allocated for security.
Configuring OpenSearch in AWS
First, we’ll navigate to the OpenSearch Domains page, and add a new domain using the “Create domain” button in the top right corner:
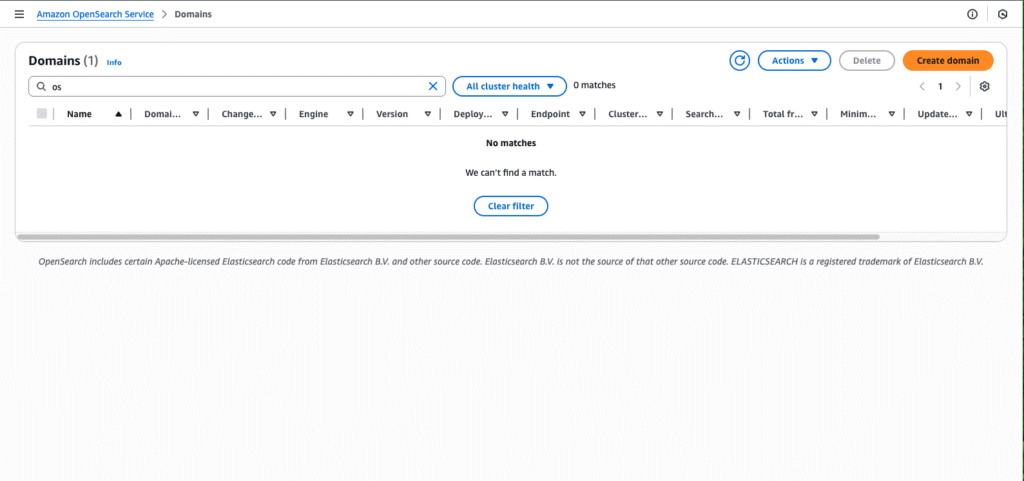
This will open up the “Create domain” page, where we can configure key parameters for our OpenSearch instance, including the master username and password, network type, access policy, and more.
Our full configuration is as follows:
- Name: “edgedelta”
- Domain creation method: “Standard create”
- Templates: “Dev/test”
- Deployment option: “Domain with standby”
- Availability Zone: “3-AZ ”
- Version: “2.19”
- Number of data nodes: “3”
- Network: “VPC access — Dual Stack”
- Enable fine-grain access control
- Create master user
- Access policy: “Only use fine-grained access control”
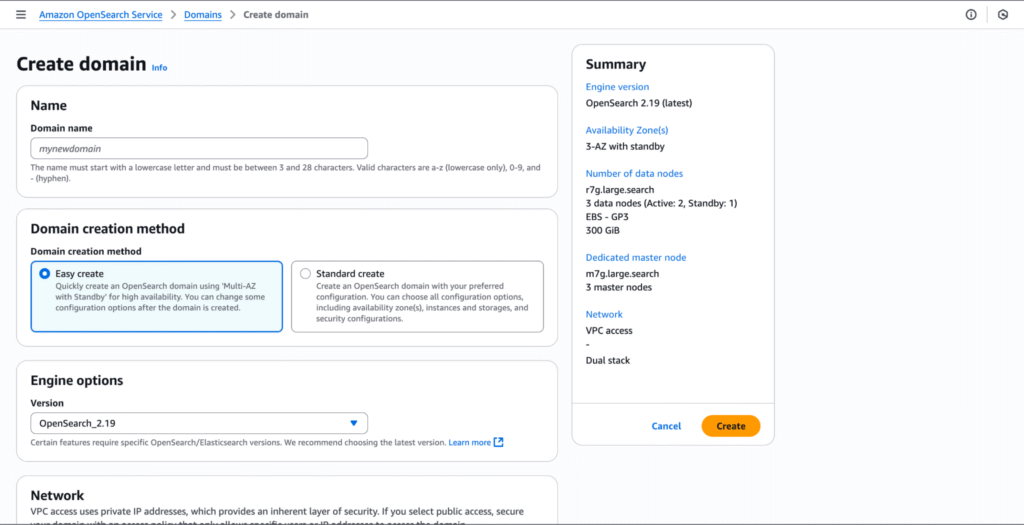
Once we click “Create,” our OpenSearch deployment is live, and we can log in to it via the master user credentials we set during configuration.
Log In to OpenSearch
Let’s navigate back to the OpenSearch homepage, where we’ll see our newly created domain:

We’ll need to supply our Edge Delta pipeline with the domain’s endpoint — to do this, we can click on the domain directly, and save it:
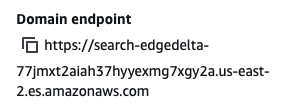
Now, let’s navigate to our OpenSearch instance using the “OpenSearch Dashboards URL” link on this page, and enter the master user credentials to log in to our home page:
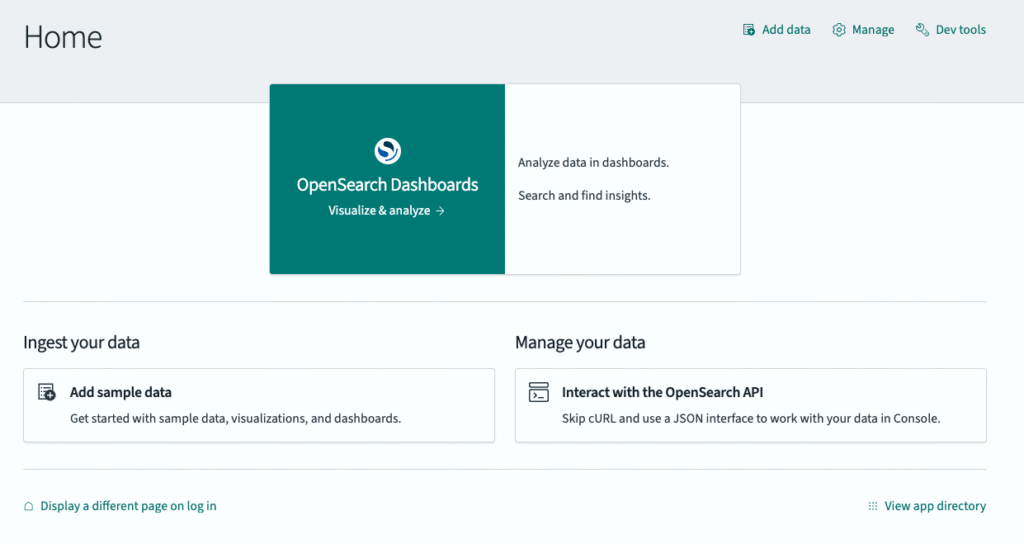
Index Creation
Once we’re in, we need to create indexes to receive data from our pipeline — they are required to query data in OpenSearch (for more details, see the official documentation). To do this, we’ll navigate to the “Management” section of the sidebar, select “Index Management,” and click on “Indexes:”
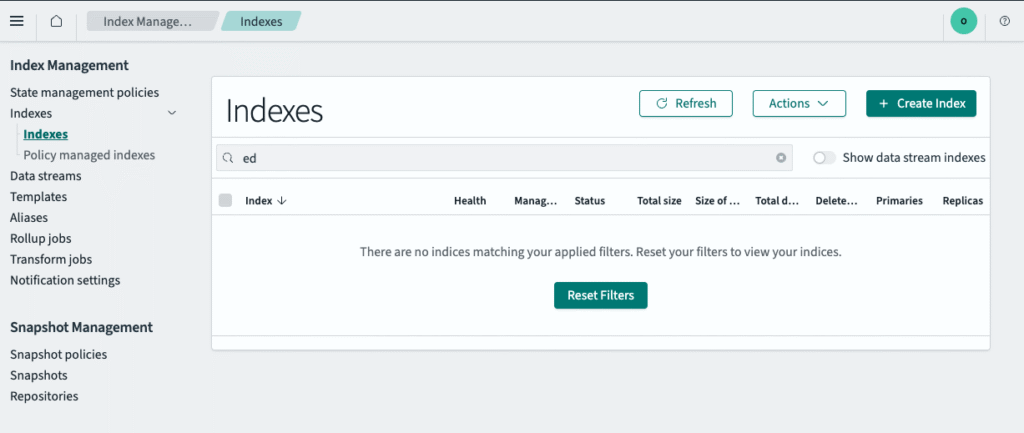
We’ll then click “Create Index” to begin configuration:
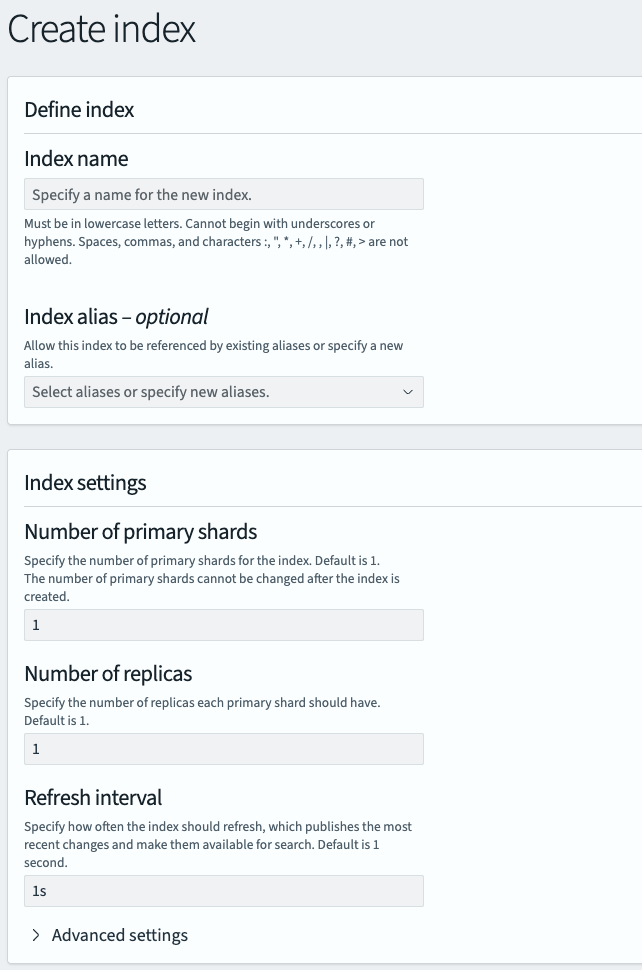
Our full configuration is as follows:
- Index Name: “ed-logs”
- Number of primary shards: “1”
- Number of replicas: “1”
- Refresh interval: “1s”
We’ll also set the index mapping for the timestamp field, as shown below:
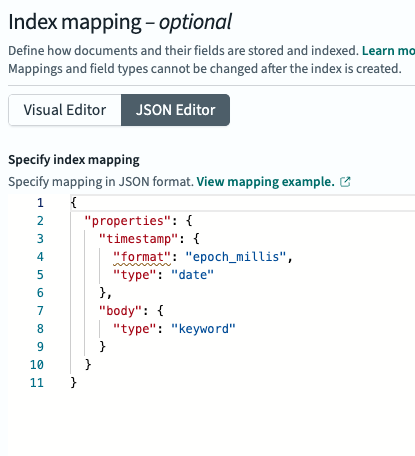
Feel free to copy and paste the following JSON:
{
  "properties": {
    "timestamp": {
      "format": "epoch_millis",
      "type": "date"
    },
    "body": {
      "type": "keyword"
    }
  }
}
Index Pattern Configuration
Next, we need to create an index pattern and tie it to our “ed-logs” index, which will inform OpenSearch to include it when we’re performing queries.
From the “Index Management” page, we’ll select “Dashboard Management,” and click on “Index Patterns” to create a new index pattern:
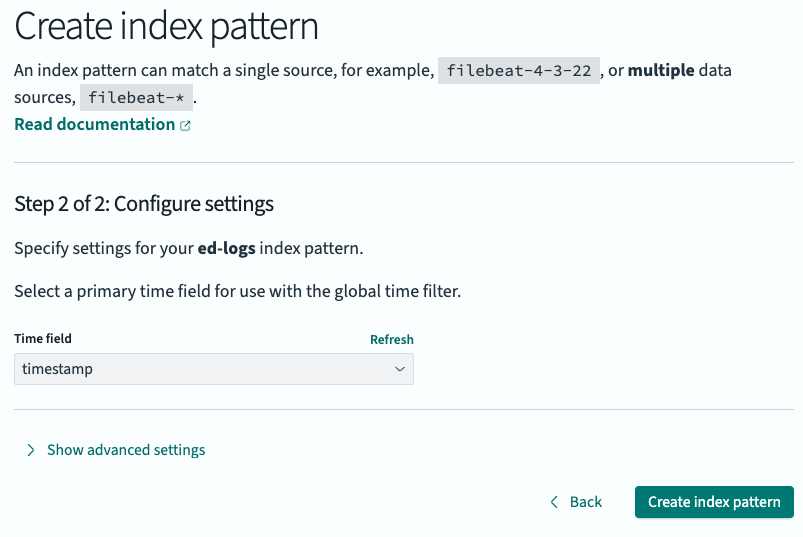
Then, we’ll click on “Next step,” map the time field to the timestamp property we created above, and select “Create index pattern:”
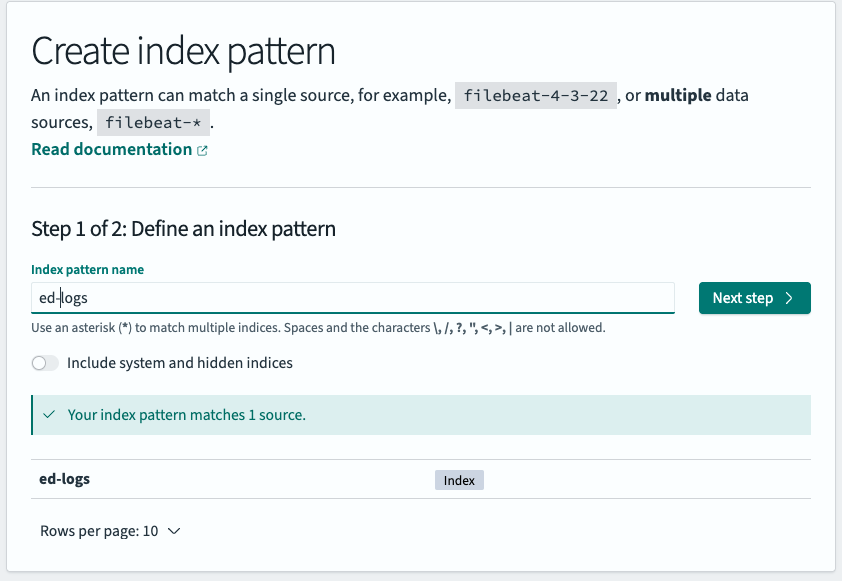
We now have a fully functioning index in our OpenSearch instance that can receive logs, and an index pattern to surface them in log search. Next, we’ll create a new Telemetry Pipeline in our Edge Delta account and start streaming data into it.
Edge Delta Telemetry Pipeline Configuration
For simplicity, we’ll deploy an Edge Delta Cloud Pipeline, which is a completely cloud-hosted Telemetry Pipeline that requires no local maintenance or infrastructure.
Cloud Pipeline Deployment
To create a Cloud Pipeline, we’ll need to:
- Navigate to https://app.edgedelta.com
- Log in using the appropriate credentials
- Click Pipelines
- Click New Pipeline
- Select Cloud Pipeline
- Click Continue
- Specify a name to identify the Pipeline: opensearch
- Click Deploy Cloud Fleet
Pipeline Configuration
Once our pipeline is deployed, we can start using it to send data into our OpenSearch environment. To do this, we’ll leverage Edge Delta’s built-in TelemetryGenerator source node, which allows us to send synthetic log data through the pipeline with minimal configuration.
First, we’ll navigate to the Pipelines page and select the OpenSearch pipeline:
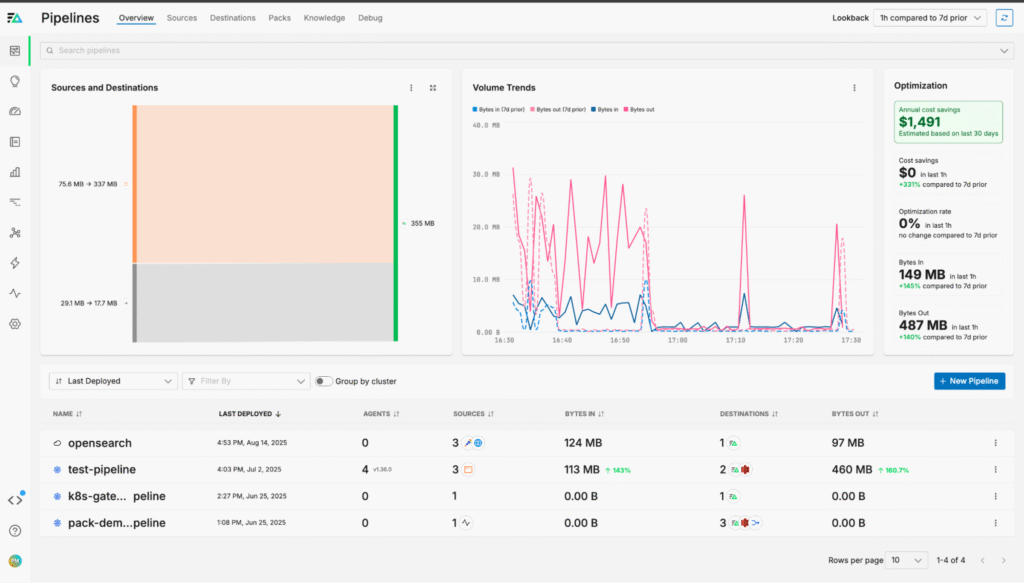
From here, we’ll add a new TelemetryGenerator node:
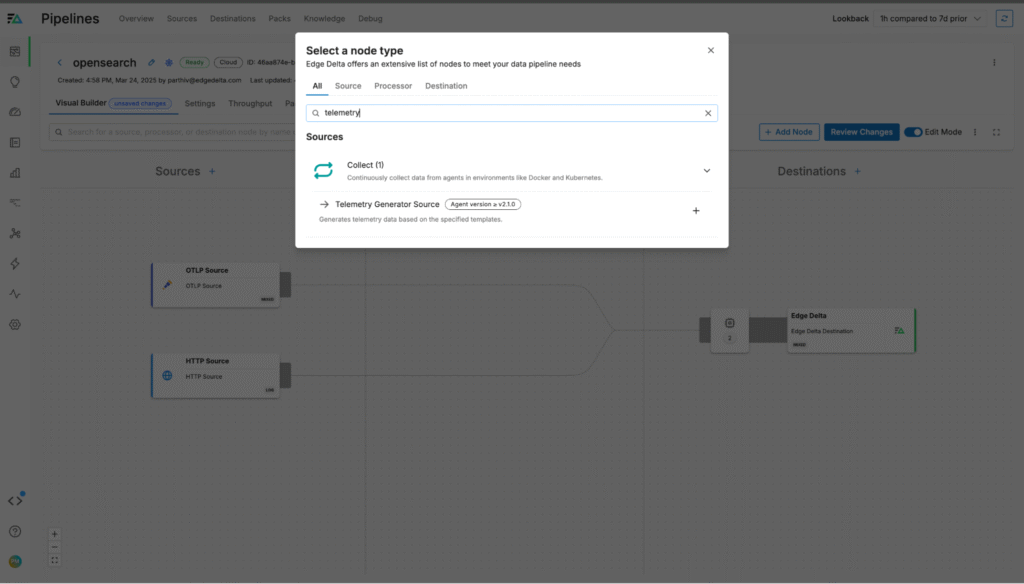
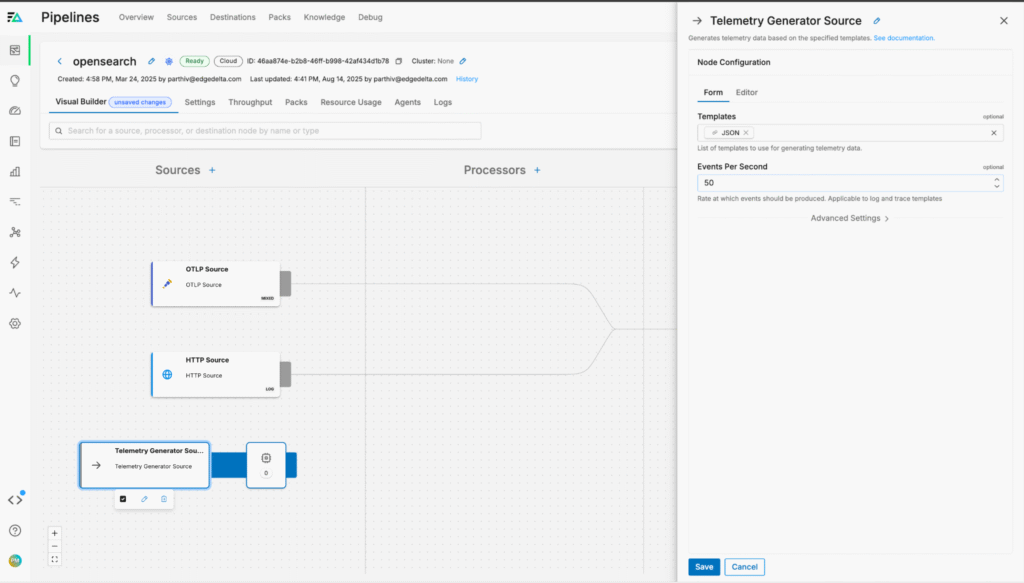
Then, we’ll configure the node to generate JSON-formatted log data at a rate of 50 events per second:
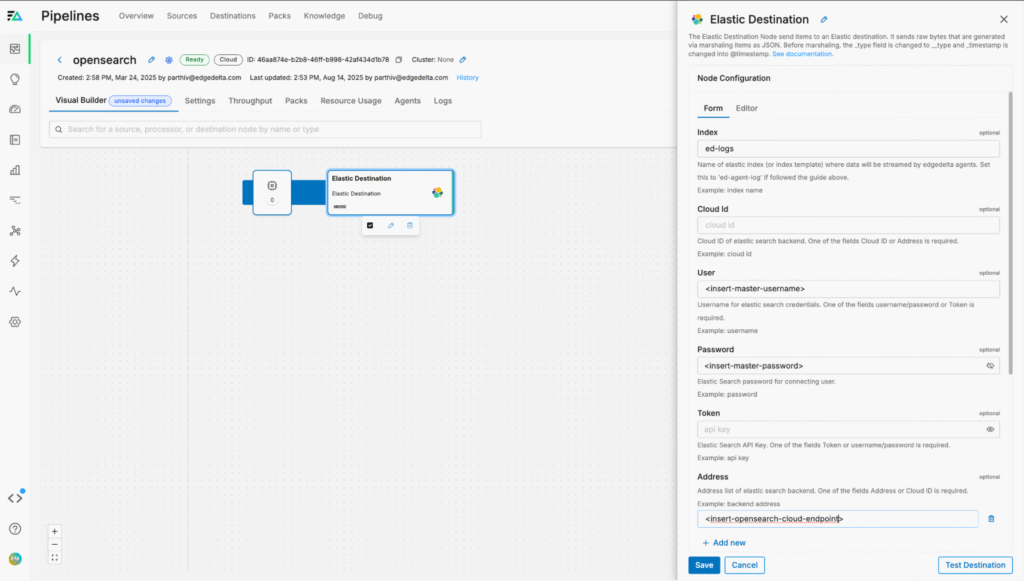
To continue, we need to configure our OpenSearch endpoint — we can do so by adding a new “Elastic” destination node to the pipeline and configuring it with our information to send data into our OpenSearch environment:
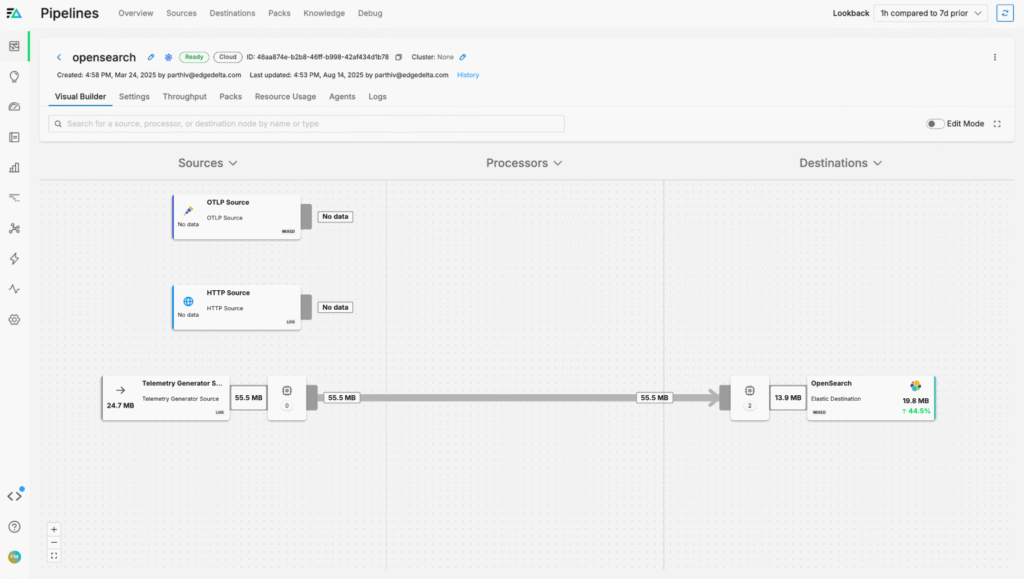
We can then create a new route from the TelemetryGenerator node into the Elastic node and save the pipeline changes using the “Review Changes” button on the top right. Data will now begin flowing:
Optimizing OpenSearch Logs
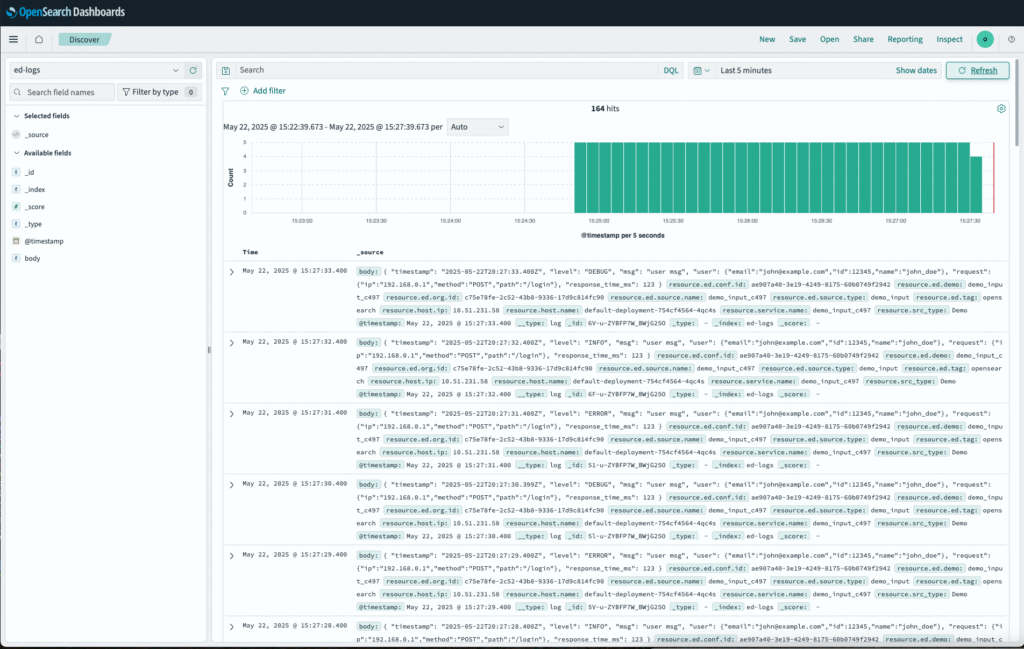
After the pipeline configuration updates are confirmed, logs will begin flowing into OpenSearch:
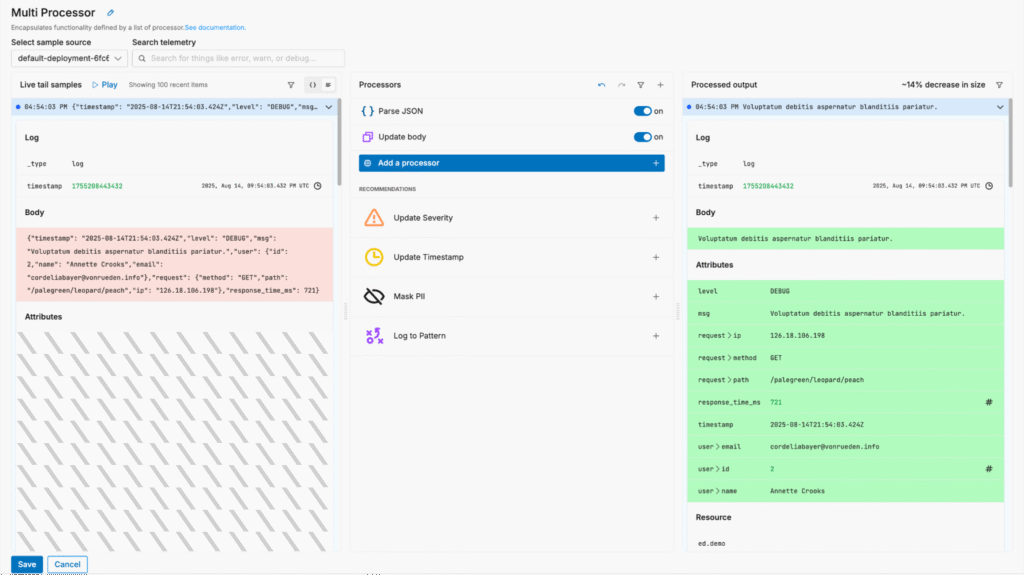
With Edge Delta’s Telemetry Pipelines, we can optimize log data to reduce volume pre-index without sacrificing visibility. For example, we can parse the JSON payload and streamline the “body” field to shrink log size without losing any fidelity:
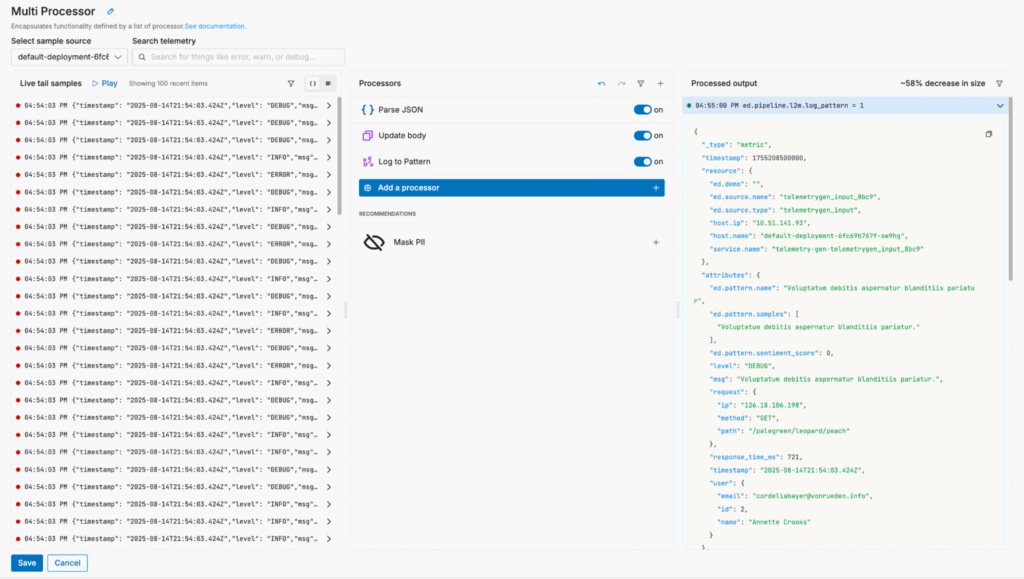
We can also summarize certain log data that’s only important at a high level by converting it into patterns, reducing log volume by up to 60%.
Conclusion
OpenSearch is a powerful search and analytics platform that supports both structured and unstructured data use cases, and its flexibility makes it a go-to solution for organizations that need full control over their platforms. But without pre-ingestion optimization, modern telemetry data volumes can limit its functionality and add unnecessary latency to every observability operation.
By combining OpenSearch with Edge Delta’s Telemetry Pipelines, organizations gain the best of both worlds — the powerful search and analytics capabilities of OpenSearch, along with intelligent, pre-index data processing, dramatic log volume reduction, and improved downstream performance. With our pipelines handling data collection, processing, and routing, teams can extract more value from their OpenSearch environment at fractions of the original cost, enabling faster insights and better observability across their environments.
To explore our pipelines yourself, check out our free Playground environment, or start a free trial.


