


Whether it’s Splunk’s acquisition of SignalFX and Omnition (Metrics and Tracing), Datadog’s acquisition of Logmatic.io (Logs), Elastic’s acquisition of Opsbeat (APM), New Relic’s release of “New Relic One”, or Sumo Logic’s rollout of “Unified Logs and Metrics” (with recent updates to include Distributed Tracing)…the list goes on and on.
As the platforms you know and love begin piecemealing these additional pillars to complement their core DNA, it can start to muddy the waters in regards to decisions such as: which tools to continue using, whether consolidating on a platform that claims to do it all is a good idea, or how heavily you want to invest in a specific pillar. As much as these vendors want to make us believe the three pillars are similar enough that once they’ve solved for one, they can quickly incorporate and integrate the others, the truth is that the fundamentals, challenges, complexities and nuances with each Observability data type are so distinctly different they might as well be from different planets.
Let’s quickly dig into some of these complexities…
Log Data
- Massive amounts of raw data being generated, and growing exponentially
- 1000s of different formats, structures, data types, etc.
- Compute intensive processes for ingesting, indexing, searching, analyzing
- Highly complex and nuanced query languages, operators, search syntax, etc.
- Never ending battle of parsing, structuring, and making sense of unstructured raw data
- Endless array of use-cases for the underlying datasets (DevOps, Engineering, SRE, QA, Security, Compliance, Business Intelligence, Product Management, etc.)
- Collection, Loggers, Appenders, Buffering, Queuing, Partitioning, Archiving, Compliance, Security, Sensitivity
Time Series Metrics
- Cardinality, Cardinality, Cardinality
- Application Code and Infrastructure Instrumentation
- Metric Types (Gauges, Counters, Histograms, etc.)
- Statistic Types, Rollups, Fidelity and Granularity, Quantizing,
- Metric Formats (Prometheus, Statsd, Carbon, Graphite, etc.)
- TSDB + Visualization Tools
- My personal favorite; percentiles of percentiles
Distributed Traces
- Complex Comprehensive Instrumentation (polyglot architectures, programming languages, 3rd party and open-source frameworks)
- Requirement to Instrument every component of request path (microservices, apis, etc)
- Exponential data-to-request ratio
- Head Sampling, Tail Sampling, and everything in between
- Limited UIs for iterative exploration and visualization of Traces
- Data Management, storage, processing
If you’re intimately familiar with one or more of the pillars of Observability, it’s common knowledge that it can take years to fully understand and master the fundamentals of a single pillar, let alone become a wizard of the trifecta. At Edge Delta, we’re blessed to have some these illusive 3-tiered wizards on the team to help build technologies to tackle the endless challenges of simplifying and optimizing Observability for our customers.

An actual photo of one of Edge Delta’s engineers harnessing the powers of the pillars of Observability.
The Challenge
As infrastructure scales, application architectures evolve to microservices or serverless, digital adoption skyrockets with the virus that shall-not-be-named, the explosion of digital exhaust and Observability telemetry is along for the ride. This explosion is only compounded with the drive to adopt additional Observability pillars along the way. The challenge of managing the cost, infrastructure, and complexities of Observability platforms and vendors is a discussion we have with customers on a daily basis.
These challenges that are quickly becoming apparent within many organizations are something that FAANG-esque companies (Facebook, Google, Netflix, Twitter, Airbnb, LinkedIn, Uber, etc… I’ll refer to them as “Fangers” moving forward) and their Observability teams have been forced to deal with for years on a massive scale. At the end of the day, we’re all trying to answer the question of how can we accurately detect (or predict) an issue is occurring as fast as humanly possible, and how quickly can we troubleshoot, investigate, and ultimately resolve the issue at hand to provide the most reliable experience for our customers and users (the pillars of Observability just being a means to an end).

We’ve leaned on the expertise of Fangers’ engineering teams to understand how they’ve addressed these challenges at petabyte scale, and have found that the common underlying theme is incorporating Stream Processing as part of the Observability Pipeline. If you’re not familiar with Stream Processing, the general idea is to gather insights and optimize streaming telemetry data in real time as it moves from the source (i.e. server, container, pod) to the final destination (log management platform, time series database, low-cost storage, data warehouse, etc).
The challenges addressed by introducing Stream Processing as a layer of the Observability Pipeline are threefold:
- Cost
- Speed
- Complexity
Cost
Let’s start with cost. There’s no question that Observability tooling is an expensive cost-center for many organizations, but there is good reason for that. It’s not cheap to centralize and continuously process, analyze, and store terabytes or petabytes of unstructured and structured data in the cloud or on-premise.

Stock image of your finance team paying the Observability bill.
Typically platforms are licensed in some form or another on raw data volume ingested, indexed, throughput, etc. The pricing however can be nuanced depending on the Observability data type, i.e. data points per minute, cardinality or time-series for Metrics, spans for Tracing, services, hosts, or containers for Infrastructure, etc.
These ingest metrics allow vendors to infer a number of things about a customer (number of nodes, cardinality, potential number of users, etc), i.e. a company generating 10 GB/day of raw data most likely doesn’t have a 5000+ node cluster distributed across multiple public clouds and datacenters, with thousands of microservices and hundreds of potential users of the Observability tool. They might be an emerging startup, or a non-technology company with a limited infrastructure and software footprint. A company generating 1TB/day+ of raw Observability data is more likely to be an established enterprise company with a large application and corporate infrastructure footprint, or a hyper growth, highly transactional startup (i.e. gaming, fintech, blockchain, adtech, ecommerce, social media, etc), with sizeable and continuous technical demands for these datasets.
If the technology being leveraged is open-source, or “open-source++”, organizations may not face the same direct licensing costs around throughput, storage, retention, etc, but the costs are realized in direct correlation: The infrastructure, compute, storage, FTE Engineers, upgrades, patching, maintenance, scaling and general toil to host and run the platform in-house are not as free as the underlying technology being run.
Stream processing addresses the cost factor in a number of different ways. We typically refer to widely used Observability platforms (i.e. Splunk, Datadog, New Relic, Sumo Logic, Elastic, Lightstep, etc.) as Centralized Monitoring Platforms, meaning the underlying Observability data needs to be centralized into the aforementioned technologies before you can start to glean analytics and Observability insights out of the data. What stream processing provides is the ability to continuously glean the useful Observability insights out of the raw data in real time in an optimized format while the data is in transit to the destination of choice. By extracting the useful statistics and insights (the information you care about) out of the data prior to centralization, it allows organizations to make intelligent decisions regarding where the raw (expensive) data ultimately ends up.
Customer Example: 1TB/Day Splunk Deployment
Let’s take a look at application log data as an example. A customer we recently worked with had performed an analysis of their Splunk deployment and determined <span class=”callout”>95% of the raw logs indexed were never explicitly queried or searched on directly by an engineer.</span> The data was either being used to power real time dashboards and alerts, or as a costly insurance policy in case the data ever theoretically needed to be searched on (i.e. in the case of troubleshooting, root-cause analysis, or forensic security investigations). Along with this, they were forced to disable certain logging levels and exclude lower environments altogether due to budgetary limitations. The issue with this model is that during healthy-steady state (the majority of the time), they were paying an arm and a leg to index data that was essentially never utilized or looked at.
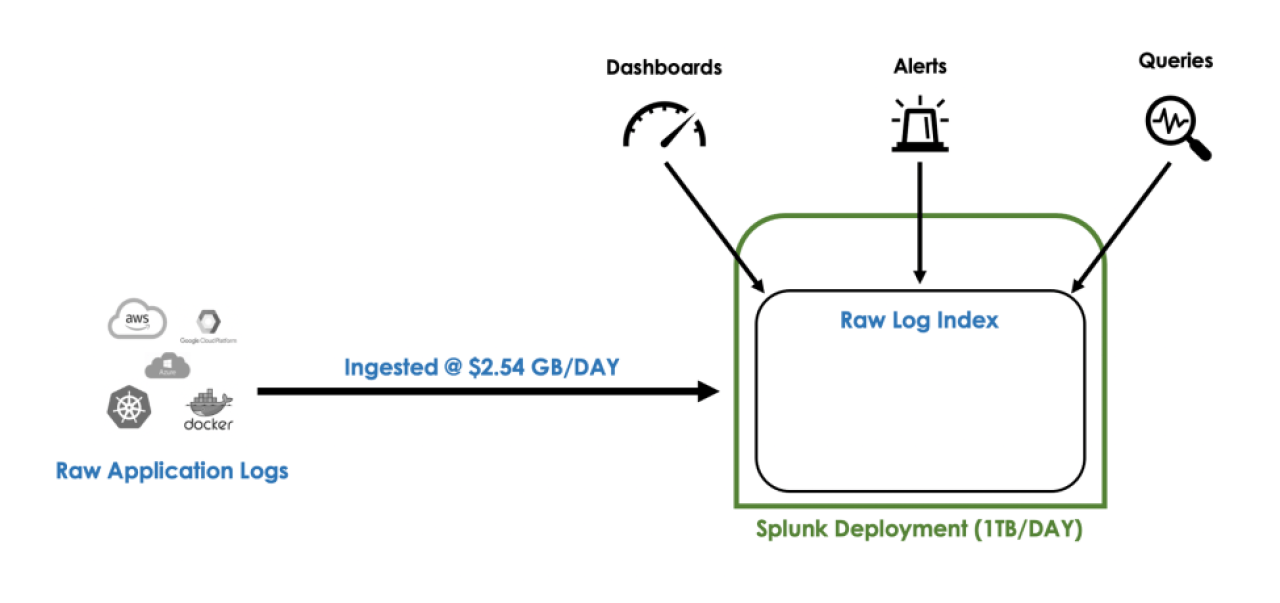
High-level overview of this customer’s existing Splunk deployment.
What we ultimately provided them was an ability to stream process the raw data while in transit, generate the necessary datasets to power the existing set of dashboards and alerts in their Splunk deployment, and provide routing levers to determine the best destination for the raw datasets during healthy-state (i.e. low cost storage), with the ability to quickly gain access, index, or replay as needed during the times of investigation. In tandem to the low cost storage destinations for all raw data, provide automated mechanisms to ensure all high value raw data was automatically indexed, hot and searchable during anomalous windows and notable events (alerts, spikes, deviations, releases, updates, etc.).
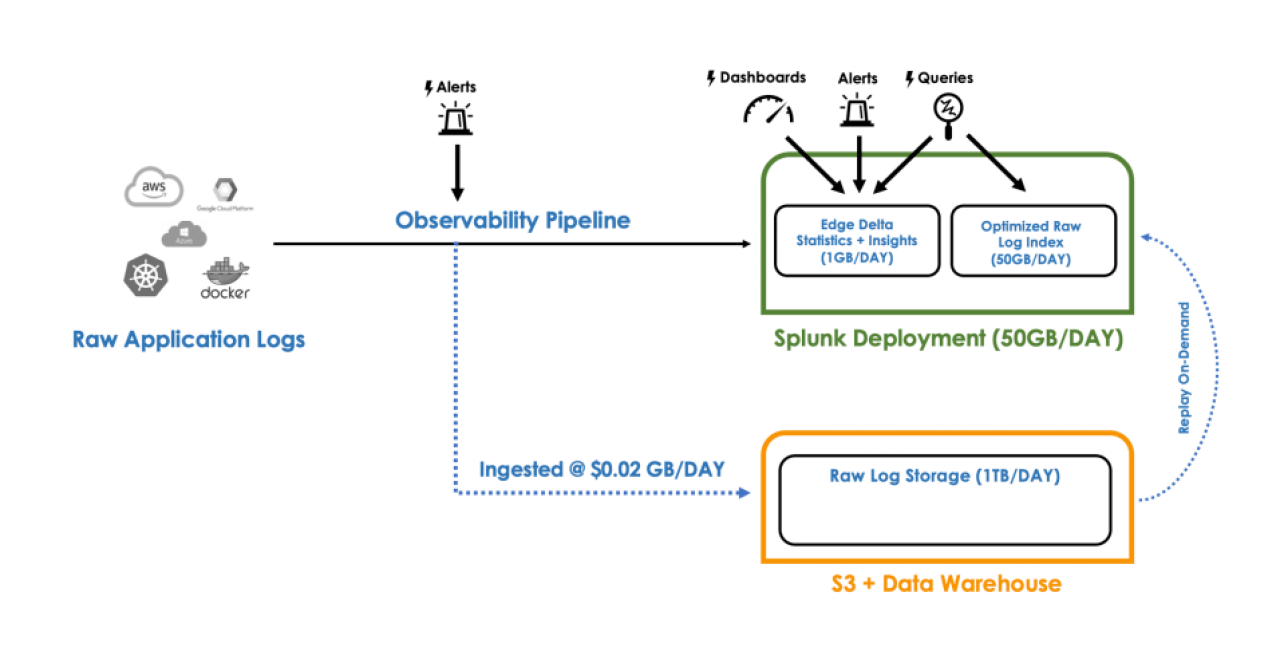
High-level overview of the customer’s optimized environment after introducing Edge Delta’s Observability Pipelines using Stream Processing.
This approach is not a novel concept for many large scale Observability teams. A large inspiration behind Edge Delta’s approach to Observability is the amazing work Netflix has done in the space, and to quote them:
At some point in business growth, we learned that storing raw application logs won’t scale. To address scalability, we switched to streaming logs, filtering them on selected criteria, transforming them in memory, and persisting them as needed.
A primary difference between Netflix and the average company is they essentially have unlimited engineering horsepower they can throw at complex problems like Observability, allowing them to design and implement advanced solutions such as Stream Processing for Observability in house.
What we provide at Edge Delta is a plug-and-play Observability Pipeline and Stream Processing engine designed to seamlessly integrate with organization’s existing Observability tool stack and architectures, unlocking the benefits large scale Observability teams have realized for years, so that your engineers can focus on their core competencies and innovate.
Speed
Let’s dig into the speed component next. While speed is a somewhat loaded concept in the world of Observability, what we try to focus on are KPIs such as alerting latency (the time from raw data being generated at the source to the time on-call receives a page that there is an issue), ingestion latency (the time from when the raw data is generated to the time it’s available to power real time analytics), as well as some of the table stakes such as MTTD, MTTR, or MTTI (jokingly referred to as “Mean Time To Innocence” by an engineer we recently chatted with). As customer and user expectations continually increase, every second and minute of downtime can have lasting ramifications. A primary goal of Observability is to prevent downtime and outages from occurring, while providing the tools to quickly investigate and resolve issues when they arise. If your on-call team receives a page 15 minutes after an outage has started, chances are the users have already reported or tweeted their frustration before the alert had ever surfaced.
Stream processing addresses the speed challenge in a number of different ways. There are a few reasons these latencies exist with current architectures, but at a fundamental level the bottleneck is the fact that the raw data needs to first be collected from the source, buffered, queued, transferred to a centralized platform, ingested, indexed, stored, parsed, etc., before any analytics can be performed against the data. Once those processes have taken place, there then needs to be the queries, monitors, or batch-process functions that look for concerning patterns, and in many cases these checks run at some frequency, i.e. every minute, 15 minutes, etc. With all the data transfer, hops, and intervals that take place along the way, there’s no question why it may take 10, 15, even 20 minutes plus before alerts fire notifying engineers a system is down.
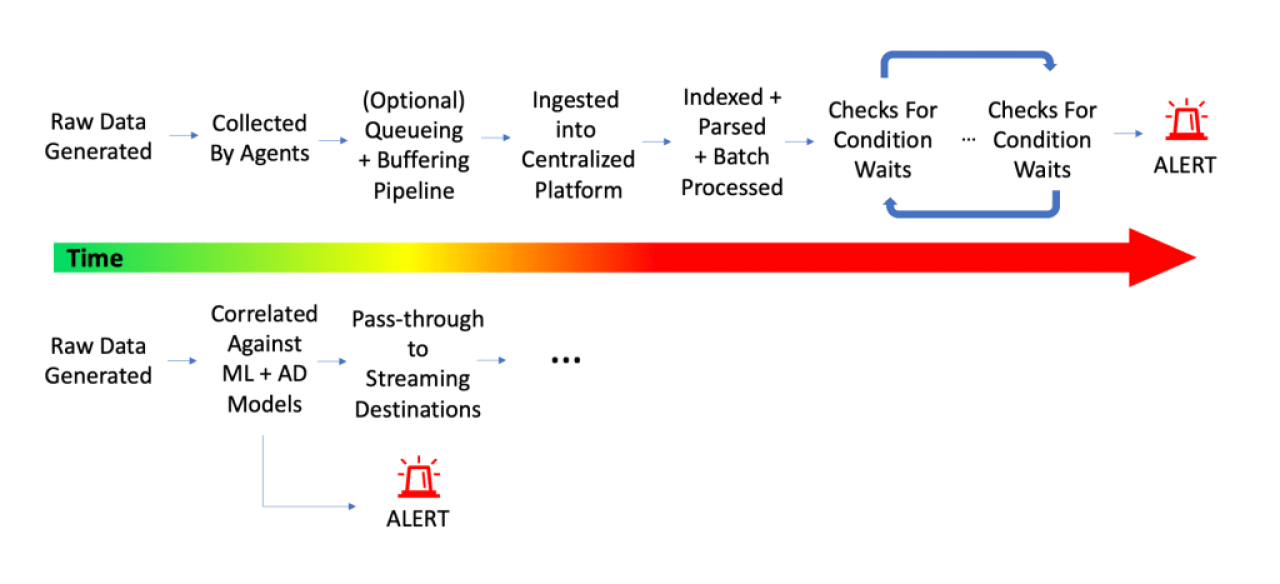
Top: Traditional alerting pipeline and the various hops and latencies that take place between data generation and an alert being fired. Bottom: Stream Processing Observability Pipeline alerting framework, removing lag and various alert latencies by analyzing data as soon as it is generated.
By Stream Processing raw data in real time as it flows through the Observability Pipeline, this allows the system to alert instantaneously on deviations, anomalies, interesting findings, etc. without having to wait for the data to flow through the various hoops of a traditional centralized model. In addition to having this direct window into live data flows at event creation time, the Stream Processing engine unlocks the ability to perform significantly more complex Anomaly Detection, Correlation, and ML that would otherwise be technically infeasible or cost-intensive if waiting for the data to be batched and centralized first. ML models can be trained and baselined against all raw data at the edge, while the overarching updates and correlation of the models can be optimized centrally, a concept commonly referred to as Federated Learning. These additional functions that can be performed against the data in real time significantly decrease both the Alerting Latencies, and MTTD, but can also optimize MTTR and root-cause analysis processes. We’re not going to say there is or ever will be a magical easy-button for root-cause analysis, but by performing automated pattern analysis, correlated monitoring, and other stream processing functions, the ability to provide pin-pointed context and indicators of root cause can be performed, ultimately reducing the time to rollback and address outages.
Complexity
If you’ve made it this far, you might be thinking to yourself “well this all sounds really complicated”. That’s because it is, but it doesn’t have to be complicated for you. Fortunately for everybody, the mental gymnastics and heavy lifting has already been done by the Fangers of the world, now it’s time to reap the benefits to enhance existing Observability tool stacks.

This could be you.
Stream Processing and Observability Pipelines can reduce the complexities of Observability stacks in numerous ways. Dealing with one Observability pillar’s datatype can be extremely complex in itself, but bringing together multiple Pillars disparate collection, and routing methods in parallel only exacerbates the issue. Recent advancements with open-source technologies like OpenTelemetry looking to consolidate these streams and collection methods are a step in the right direction, but the problems continue to persist. An Automated Observability Pipeline provides direct visibility into answering questions such as:
- Where each data stream is being collected from
- Where each data stream is being routed to
- What’s happening with the data along the way
- Are there anomalies with the volume of data being generated and collected
- Are there any issues with the data flow from event generation to placement into the destination
Stream Processing data as it travels through the pipeline significantly reduces the complexities of backend destinations by gaining significantly more control over the volume of raw telemetry and statistical data that ends up in the tool. The challenges of things like scaling, partitioning, sharding of Observability platforms are an artifact of the architecture that requires all raw data to be ingested first and batch-processed before any analytics can be performed on the datasets. By asking questions of the data and extracting insights while in motion, the requirement to crunch and store heaps of raw data at rest is reduced significantly, thus reducing the complexity of managing and scaling massive platforms (and makes dashboards load much faster ).
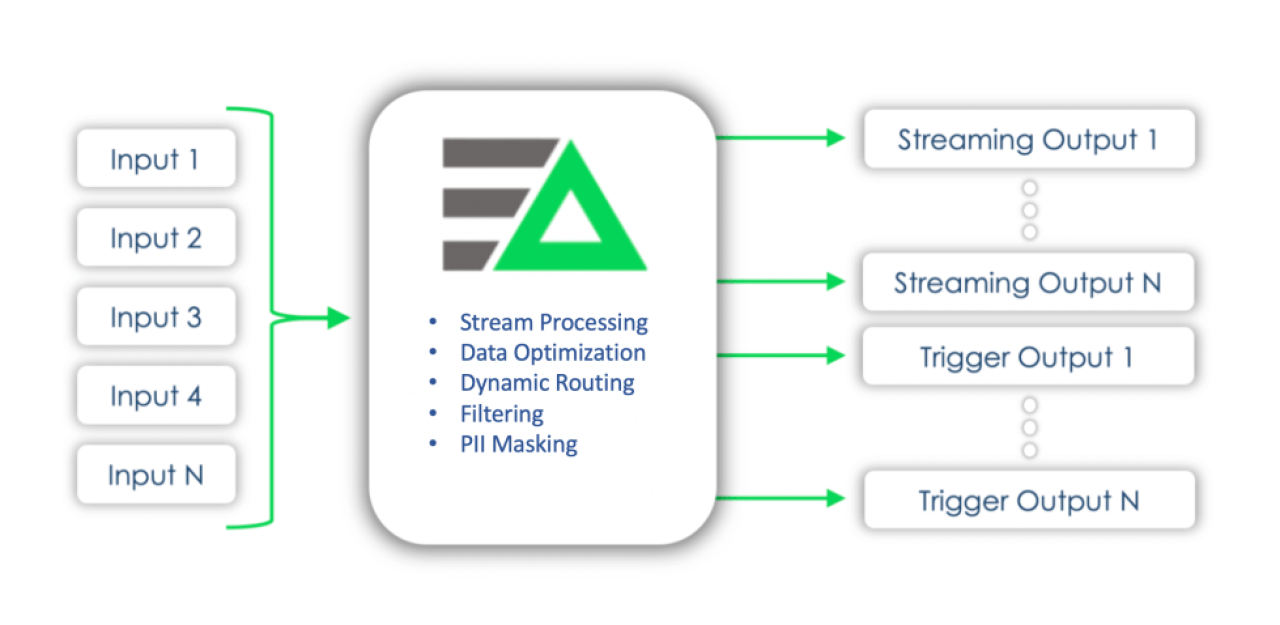
In addition to data optimization, Stream Processing in the Observability Pipeline allows users to perform simple, yet powerful functions such as organizing, filtering, sampling, aggregating, masking sensitive data, bifurcating and routing to optimal destinations, which is not a trivial task when performed on disparate datasets and streams across multiple agents, vendor specific tooling, and vendor-inherent limitations with minimal motivation to innovate on the pre-ingestion layer.
“Better, faster, cheaper” …I vividly remember a day in a past life, on-site with a prospective customer, being shuffled between an endless sprawl of already-booked conference rooms, speed walking around and having the architect reiterate multiple times “our platform needed to be better, faster, and cheaper than the competition to even have a shot at starting a proof-of-concept”. With many of the purpose-built Observability tools being commoditized by the market, being not only better, faster, but also cheaper is a never ending battle, nevertheless one that needs to be fought. The battle we’ve chosen to fight at Edge Delta is approaching the problem from a fundamentally different angle, ultimately providing a better, faster, cheaper (and less complex) Observability stack for our customers, in turn helping them provide a similar experience for their customers.
If you can’t tell, here at Edge Delta we are very excited and passionate about the world of Observability! It has been an exciting ride working with organizations to realize the power of Stream Processing for Observability Pipelines, and we’re only getting started.
If you are interested in learning more, don’t hesitate to shoot me a message at zach@edgedelta.com, on LinkedIn, or get started with a free trial today!


