

Standardizing on the OpenTelemetry schema enables maximal environment clarity. By unifying disparate data formats and correlating logs, metrics, traces, and events together, you gain deeper visibility and reduce blind spots.
Through its collection of APIs and SDKs, the OpenTelemetry project allows teams to instrument code to generate OTel-formatted telemetry data. From there, teams can leverage the OpenTelemetry Collector to ship their data downstream to analysis and monitoring backends. However, the OTel Collector can fall short at providing users with critical visibility into their data flows, forcing teams to allocate time and resources to optimize and maintain its functionality.
In this blog post, we’ll walk you through how to send telemetry data from the OTel Collector into Edge Delta’s end-to-end Telemetry Pipelines via OTLP, to enhance processing and help you gain full control and visibility over your data flows with ease. We’ll also show you how to replicate the Collector’s functionality with our own lightweight agents, to further enhance your telemetry strategy.
Example Scenario — OTel Collector + Linux
In this example scenario, we’re running the OTel Collector on an RPM-based Linux host, and want to shift processing left to save on downstream ingestion costs. However, the Collector is limited in the processing functionalities it provides. For instance, if we want to apply ML intelligence on our data in real time as it’s flowing through the pipeline, the Collector can’t help us.
To do this, we’ll send data from the Collector into an Edge Delta Cloud Fleet. Once there, we can run further processing on it, including intelligent log patternization, log to metric conversion, Lookup Table enrichment, and more, before shipping it downstream into expensive indexes.
Configuring the Collector and Cloud Fleet
Create a Cloud Fleet
First, we need to create a cloud fleet through Edge Delta’s UI. This can be done by:
- Navigating to https://app.edgedelta.com
- Creating a new account or logging in using the appropriate credentials
- Clicking Pipeline
- Clicking New Fleet
- Selecting the Cloud Fleet option
- Entering a pipeline name
- Clicking Deploy Cloud Fleet
- Waiting for the cloud fleet deployment to complete
- Clicking View Dashboard

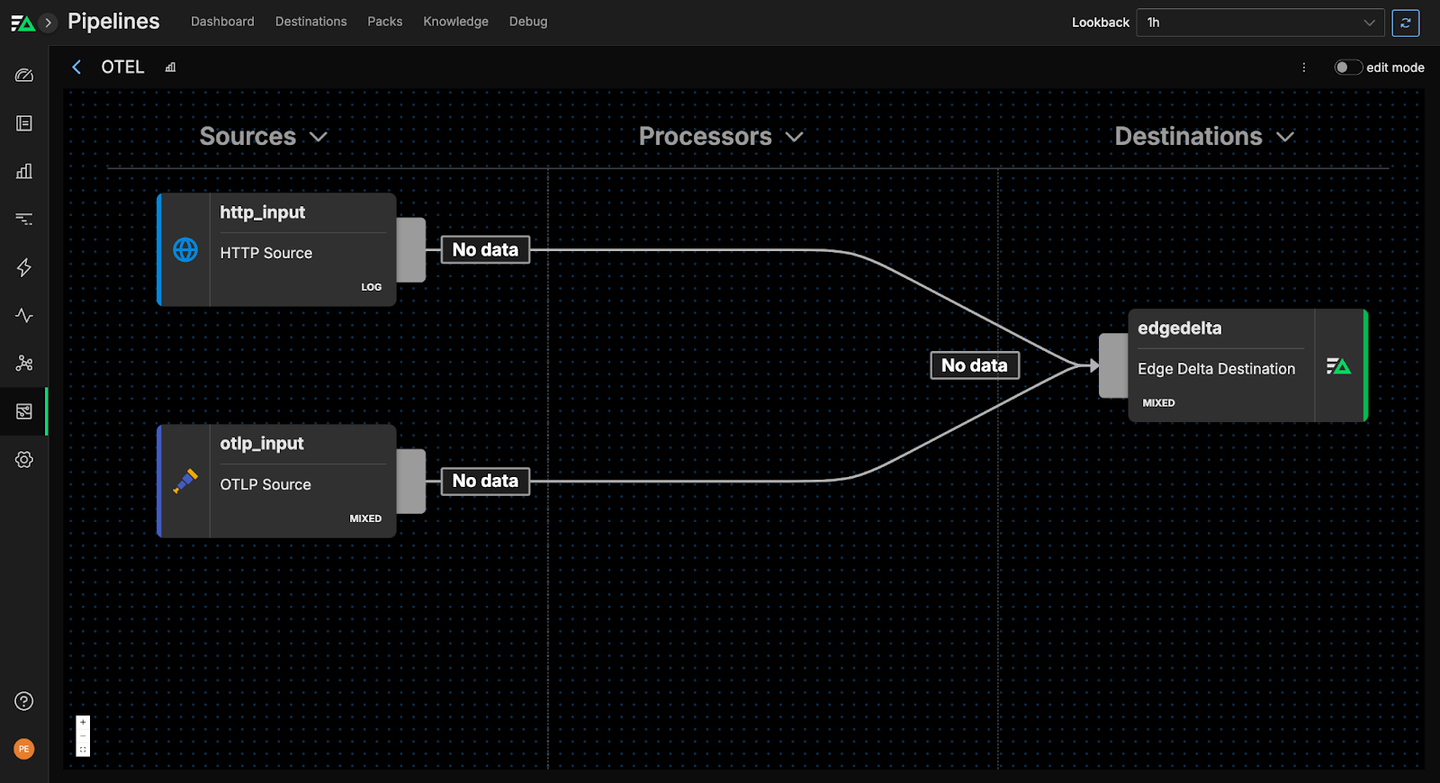
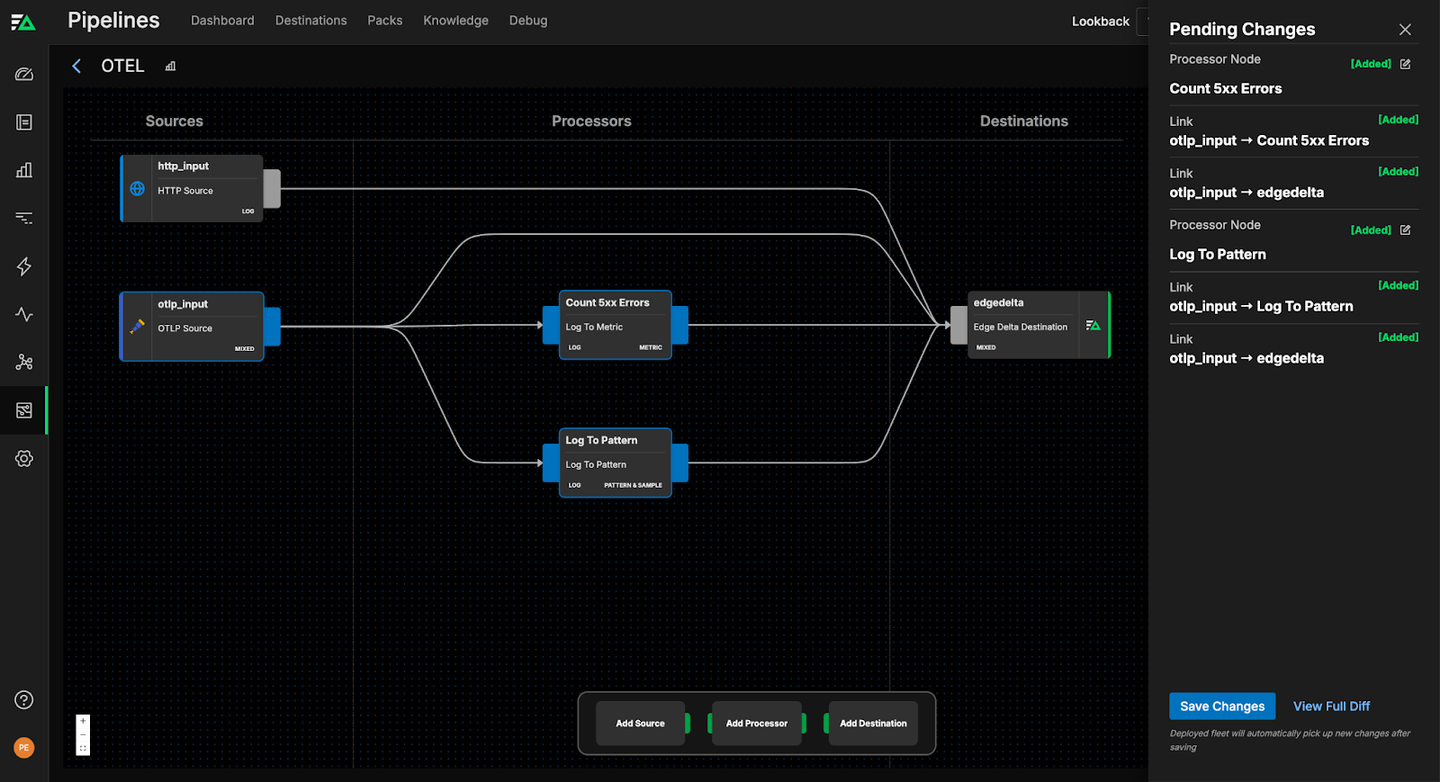
Here’s what the pipeline looks like once created:
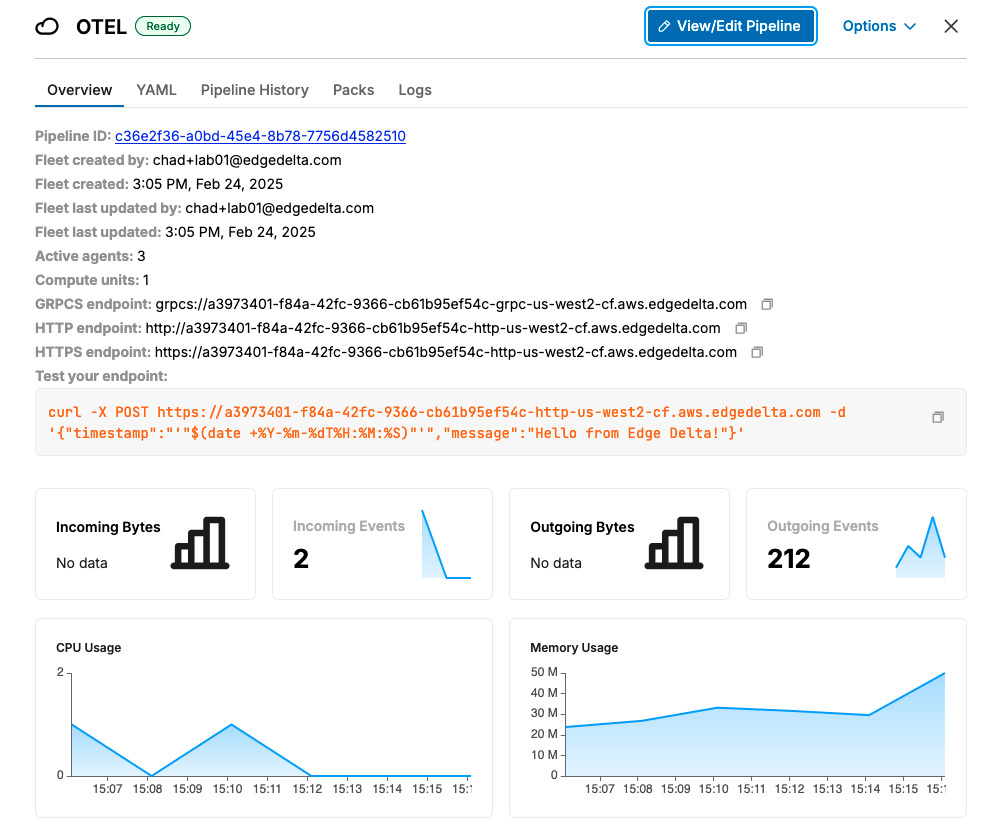
Once the new pipeline is spun up, we need to tell the OTel Collector how to push data into it. To do this, we first need to:
- Navigate to the Pipeline Dashboard page
- Select the newly created pipeline
- Save the GRPCS Endpoint
Update the Collector Config
To install the OTel Collector onto our Linux machine, we’ll follow these steps:
- SSH into the Linux machine (Amazon Linux for this example)
- Run the install commands
Note: Be sure to install the contrib application to ensure all required extensions are installed.
sudo yum updatesudo yum -y install wget systemctlwget https://github.com/open-telemetry/opentelemetry-collector-releases/releases/download/v0.120.0/otelcol-contrib_0.120.0_linux_amd64.rpmsudo rpm -ivh otelcol-contrib_0.120.0_linux_amd64.rpmOnce installed, we’ll run the systemctl status CLI command to retrieve information on the Collector’s current status:
systemctl status otelcol-contrib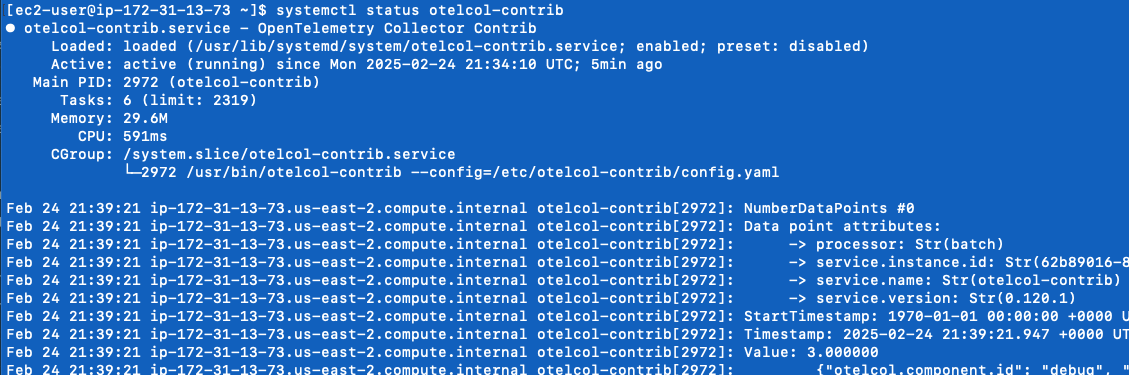
Everything’s looking good. Now, we need to update the Collector’s config to point to our newly created cloud fleet by adding the pipeline’s GRPCS endpoint to the services and exporter list. To configure this, we can nano into the Collector’s YAML config file and update the endpoint value to our cloud fleet’s GRPCS endpoint:
sudo nano /etc/otelcol-contrib/config.yamlExample configuration (tailing log files in the /var/log/test directory)
extensions:
  health_check:
  pprof:
    endpoint: 0.0.0.0:1777
  zpages:
    endpoint: 0.0.0.0:55679
receivers:
  filelog:
    include: [ /var/log/test/*.log ]
  otlp:
    protocols:
      grpc:
endpoint: 0.0.0.0:4317
      http:
endpoint: 0.0.0.0:4318
  # Collect own metrics
  prometheus:
    config:
      scrape_configs:
      - job_name: 'otel-collector'
        scrape_interval: 10s
        static_configs:
        - targets: ['0.0.0.0:8888']
  zipkin:
    endpoint: 0.0.0.0:9411
processors:
  batch:
exporters:
  debug:
    verbosity: detailed
# Edge Delta GPRC destination named: otlp
  otlp:
    endpoint: a3973401-f84a-42fc-9366-cb61b95ef54c-grpc-us-west2-cf.aws.edgedelta.com:443
# Add the otlp exporter to each of the exporters desired
service:
  pipelines:
    traces:
      receivers: [otlp]
      processors: [batch]
      exporters: [debug, otlp]
    metrics:
      receivers: [otlp, prometheus]
      processors: [batch]
      exporters: [debug, otlp]
    logs:
      receivers: [otlp, filelog]
      processors: [batch]
      exporters: [debug, otlp]
  extensions: [health_check, pprof, zpages]
Once updated, we can quickly restart the OTEL collector:
sudo systemctl restart otelcol-contribAnd check the OTEL Collector logs:
sudo journalctl -u otelcol-contrib -fApply Data Processing
Before shipping the data further downstream, we want to run some log analysis at the pipeline level. We’ll first apply ML intelligence through Edge Delta’s log to pattern node, which groups logs into patterns and assigns them an associated severity score. We’ll also add a log to metric node to extract some key metrics from our log data, which will be more efficient than doing so after centralizing all the data in the backend.
Now that the data is appropriately processed, it can be sent into any observability backend or archival storage destination. We’ll ship it into Edge Delta’s backend, which serves as a cost-efficient, functional alternative to the legacy platforms charging high ingestion and retention fees.
Once the Edge Delta destination is added, we can:
- Navigate to: https://app.edgedelta.com
- Select Logs
- Filter the logs down to the Cloud Fleet created earlier
- Inspect the logs
And just like that, logs are coming through the pipeline! We can now query through the logs, create new facets to filter them by, inspect individual log items, and much more.

Migrating to Edge Delta’s Highly Performant Agents
Though this architecture fulfills all functional requirements, the OTel Collector is limited in its ability to provide comprehensive visibility into its health and performance.
Edge Delta’s agents are a powerful alternative to the OTel Collector, matching its functionality while providing a full fleet-management experience. Just as the OTel Collector does, our lightweight agents can deploy directly within your environment at the edge or live as a standalone cloud layer, and ingest OTel-formatted data via OTLP. Additionally, our agents support OTel out of the box, as they can automatically convert non-OTel-formatted data into the OTel schema upon ingestion — an effective no-code solution for data standardization.
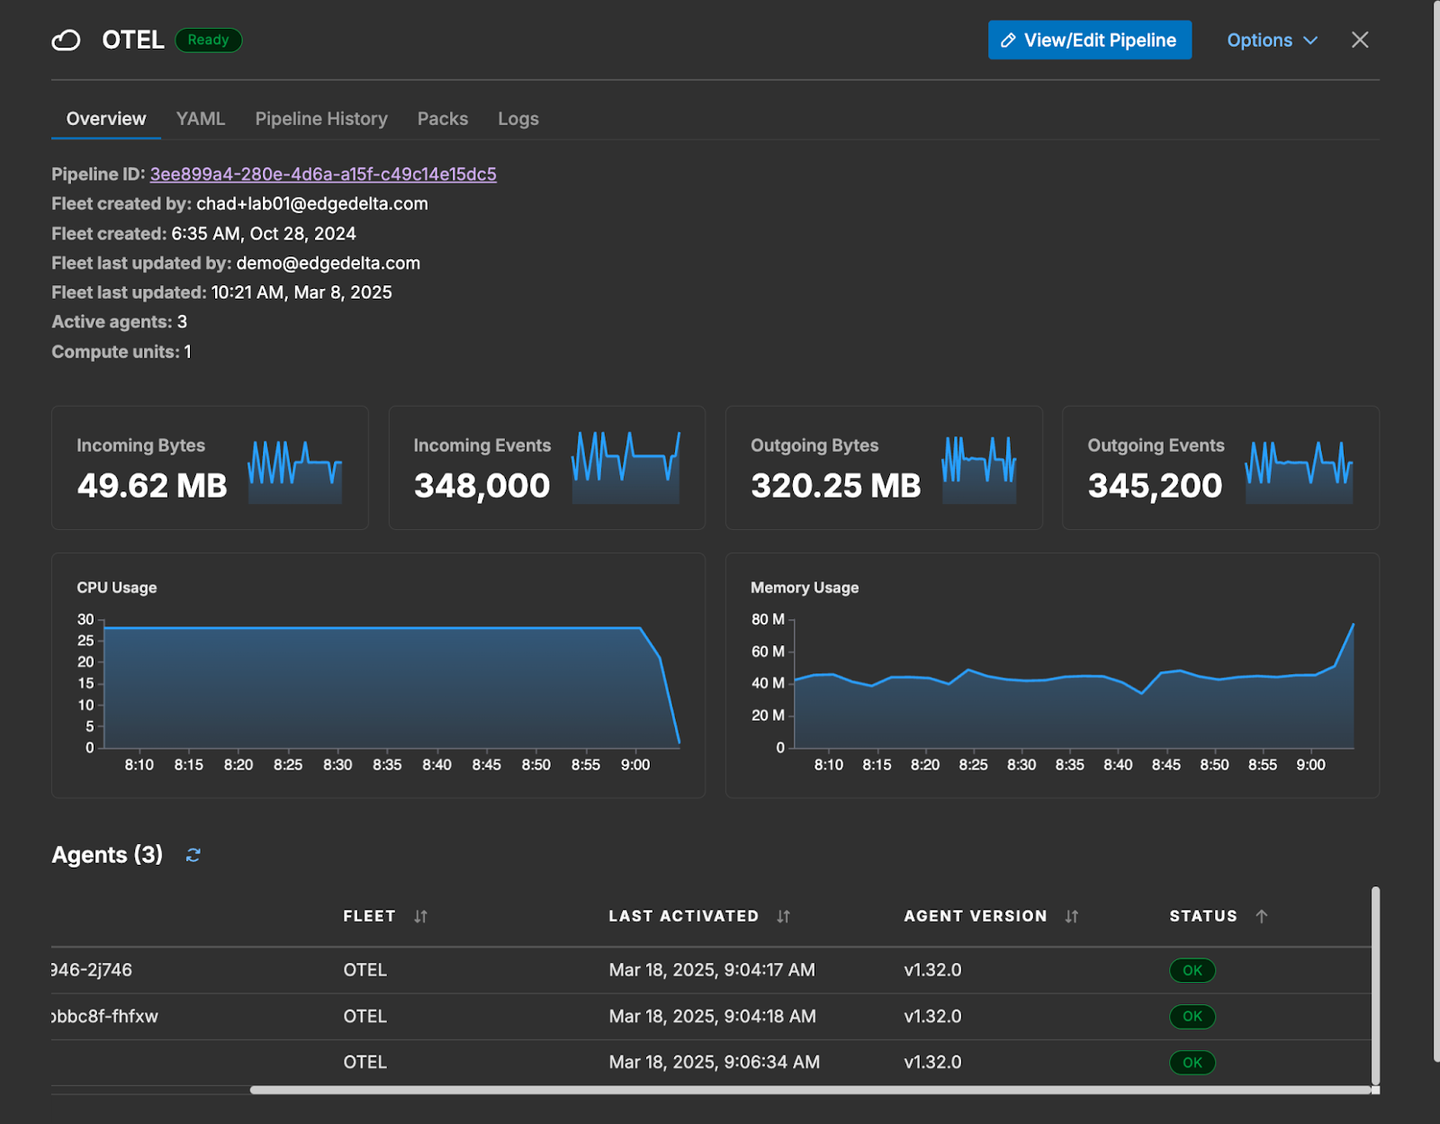
With our agents, we can also easily view the health of each agent within the fleet:
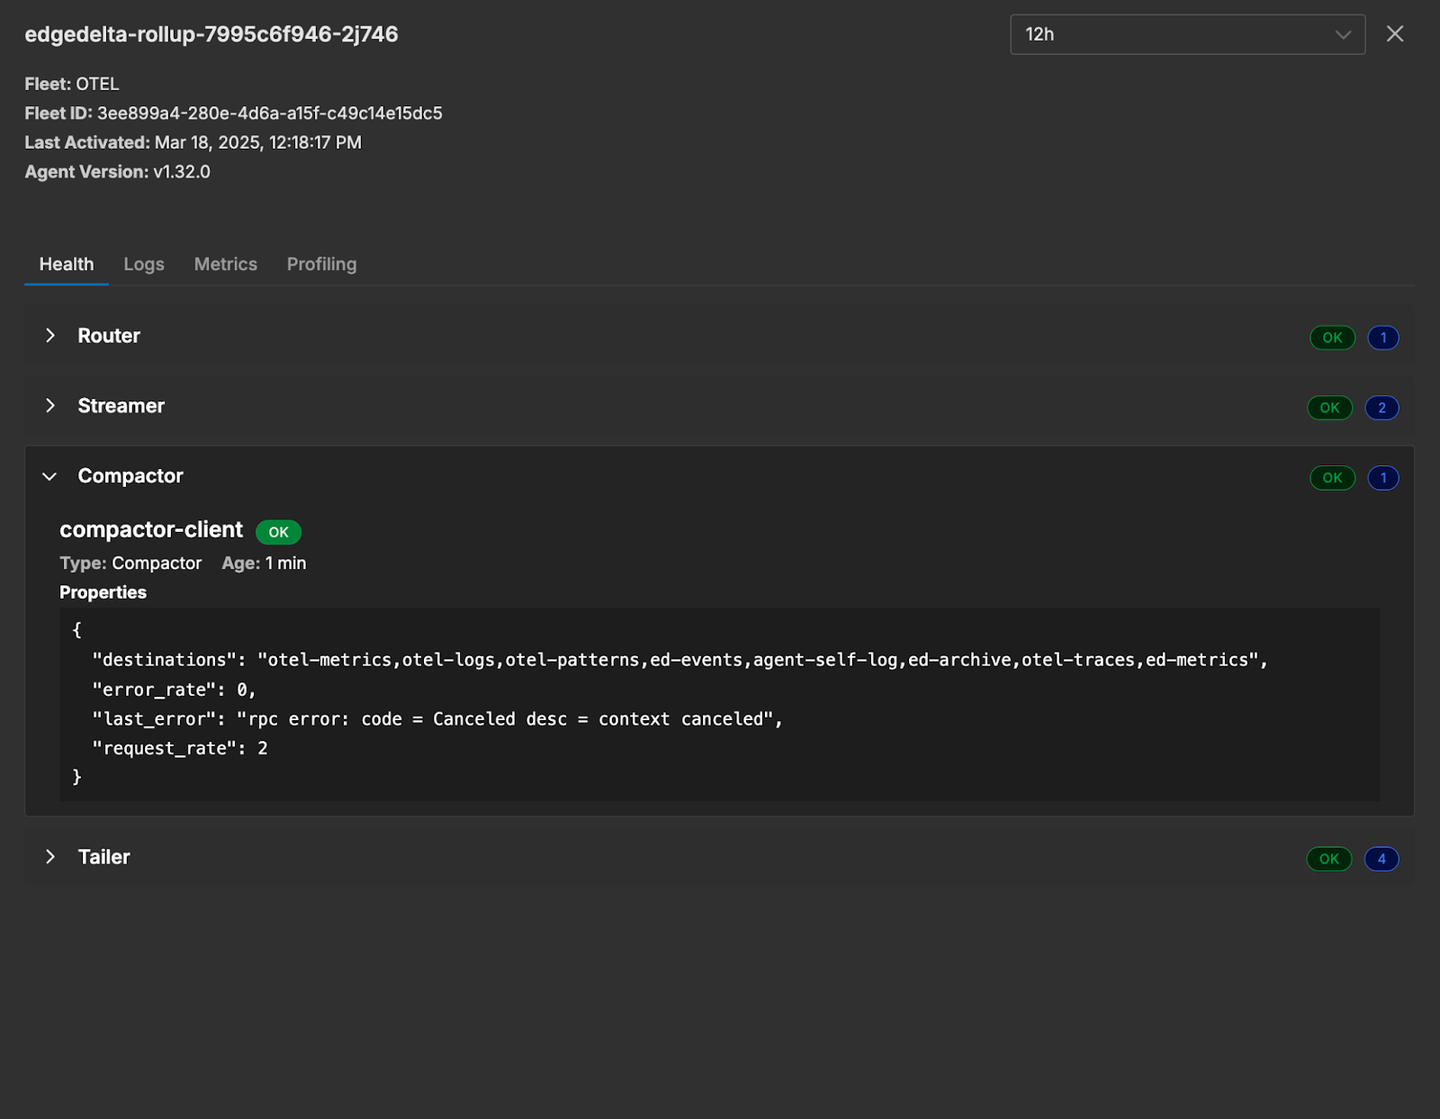
We can then quickly identify agent-level issues if they arise:
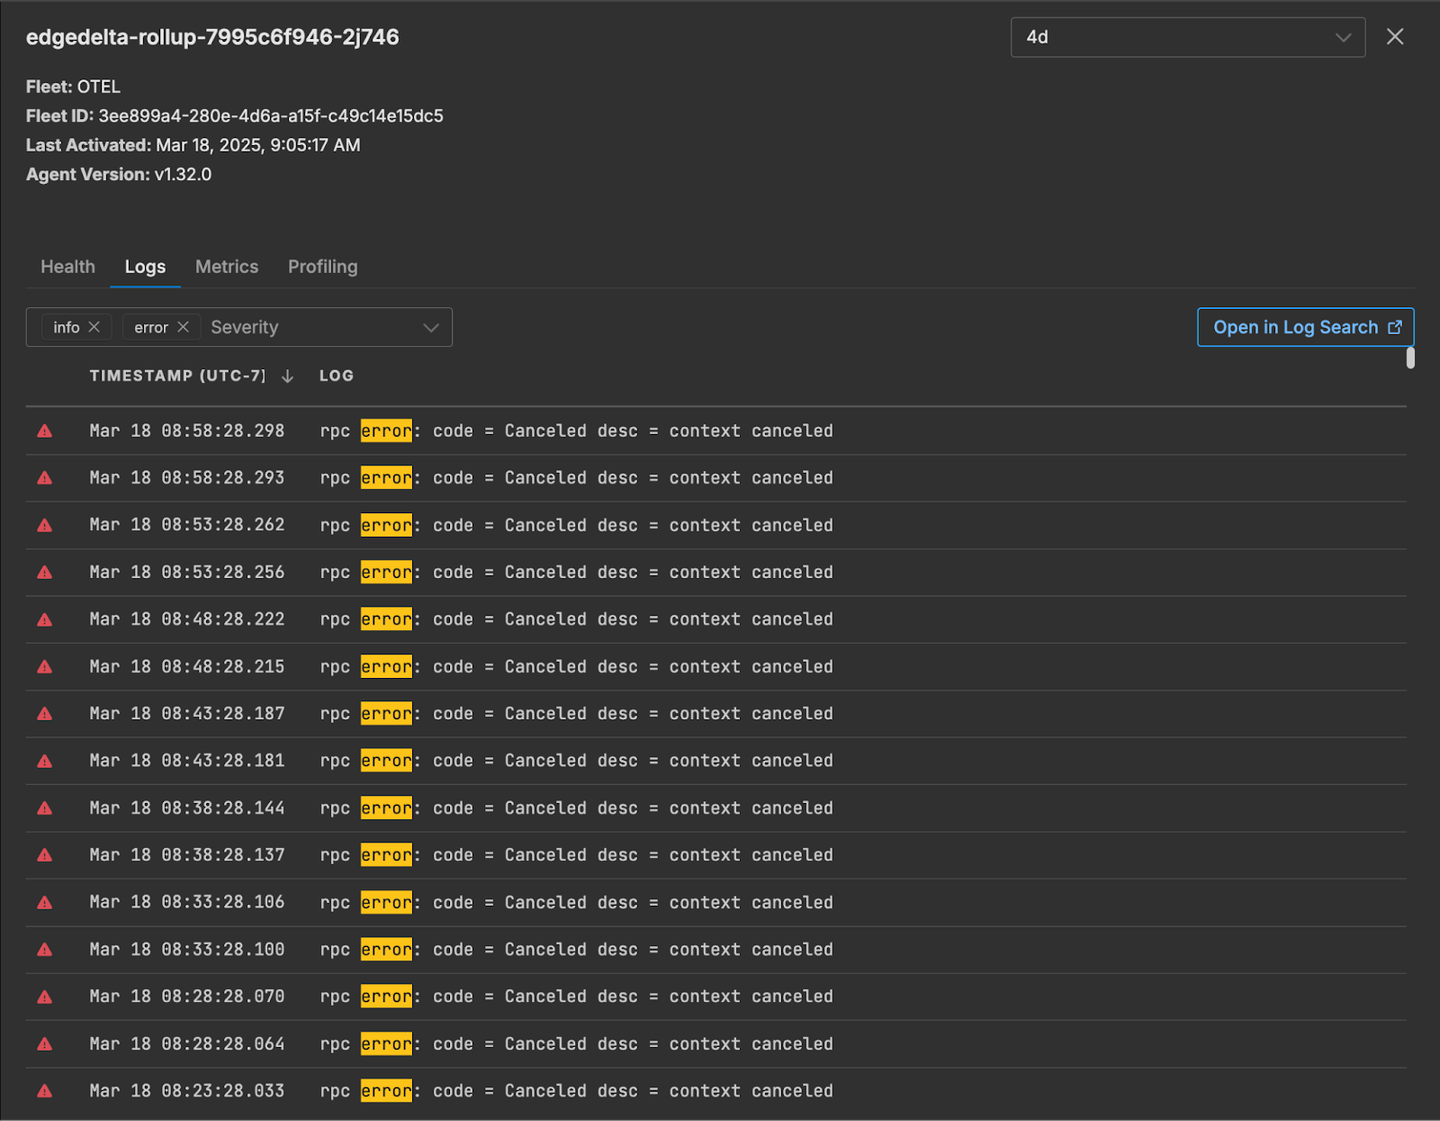
And can troubleshoot any issues through agent logs and metrics whenever an error occurs:
Conclusion
The OpenTelemetry Collector offers an open-source approach to help Observability teams:
- Collect log, metric, and trace data
- Unify their telemetry data into one common format
- Ship data to downstream destinations for further analysis
However, it isn’t designed to provide a full suite of pre-processing capabilities, and there are no built-in tools to help properly manage or utilize the data upstream. Additionally, teams can expect to face a number of issues regarding resource inefficiencies and limits, and continued maintenance costs.
Edge Delta’s lightweight and scalable agents provide an easy-to-use solution for collecting, processing, and routing telemetry data. By supporting data ingestion via OTLP, our agents can easily collect data forwarded by the OTel Collector, or even collect data directly from the OTel-instrumented codebase.
Edge Delta provides teams with end-to-end control and visibility over all their telemetry data and enables augmented processing functionality, performance improvements, and data visibility, which greatly strengthens observability posture and reduces management overhead.
If this sounds like something you’re interested in, start a free trial or learn more about our product in our free playground environment.


