

Apache log analyzers are essential tools for web server management, designed to parse and analyze the extensive logs Apache servers generate. By converting raw log data into actionable insights, log analyzers help administrators understand server performance and user behavior, and quickly identify potential security issues.
By providing detailed reports and visualizations, Apache log analyzers play a crucial role in maintaining the health and efficiency of web servers. They help administrators quickly identify and fix issues like:
Want Faster, Safer, More Actionable Root Cause Analysis?
With Edge Delta’s out-of-the-box AI agent for SRE, teams get clearer context on the alerts that matter and more confidence in the overall health and performance of their apps.
Learn More- Server errors
- Slow response time
- Unauthorized access attempts
Log analyzers help optimize performance, ensuring resources are used efficiently, and any potential bottlenecks are addressed promptly.
There are a number of apache log analyzers on the market, and given the critical role of log analyzers in managing Apache web servers, selecting the right tool is paramount. Each analyzer has its own features, advantages, and limitations:; This article compares the top Apache log analyzers and their pros and cons to help you choose one for your web server management needs.
|
Key Takeaways:
|
Understanding Apache Log Analyzers
Apache log analyzers are specialized tools for processing and analyzing log files generated by Apache web servers. These tools assist system administrators and developers in:
- Understanding server performance
- Detecting errors
- Optimizing website functionality
These log analyzers provide valuable insights into traffic patterns, resource usage, and error rates by parsing, filtering, and visualizing log data. These insights are crucial for maintaining server health and ensuring optimal performance.
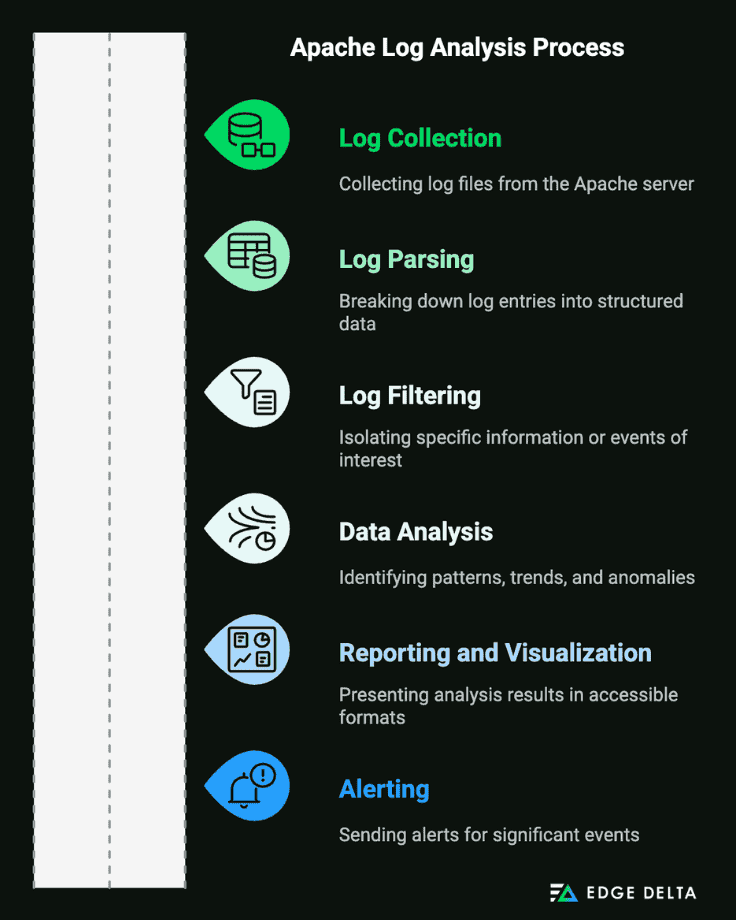
The Apache log analyzers work by following a series of steps to transform raw log data into meaningful information:
- Log Collection: The log analyzer collects log files from the Apache server. These files typically contain records of server requests, including client IP addresses, request methods, requested resources, timestamps, and status codes.
- Log Parsing: The collected log data is parsed to extract relevant information. Log parsing involves breaking down log entries into structured data fields, such as date, time, request type, and response status.
- Log Filtering: Parsed logs are filtered to isolate specific information or events of interest. Filters can be applied to focus on errors, specific user activities, or particular time frames.
- Data Analysis: The filtered data is analyzed to identify patterns, trends, and anomalies. This analysis can reveal insights into server performance, user behavior, and potential security issues.
- Reporting and Visualization: The analysis results are presented in reports and visualizations, such as charts and graphs, to make the data more accessible and actionable.
- Alerting: Based on predefined criteria, the log analyzer can send alerts to notify administrators of significant events, such as spikes in error rates or unusual traffic patterns.
Here is a simple diagram illustrating the basic workflow of an Apache log analyzer:
Apache log analyzers come with various features designed to enhance log management and analysis. Some common features include:
|
Feature |
Description |
|
Real-time Monitoring |
Tracks server activity in real-time |
|
Report Generation |
Creates detailed reports on server performance |
|
Alerting |
Sends notifications based on predefined criteria |
|
Visualization Tools |
Graphs and charts to display log data |
|
Log Filtering and Parsing |
Filters and parses logs for relevant information |
- Real-time Monitoring
Real-time monitoring allows administrators to watch server activity as it happens. This feature helps detect and fix issues immediately, reducing downtime and user impact.
- Report Generation
Report generation creates detailed reports on server performance, including metrics like request counts, error rates, and response times. These reports help understand trends, identify problems, and plan for future needs.
- Alerting
Alerting lets administrators set up notifications for critical events. This feature helps in proactive management by alerting on error spikes, security breaches, and unusual traffic, enabling a quick response to issues.
- Visualization Tools
Log data visualization tools create charts and graphs to explain trends and patterns. These visual aids support better decision-making and faster troubleshooting.
- Log Filtering and Parsing
Log filtering and parsing allow the extraction of specific information from logs. Filtering isolates relevant data, while parsing breaks down log entries into structured fields, aiding in detailed analysis and problem-solving.
Top Apache Log Analyzers
Apache log analyzers help you understand your web server traffic. Here’s a quick look at some popular ones, along with their pros and cons.
| Log Analyzer | Pros | Cons |
|---|---|---|
| AWStats |
|
|
| GoAccess |
|
|
| Webalizer |
|
|
| Sumo Logic |
|
|
Keep reading to learn more about the top Apache log analyzers. Learn about their key features, benefits, and drawbacks so you can decide which tool is best for you.
AWStats
AWStats, short for Advanced Web Statistics, is a powerful and free web server log analyzer that provides a wealth of information about web server activity. This versatile tool can analyze server log files and offer insights into web traffic and server performance. It’s designed to work with various server tools, including Apache log files in NCSA or any common log format.
Features of AWStats
- GeoIP Detection: AWStats can detect and report the countries of hosts, offering valuable insights into the audience’s geographic distribution.
- Search Engine and Keyword Reporting: It tracks search engines and keywords used by visitors, making it a valuable tool for SEO analysis.
- Support for Various Log Types: AWStats can analyze logs from web, proxy, WAP, mail servers, streaming servers, and some FTP servers, streamlining the analysis process across different services.
- Detailed Reporting: It provides comprehensive statistics on visits, visit durations, HTTP errors, peak usage times, robots, referring search engines, and origin countries, among others.
- Real-Time Updates: The tool processes log files quickly, offering real-time statistics that help in monitoring and managing server performance effectively.
Pros:
- Easy Configuration and Use: AWStats is straightforward to set up and run, and it provides excellent support for Apache logs.
- Comprehensive Visualizations: It offers a wide range of visualizations, including visitor counts, visit durations, HTTP errors, peak usage times, robots, search engine referrals, and geographic origins.
- Low Resource Usage: AWStats operates with minimal resource consumption.
- Versatile Log Format Support: It supports various log formats from different components of the infrastructure, including web servers like NGINX and FTP server log files.
- Security Features: AWStats includes protection against cross-site scripting attacks and provides helpful tooltips on HTML report pages.
Cons:
- No Built-In Alerting: AWStats lacks out-of-the-box support for alerting mechanisms.
- Dated Interface: Compared to modern tools like the ELK stack, AWStats may appear outdated in terms of interface and functionalities.
|
Pros |
Cons |
|
Easy to configure and run |
No built-in alerting |
|
Comprehensive visualizations |
Interface may seem dated compared to modern tools |
|
Low resource usage |
|
|
Supports various log formats |
|
|
Protection against cross-site scripting attacks |
GoAccess
GoAccess is an open-source tool for real-time web log analysis that visually represents server logs. It helps system administrators monitor and understand web traffic and performance quickly and easily. GoAccess supports various web log formats, including:
- Apache
- NGINX
- Amazon S3
- CloudFront
- Elastic Load Balancing
It can be used in the terminal or through real-time HTML reports, offering flexibility for different user preferences.
Key Features
- Incremental Log Processing: Ensures data persistence and helps manage large log data over time.
- Real-Time Analysis: Provides instant monitoring of web server performance and traffic.
- Wide Log Format Support: Compatible with various web log formats like Apache, NGINX, Amazon S3, CloudFront, and Elastic Load Balancing.
- Customizable HTML Outputs: Generates colorful and interactive HTML reports, along with options for JSON and CSV reports.
- Terminal-Based Interface: Offers a terminal dashboard for real-time log analysis.
Pros
- Minimal Configuration: Easy to set up and use.
- Real-Time Operation: Allows immediate visibility into web server logs.
- Efficiency: Lightweight and fast, handling large volumes of log data effectively.
- Multiple Interfaces: Provides both terminal and HTML report options.
- Open-Source: Free to use without licensing costs.
Cons
- Centralized Log Management: Requires centralized logs for visualizing data from multiple instances, which adds management tasks.
- Limited Historical Data: Primarily designed for real-time analysis, with some limitations on long-term data storage.
- Learning Curve: Command-line interface can be complex for beginners.
- Scalability: May struggle with very large datasets due to in-memory storage limitations, affecting high-traffic environments.
|
Pros |
Cons |
|
Easy and fast to set up |
Limited historical data storage |
|
Real-time log analysis |
Command-line interface can be complex for beginners |
|
Interactive and customizable reports |
Requires centralizing logs for multiple instances |
|
Lightweight and efficient |
Fewer visualization options compared to other tools |
|
Free and open-source |
In-memory storage may not be scalable |
|
No reliance on cookies or JavaScript trackers |
Focuses primarily on web logs |
Webalizer
Webalizer is a web server log analysis tool widely used by Linux and Unix administrators to analyze Apache web server logs. It processes Apache log files to generate detailed reports on website usage, visitor behavior, and resource access. As a command-line utility, Webalizer is known for its simplicity, efficiency, and ability to integrate into automated scripts and scheduled tasks.
Key Features
- Command Line Operability: Webalizer operates entirely from the command line, making it suitable for integration into automated scripts and scheduled tasks.
- Configurable Parsing: It features a small configuration language that allows customization of how logs are read and parsed, such as ignoring internal traffic with the IgnoreSite option.
- Fast Processing: Known for its fast processing speed, Webalizer can handle large Apache log files quickly, making it efficient for daily log analysis.
- Minimal Resource Usage: It is lightweight and requires minimal system resources, making it ideal for environments with limited computational capacity.
- IPv4 and IPv6 Support: Webalizer supports both IPv4 and IPv6 addresses, and includes built-in distributed DNS lookup capabilities, and native Geolocation services, making it versatile for modern networking environments.
Pros
- Simple and Easy to Use: Webalizer’s straightforward command-line interface makes it accessible to users familiar with Linux/Unix systems.
- Fast Processing of Log Files: It quickly processes large Apache log files, providing timely insights.
- Minimal Resource Usage: The tool is lightweight, ensuring it does not consume significant system resources.
- Unlimited Log File Sizes: Webalizer can handle very large log files without issues, making it suitable for high-traffic websites.
- Supports Log Rotation: It eliminates the need to maintain huge monthly log files, allowing logs to be rotated as needed.
Cons
- Basic Reporting Features: Webalizer provides only basic reporting capabilities, lacking advanced analytics features.
- Outdated Interface: The user interface is considered outdated compared to modern web analytics tools.
- Limited Customization: There are constraints on how much users can customize the reports and analysis.
- Lack of Advanced Features: It does not offer many of the advanced features found in newer log analysis tools.
- No Real-Time Analytics: Webalizer does not support real-time analytics, limiting its utility for immediate insights.
|
Pros |
Cons |
|
Simple and easy to use |
Basic reporting features |
|
Fast processing of log files |
Outdated interface |
|
Minimal resource usage |
Limited customization |
|
Unlimited log file sizes |
Lack of advanced features |
|
Supports log rotation |
No real-time analytics |
Sumo Logic
Sumo Logic is a log management and analytics solution designed to provide real-time insights into applications and systems. By combining logs and metrics into a single platform, it enables users to monitor performance, detect issues, and gain actionable insights.
This tool processes over 100 petabytes of data per day using predictive algorithms and machine learning. Its user-friendly interface and search language allow users to execute advanced operations, extract critical values and metrics, and identify important messages. Sumo Logic’s LogReduce algorithms also help users understand infrastructure trends by converting large log lines into digestible patterns.
Key Features:
- Cloud-Based Scalability: Sumo Logic’s cloud-native architecture scales without on-premises infrastructure.
- Advanced Analytics and Machine Learning: Sumo Logic analyzes large amounts of data using indexing, filtering, and ML algorithms.
- Real-Time Insights: The platform provides real-time insights into applications and systems by combining logs and metrics, allowing users to monitor performance and detect issues promptly.
- Integration with Various Platforms: Sumo Logic integrates seamlessly with numerous platforms and services, including AWS, Azure, Google Cloud, and many others, enabling comprehensive monitoring and analysis.
- User-Friendly Interface: The intuitive design and visualization tools, including easily readable charts and graphs, enable swift recognition of trends, patterns, and anomalies in the data.
Pros:
- Cloud-Based and Scalable: Sumo Logic’s cloud-native architecture ensures scalability and eliminates the need for on-premises infrastructure.
- Advanced Analytics and Machine Learning: Leverages indexing, filtering, and machine learning to process and analyze large data volumes.
- Integration with Various Platforms: Seamlessly integrates with numerous platforms and services, offering comprehensive monitoring and analysis.
- Provides Comprehensive Monitoring for CI/CD Pipelines: Offers actionable insights for continuous integration and continuous deployment (CI/CD) processes.
- Easy-to-Read Charts and Graphs: The intuitive interface and visualization tools facilitate quick identification of trends, patterns, and anomalies.
Cons:
- Can Be Expensive for Large Volumes: The cost can become significant when dealing with large volumes of data.
- Learning Curve for Complex Features: Users may face a steep learning curve when utilizing advanced features and complex configurations.
- Requires Internet Connection: Being a cloud-based service, it requires a reliable internet connection for optimal performance.
- Experiences Latency and Performance Problems: Users may occasionally encounter latency and performance issues, especially during peak times.
- Lacks Smart AI Capabilities: Missing some advanced AI capabilities found in other enterprise-grade log analysis tools.
|
Pros |
Cons |
|
Cloud-based and scalable |
Can be expensive for large volumes |
|
Advanced analytics and machine learning |
Learning curve for complex features |
|
Integration with various platforms |
Requires internet connection |
|
Provides comprehensive monitoring for CI/CD |
Experiences latency and performance problems at times |
|
Easy-to-read charts and graphs |
Lacks smart AI capabilities found in enterprise-grade tools |
Comparison of Top Apache Log Analyzers
Apache log analyzers help you understand your web server traffic. Here’s a quick look at some popular ones, along with their pros and cons:
|
Log Analyzer |
Pros |
Cons |
|
AWStats |
Free, Detailed reports, supports multiple formats |
Perl dependency, slow on large files |
|
GoAccess |
Real-time analysis, Interactive reports |
Limited historical data, complex command-line interface |
|
Webalizer |
Simple to use, fast processing, Minimal resource usage |
Basic features, outdated interface |
|
GoLog |
User-friendly, real-time, and historical analysis |
Limited advanced features and maintenance required |
|
Sumo Logic |
Scalable, advanced analytics |
Expensive, complex features, require an internet connection |
Best Practices for Using Apache Log Analyzers
Analyzing Apache logs is crucial for maintaining web applications’ performance, security, and reliability. Proper log analysis helps identify issues, understand user behavior, and optimize server performance.
However, efficiently implementing and optimizing Apache log analyzer tools can be challenging. Read on for Apache log analyzer deployment and use best practices to maximize log data.
Implementing Log Analyzers Efficiently
To deploy and utilize Apache log analyzers effectively, it’s essential to follow strategic best practices. These practices ensure that log analyzers are set up correctly and maintained efficiently, leading to accurate and timely insights.
Here’s a checklist for setting up and maintaining Apache log analyzers:
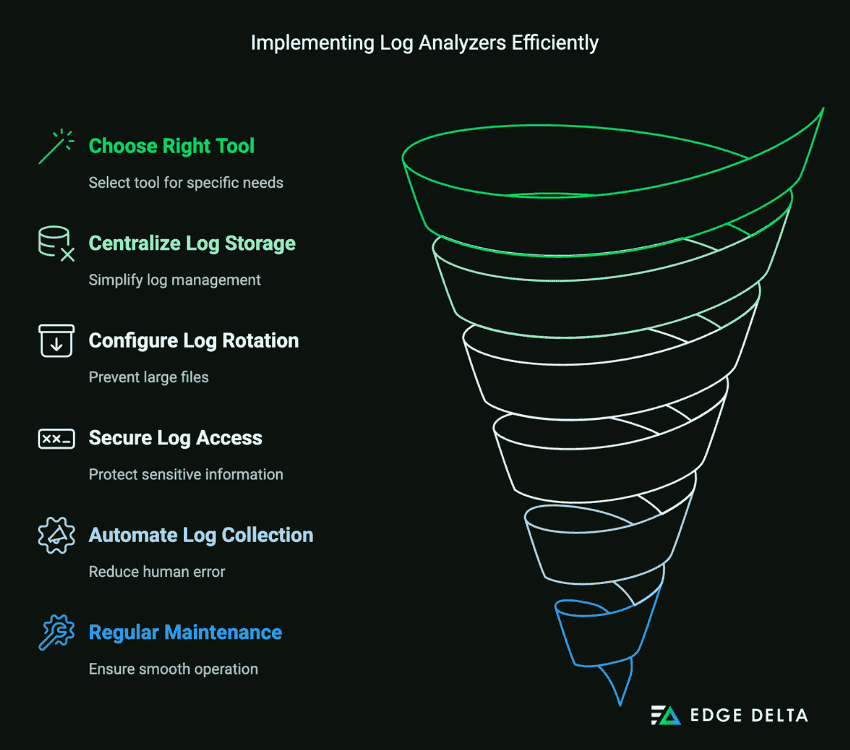
- Choose the Right Tool: Select a log analyzer that fits your specific needs, whether it’s for real-time monitoring, in-depth analysis, or both.
- Centralize Log Storage: Use centralized storage for all logs to simplify management and improve accessibility.
- Configure Log Rotation: Set up log rotation to prevent log files from becoming too large and unmanageable.
- Secure Log Access: Ensure that logs are protected against unauthorized access, as they can contain sensitive information.
- Automate Log Collection: Use automation tools to collect and process logs, reducing the chances of human error.
- Regular Maintenance: To keep your log analysis tools running smoothly, schedule regular maintenance and updates.
Optimizing Log Analysis for Performance
Effective log analysis requires not just the right tools, but also optimized processes. By implementing the following methods, you can ensure that your log analysis is both efficient and accurate.
Here’s a table summarizing performance optimization techniques table:
|
Technique |
Description |
|
Indexing Logs |
Speeds up search and retrieval of log data |
|
Archiving Old Logs |
Reduces load on log analyzer by archiving outdated logs |
|
Load Balancing Analysis |
Distributes log analysis tasks across multiple servers |
- Indexing Logs
Indexing makes it faster to search through large volumes of log data. Implement log indexing using tools like Elasticsearch, which provides powerful search capabilities.
- Archiving Old Logs
Archiving reduces the amount of data the log analyzer needs to process, improving performance. Use tools like AWS Glacier or Azure Blob Storage for long-term storage of old logs.
- Load Balancing Analysis
Distributing the analysis workload prevents any single server from becoming a bottleneck. Set up load balancers to distribute log analysis tasks across multiple servers or instances.
Conclusion
Selecting the right Apache log analyzer depends on your specific needs and environment. Tools like AWStats offer comprehensive log analysis with user-friendly reports but lack real-time alerting capabilities.
Log analyzers offer powerful, scalable log management and analysis but may require more setup and resources. Each tool has its strengths and limitations, making it essential to weigh the pros and cons to find the best fit for your log analysis requirements.
FAQs for Top Apache Log Analyzers – Pros and Cons
What is an Apache log analyzer?
Apache log analyzers are specialized tools designed to help you efficiently search and analyze events within your Apache server log files. They aid in locating, sorting, and accessing log information, making it easier to monitor server performance, troubleshoot issues, and gain insights into web traffic and user behavior.
How to check logs in Apache?
To check Apache logs, navigate to the /var/log directory on your Unix/Linux server. Specifically, you can find the Apache access logs in the following location: /var/log/apache/access.log.
What is Apache log parser?
An Apache log parser is a tool that processes and interprets log files generated by Apache servers. It extracts valuable information from the raw log data, enabling you to analyze server activity, identify patterns, and troubleshoot issues. Apache log parse helps in converting complex log entries into a structured format that is easier to understand and utilize for monitoring and analysis purposes.
What are some of the logs maintained by Apache?
Apache maintains several logs, including the access log (access.log), error log (error.log), and custom logs (Customlog). These logs are essential for monitoring server performance, ensuring security, and troubleshooting issues.
List of Sources: