Building scalable observability platforms that help users maintain environment performance and health requires constant improvements, and often presents unique challenges that push us beyond conventional solutions.
At Edge Delta, we recently encountered an intriguing technical challenge: How do you optimize query performance when data volumes grow to hundreds of terabytes queried per hour, across multiple users, with billions of logs, metrics, and traces involved? And, even more specifically, what if multiple users need to query and analyze that data across several different time windows simultaneously?
This article covers our journey of building an application-layer caching system that reduced query latency by up to 97% — around a 20x improvement compared to other non-Edge Delta off-the-shelf ClickHouse implementations — and transformed our query performance landscape while maintaining data accuracy and system reliability.
The Challenge
Imagine processing hundreds of terabytes of data every hour while supporting concurrent users who are all querying this data across multiple time ranges — from a 15-minute window all the way up to a month-long window. This is a challenging problem to solve, and it’s the reality of a high-throughput observability platform, especially as data volumes grow exponentially and queries increase in complexity.
Our platform relies on ClickHouse — a high-performance, online analytical processing (OLAP) database — which, by default, automatically provides internal query caching to reduce query latency. However, as our system scaled to support increasing numbers of users and data, we identified a significant limitation that ClickHouse’s internal caching mechanisms couldn’t overcome.
Overlapping Time Windows
Users often queried overlapping time ranges with slight variations. Traditional ClickHouse caching treated each unique time window as a separate entity, leading to redundant data processing even when the overlap between queries was substantial.
For example, a query with the “ERROR” search term across the past 24 hours followed by the exact same query run two minutes later were considered two completely separate queries and triggered redundant processing, despite being practically the exact same query. This issue was exacerbated when similar queries were run concurrently. Users running similar queries in quick succession caused spikes in resource utilization and impacted query speed.
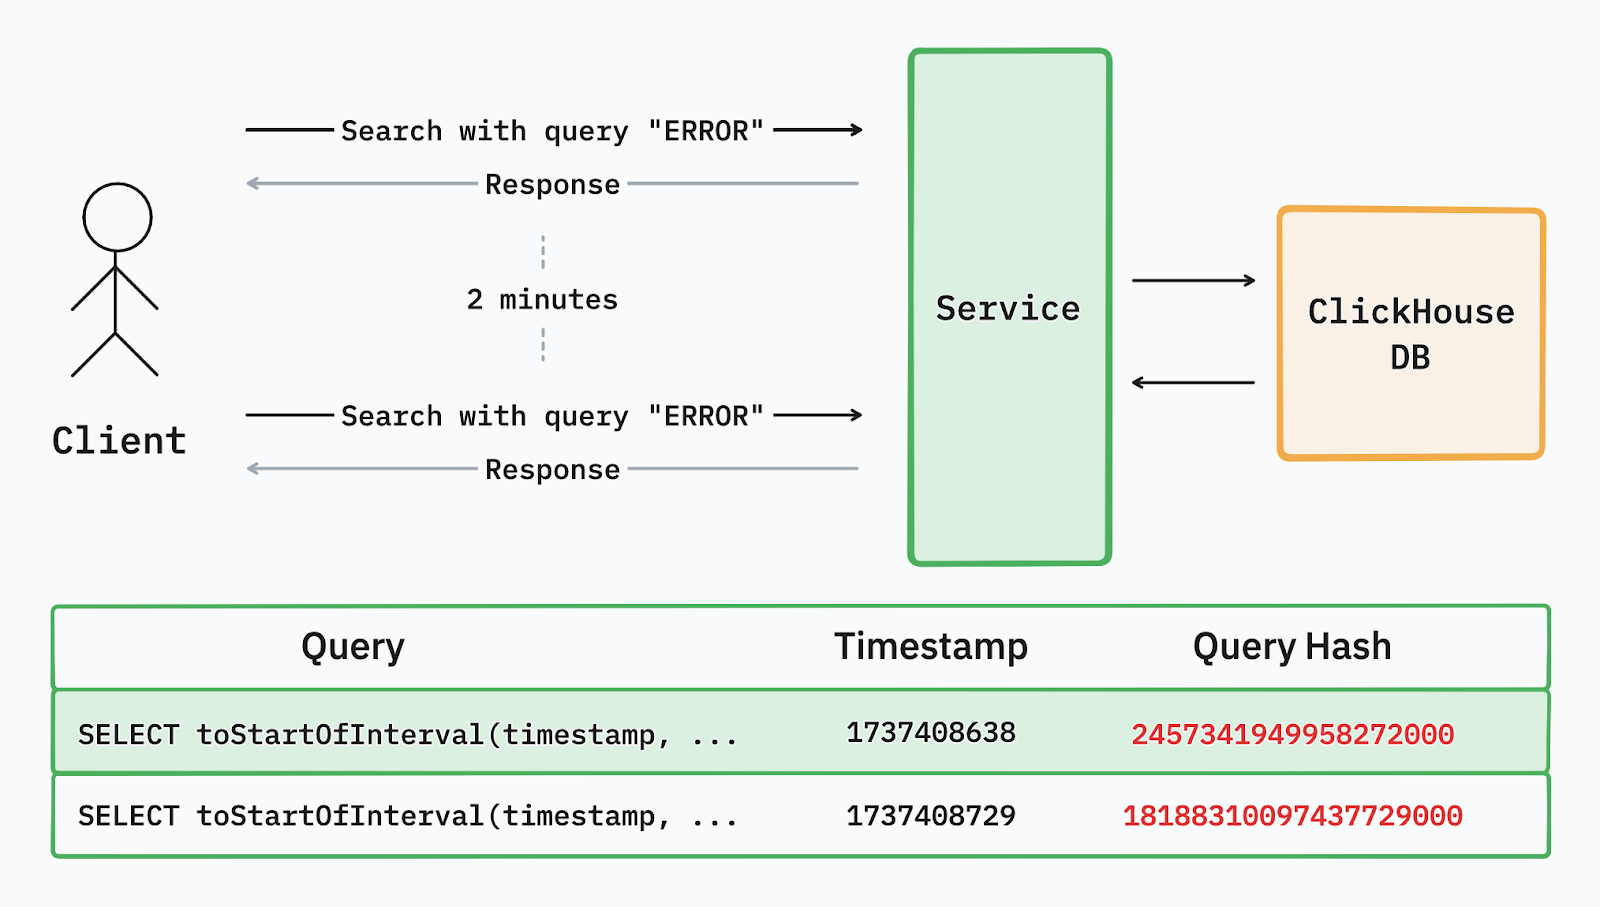
Example of the query cache system table in ClickHouse after two identical queries were run two minutes apart. Despite their similarities, the time offset resulted in two different query hashes
These issues made it clear that we needed to re-think our caching strategy by going beyond ClickHouse’s default offering to reduce latency and ensure full support for our customers’ query needs.
Rethinking Query Caching
To address these challenges we developed an application-layer caching system tailored to our unique query patterns.
Our solution combined:
- query granulation
- alignment mechanisms
- an optimized cache architecture
Each of these contributed to substantial performance gains, in particular for overlapping queries like the ones referred to in the previous section.
Query Windows: Breaking Time into Manageable Chunks
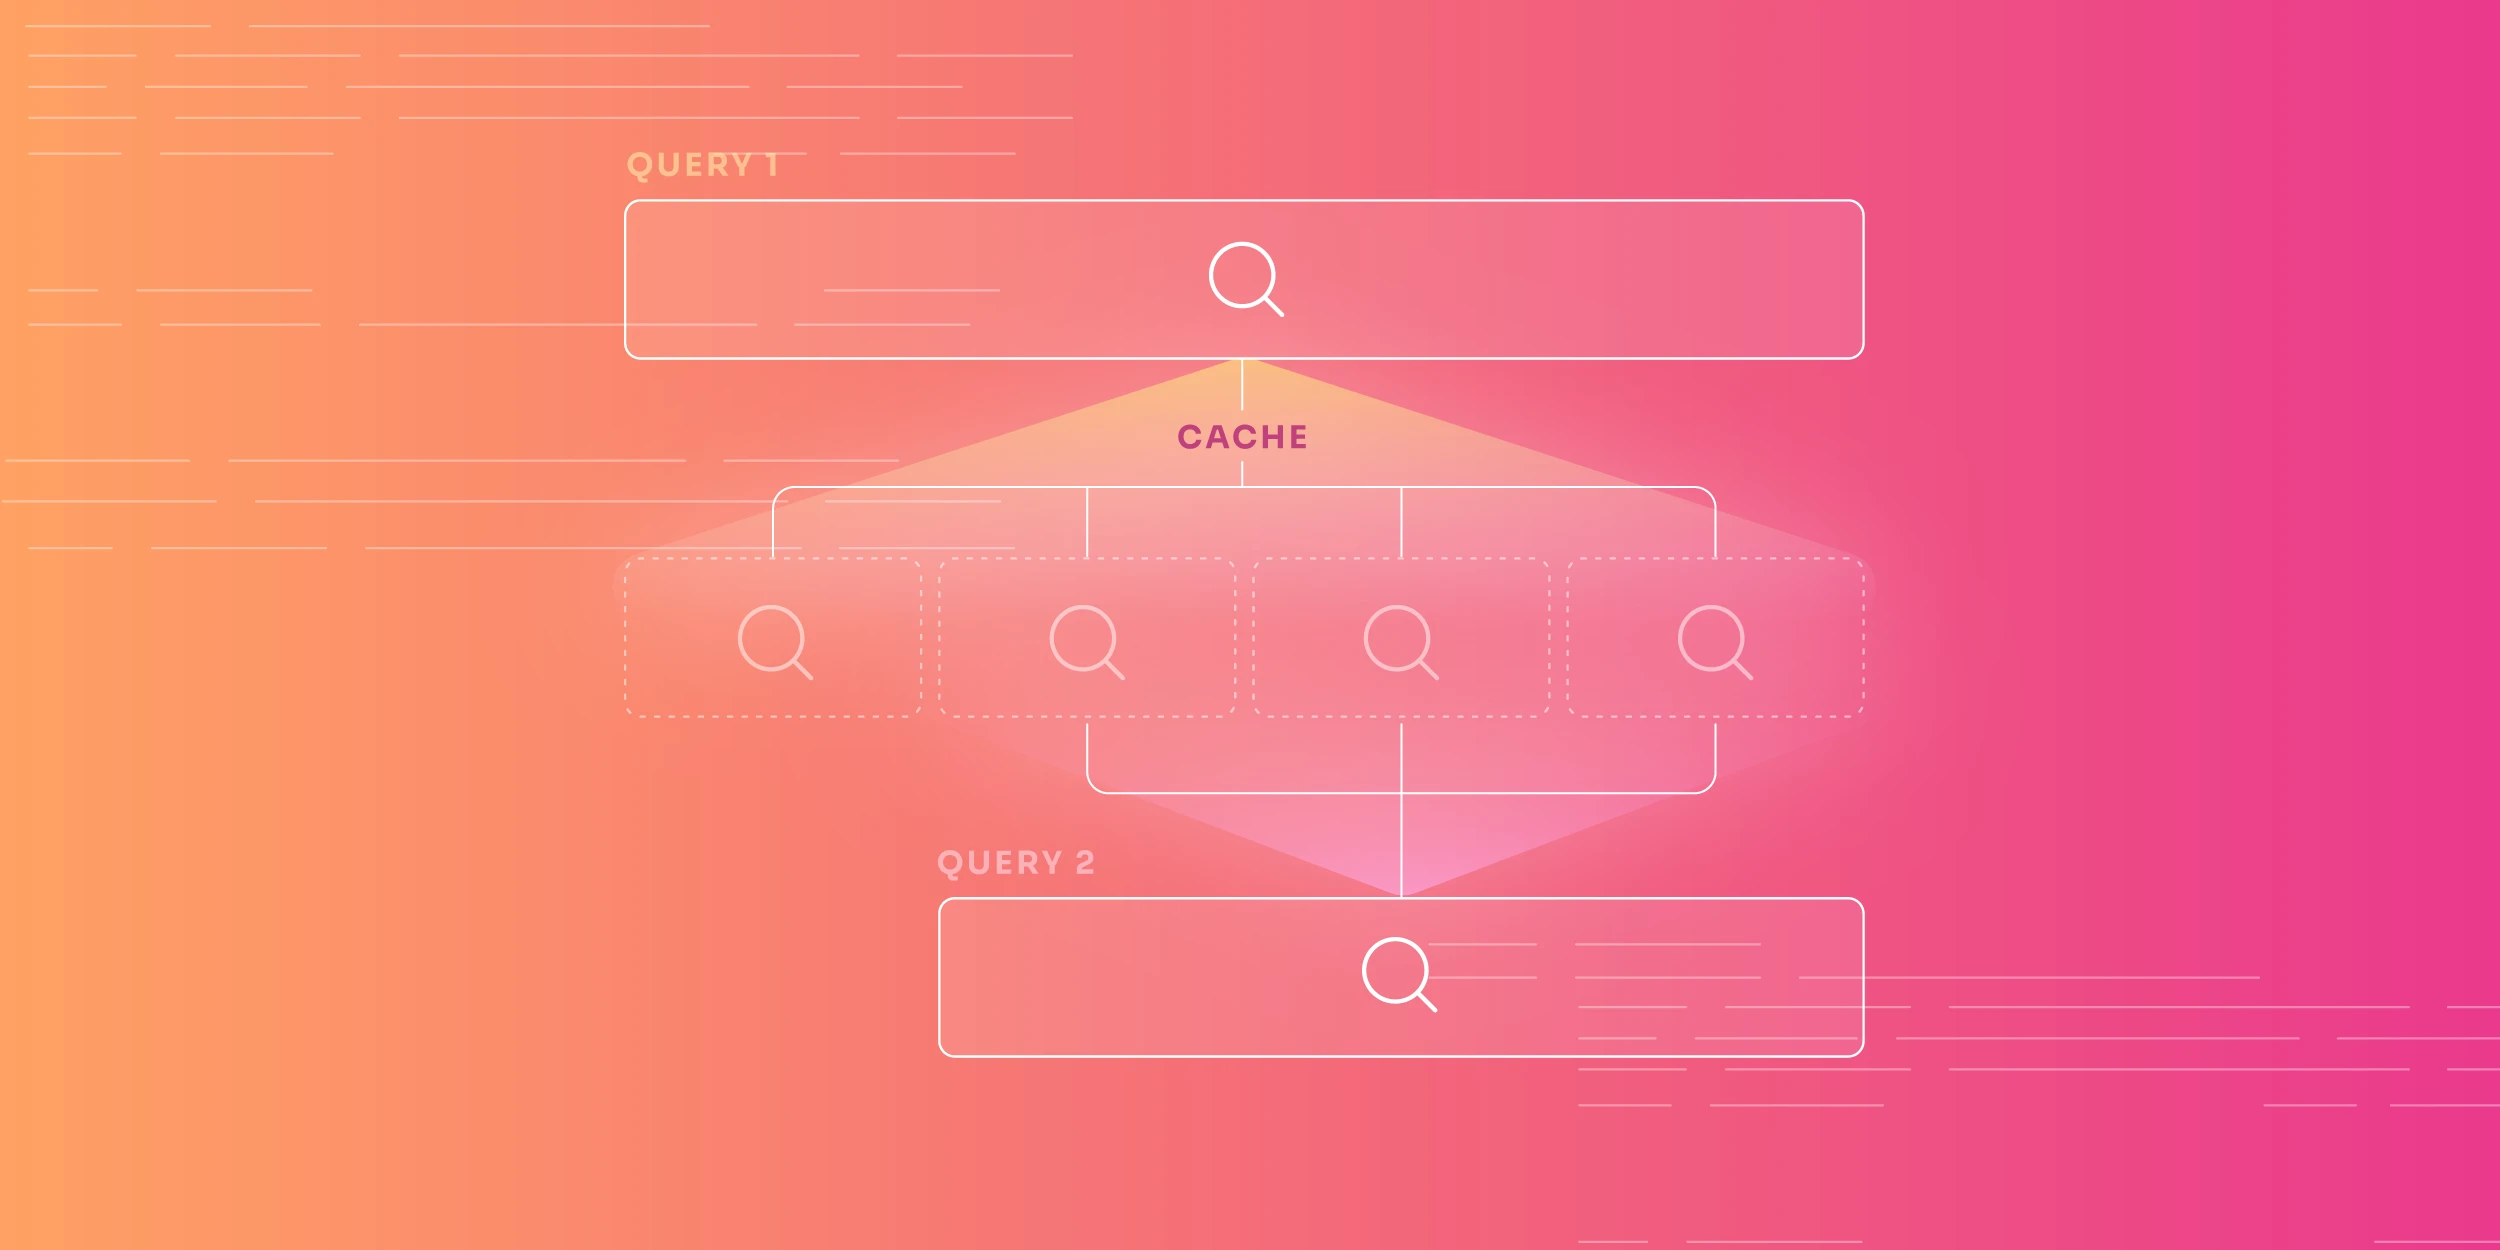
The cornerstone of our approach was automatic time window granulation. Instead of caching entire query results, we divided them into fixed time segments with predefined dynamic durations. This simple approach had profound implications:
- Efficient Storage: Each segment was reusable across multiple queries, which maximized cache utilization.
- Improved Cache Hits: Overlapping queries could share cached segments, which reduced redundant processing.
For instance, a query for “last 24 hours” divided into three-hour segments resulted in eight reusable segments. Any subsequent query for overlapping time ranges reused existing segments, significantly improving cache hit ratios.
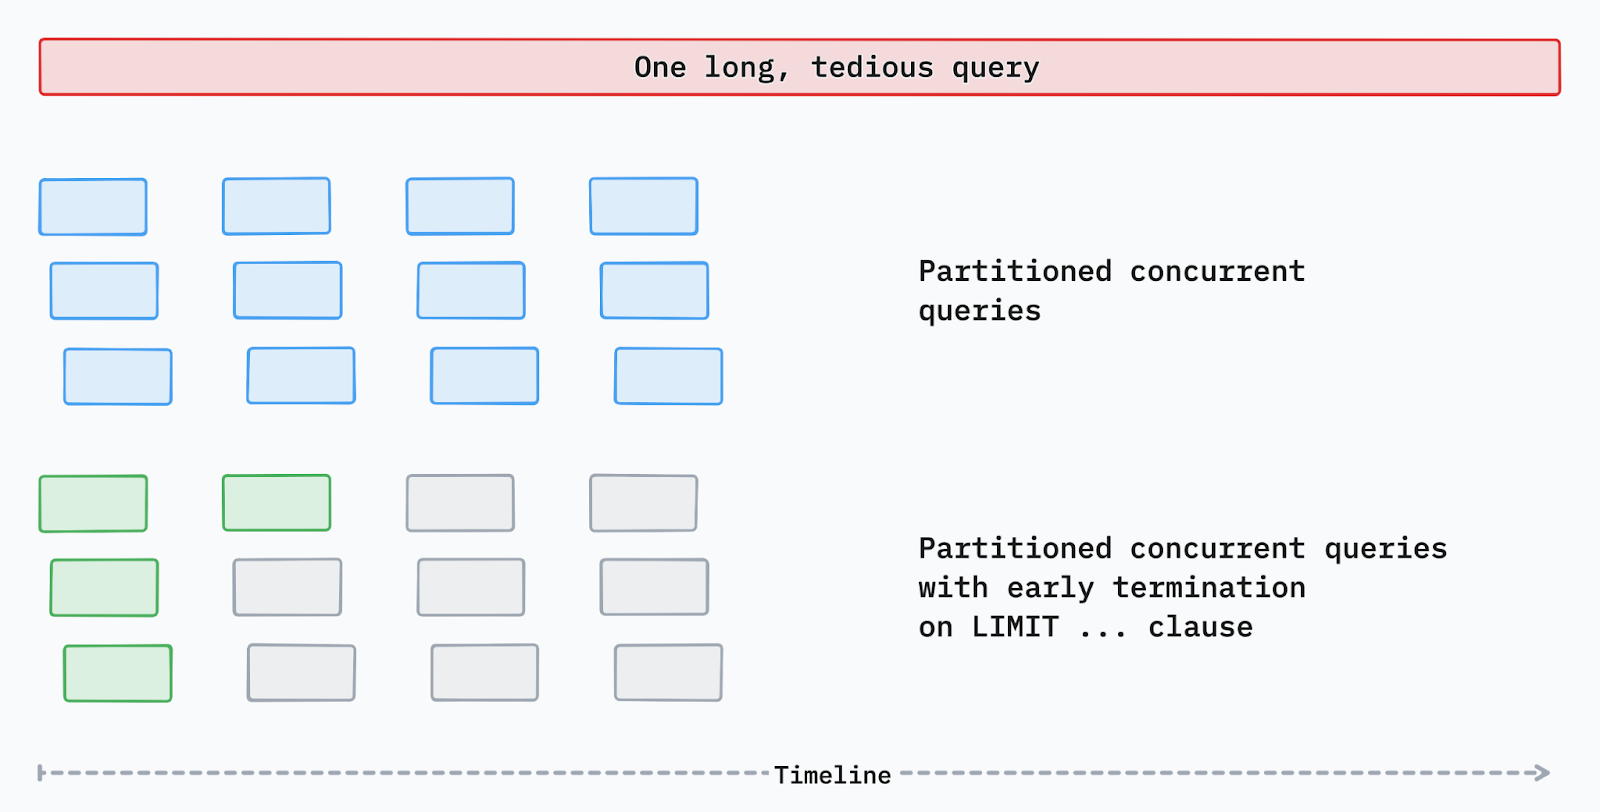
Splitting the same query into multiple sub-queries allowed us to try different cache-efficient strategies, such as concurrent queries, with early termination
Lookback Alignment: Maximizing Cache Efficiency
As mentioned previously, we observed that queries with slight time window shifts caused cache misses.
For example, querying logs from between 1:05 a.m. to 1:05 p.m would not benefit at all from a previously run query with a lookback of between 1:04 a.m. to 1:04 p.m. Our new alignment mechanism now adjusts user-specified time ranges to align with cache boundaries while maintaining accuracy.
This mechanism works by:
- adjusting queries to nearest fixed duration boundaries
- extending queries slightly to ensure full data coverage
- trimming results to match user specifications
The example below depicts the lookback alignment in action. Without aligning the start and end timestamps of query parts, the same query run one minute later would not benefit from the results of the previous query.
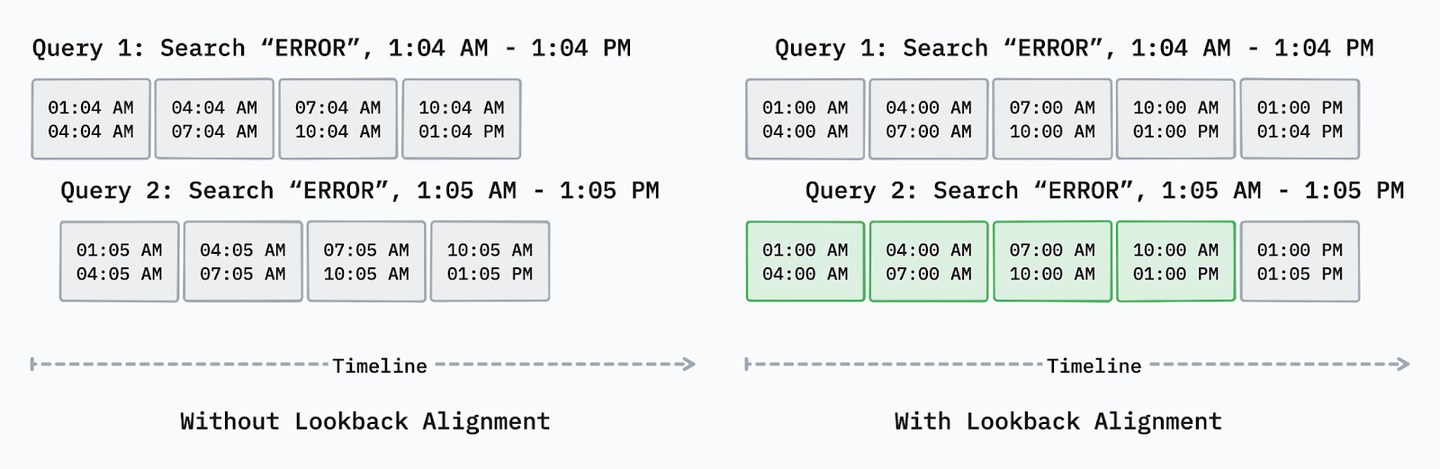
By using a one-hour truncating alignment over three-hour query partitions, we updated the start time of both queries from 1:04 a.m. and 1:05 a.m. to 1:00 a.m., and queried an extra partition for 1:00 p.m. to 1:04 p.m. and 1:00 p.m. to 1:05 p.m. respectively. This adjustment enables the API to get the results of the second query from our cache, reaching to the database only for nine minutes for a 24-hour total lookback.
This is the best case scenario for our lookback alignment strategy. But even for less aligned queries, the updates result in drastic latency improvements. With this strategy we were able to speed up repetitive queries — such as refreshing a complex query with a long lookback period — which normally would consume a significant amount of compute resources when run consecutively.
Benchmark Highlights
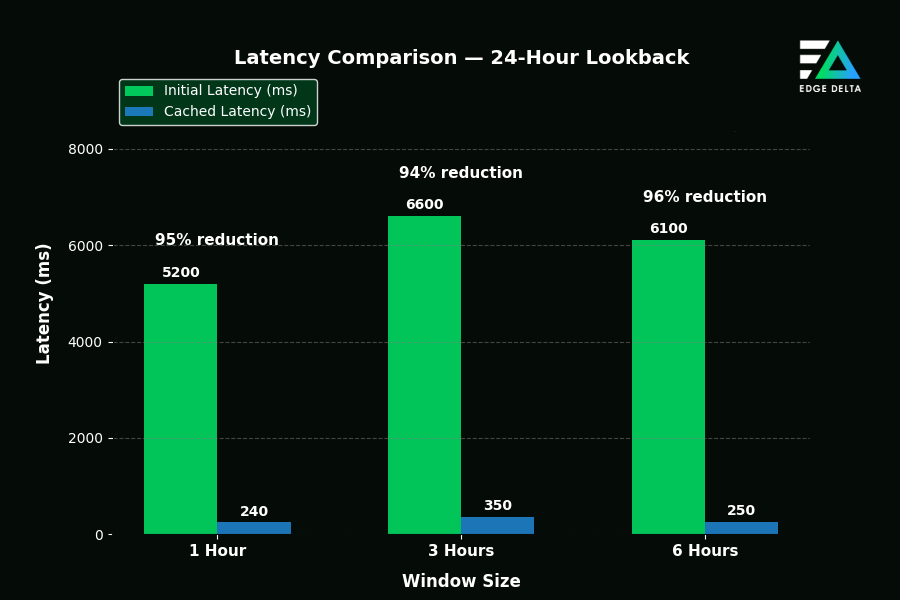
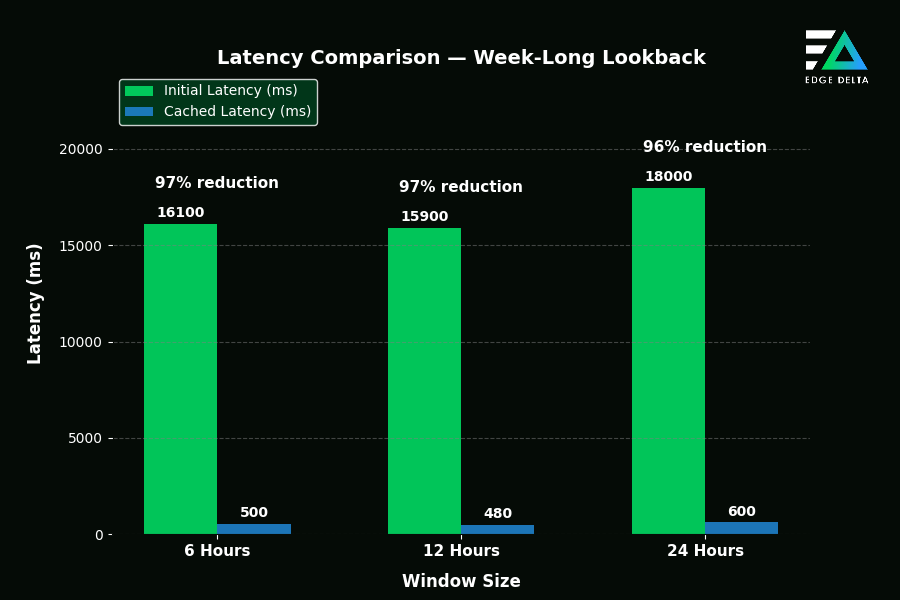
After implementing our application layer cache, we were able to improve our queries for long periods by ~97%, a strong improvement, especially for customers consistently running long and complex queries. The full list of recorded results across both 24-hour and week-long lookbacks are shown below:
Latency Reduction by Window Size
Lessons Learned and Insights
There are a number of interesting lessons learned and insights discovered during the process of implementing the cache. Here are some of the most valuable learnings:
1. Window-Size Trade-Offs
Smaller windows increased cache hits but required additional function calls, which introduced larger overhead. Larger windows reduced overhead but simultaneously decreased cache utilization. Finding the sweet spot required careful testing across workloads to best fit our particular demands.
2. Query Pattern Variability
Rare-term queries benefited most from caching, while popular-term queries required specialized handling to avoid cache thrashing.
3. Early Termination
By returning results as soon as sufficient data was available, we reduced latency by up to 97% for some query types, improving the overall user experience.
Looking Ahead: Future Optimizations
Our caching improvements have laid a strong foundation, but we’re exploring further enhancements:
- Dynamic window adaptation: An intelligent system that adjusts window sizes based on query patterns and system load to dynamically optimize performance.
- Enhanced cache eviction: Sophisticated eviction strategies based on query frequency and data importance to improve memory utilization.
- Pattern-based optimization: Adaptive caching mechanism to identify re-occurring patterns in customer queries (e.g. “error” or “line:*”), query them, and pre-cache them to significantly reduce latency.
Conclusion
By developing an application-layer cache tailored to our specific requirements, we significantly enhanced query performance and achieved an approximate 97% reduction in overall query latency.
This improvement translates to faster response times and a smoother experience for our customers, strengthening monitoring efforts and helping them more swiftly identify and remediate issues.
We’re proud of what we’ve accomplished and look forward to building on these gains for even greater efficiency and user satisfaction.