

Why We Released This Update
Events, a core component of telemetry data, are crucial for understanding the internal state of your systems. They represent distinct actions or changes within a system, describing the behavior of specific scenarios — configuration changes, service restarts, user queries, or API responses, to name a few. Events provide key context around the critical actions happening within your environment, helping you to monitor its overall health and swiftly troubleshoot any issues.
Kubernetes events are a special type of event, emitted only when components running in the Kubernetes infrastructure undergo a change in state. For instance, if a pod status changes from pending to failed, or a networking issue renders a persistent volume inaccessible, a new Kubernetes event is generated. Kubernetes event data — and in particular, ‘warning’ level events — offer high-value signals about the overall state of the cluster and the health of all applications running on it.
The challenge? At scale, Kubernetes environments become massive webs of dynamic components, generating incredibly high volumes of event data. Without the proper tools, it becomes impossible to connect any of it to actionable insights. Additionally, Kubernetes doesn’t support long retention event storage out of the box. Users wishing to analyze historical trends must go through utilities like kubectl or visual Kubernetes tools to access past Kubernetes Event data.
Edge Delta’s Kubernetes Event Explorer is an excellent solution. It is an intuitive, event search interface that enables you to easily filter through, analyze, and visualize your Kubernetes event data. With this new consolidated view, users can seamlessly identify and investigate both current and historical issues, at the cluster and all the way down to the pod level. What’s more, our collection of aggregated views and charting abilities enables you to display event trends and anomalies with ease, no matter the size of your cluster.
What’s New?
Here’s a high-level overview of this release:
- New Kubernetes Events Search Page to easily filter through and analyze cluster and workloads events
- Strong Analysis and Visualization achieved by pairing highly expressive aggregation and visualization abilities with long-term data retention, to understand your Kubernetes cluster from any scope
Let’s explore in detail how it all works:
New Event Search Page
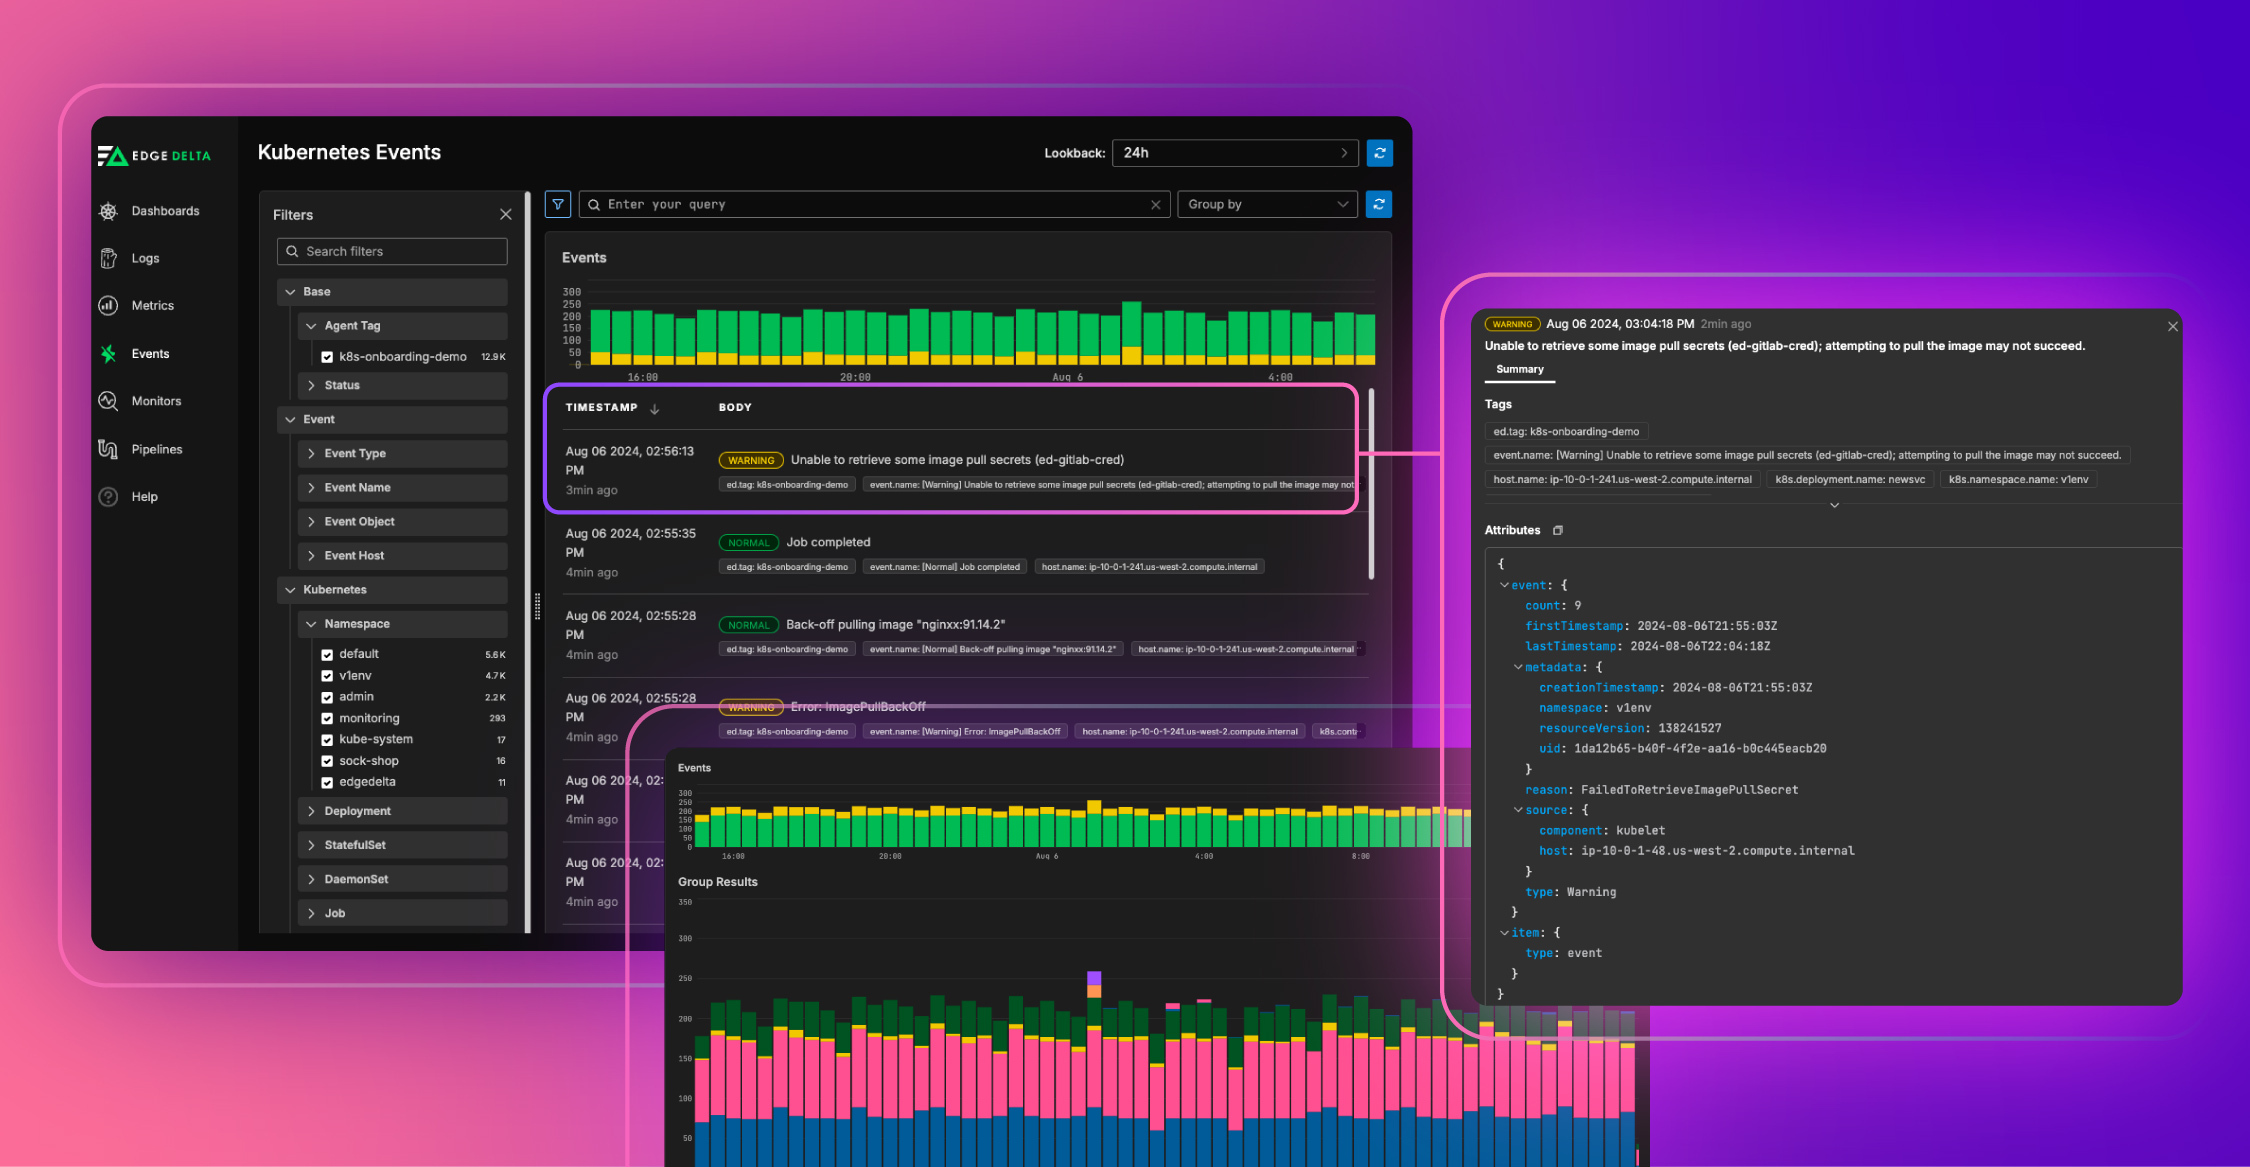
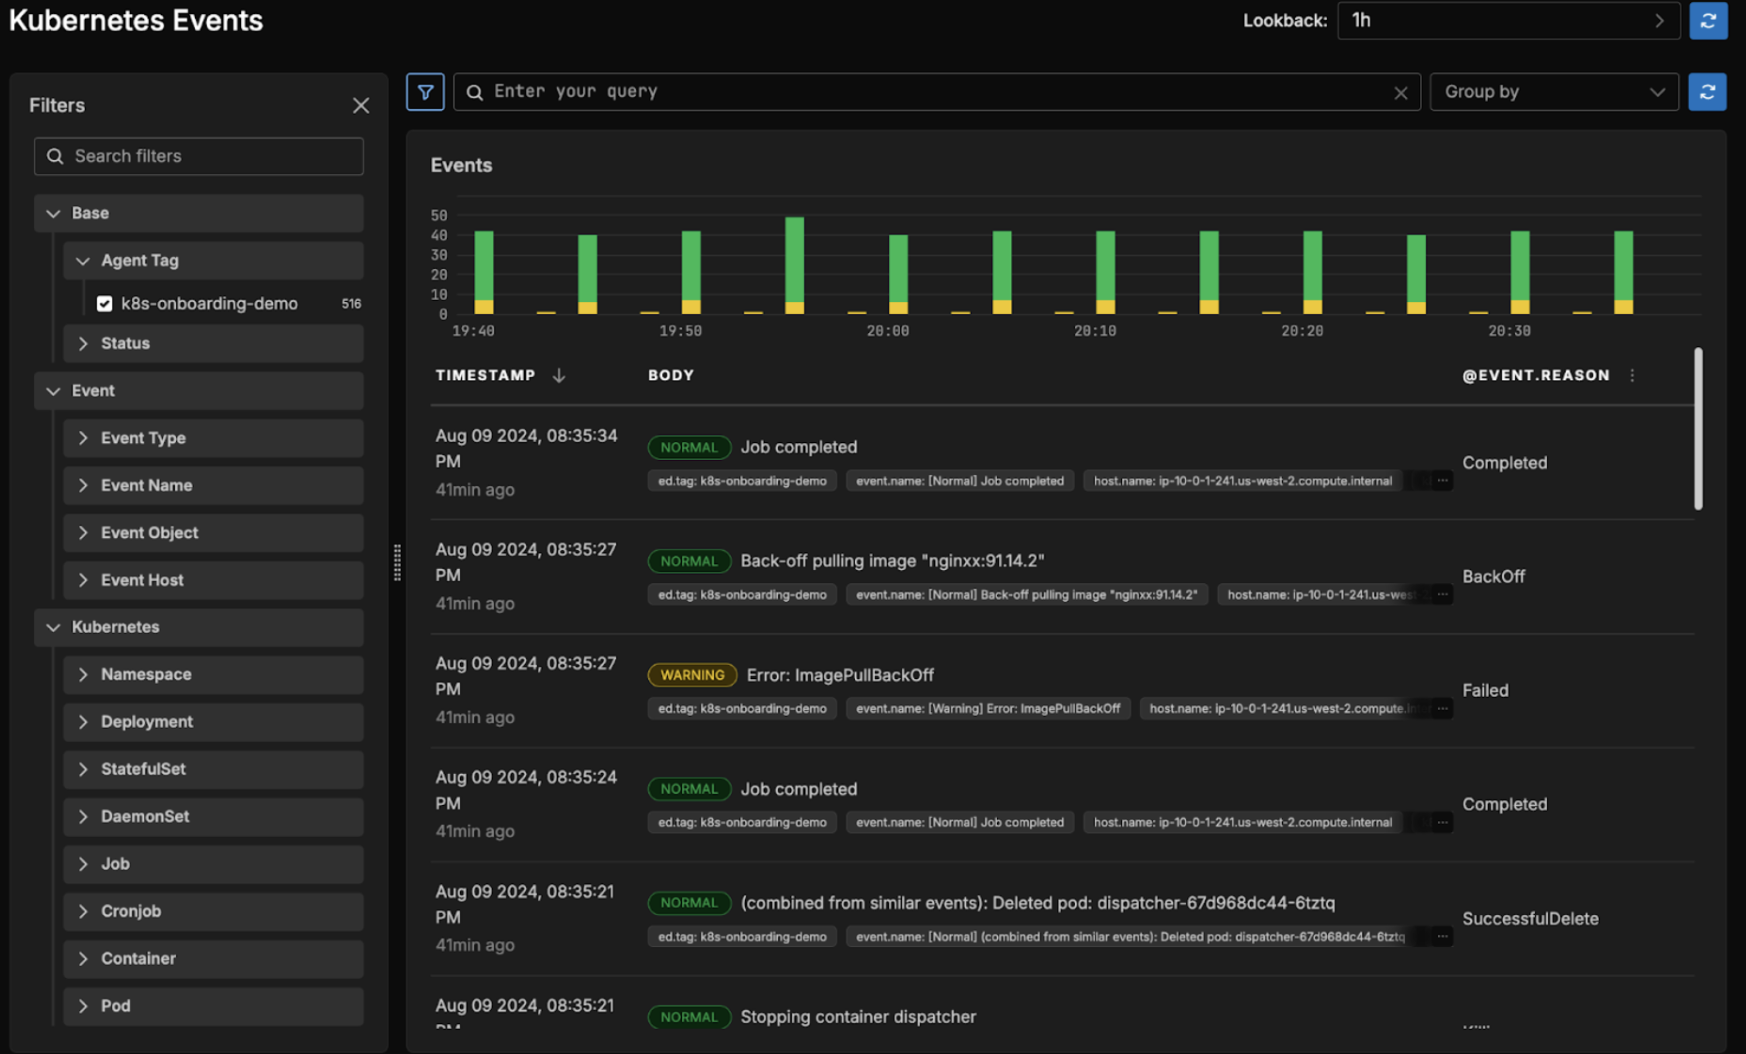
Our new ‘Kubernetes Events’ page allows you to easily search through your Kubernetes event data. With this view, users get a high-level view of the health of their Kubernetes environment, along with real-time information on every component running within their clusters.
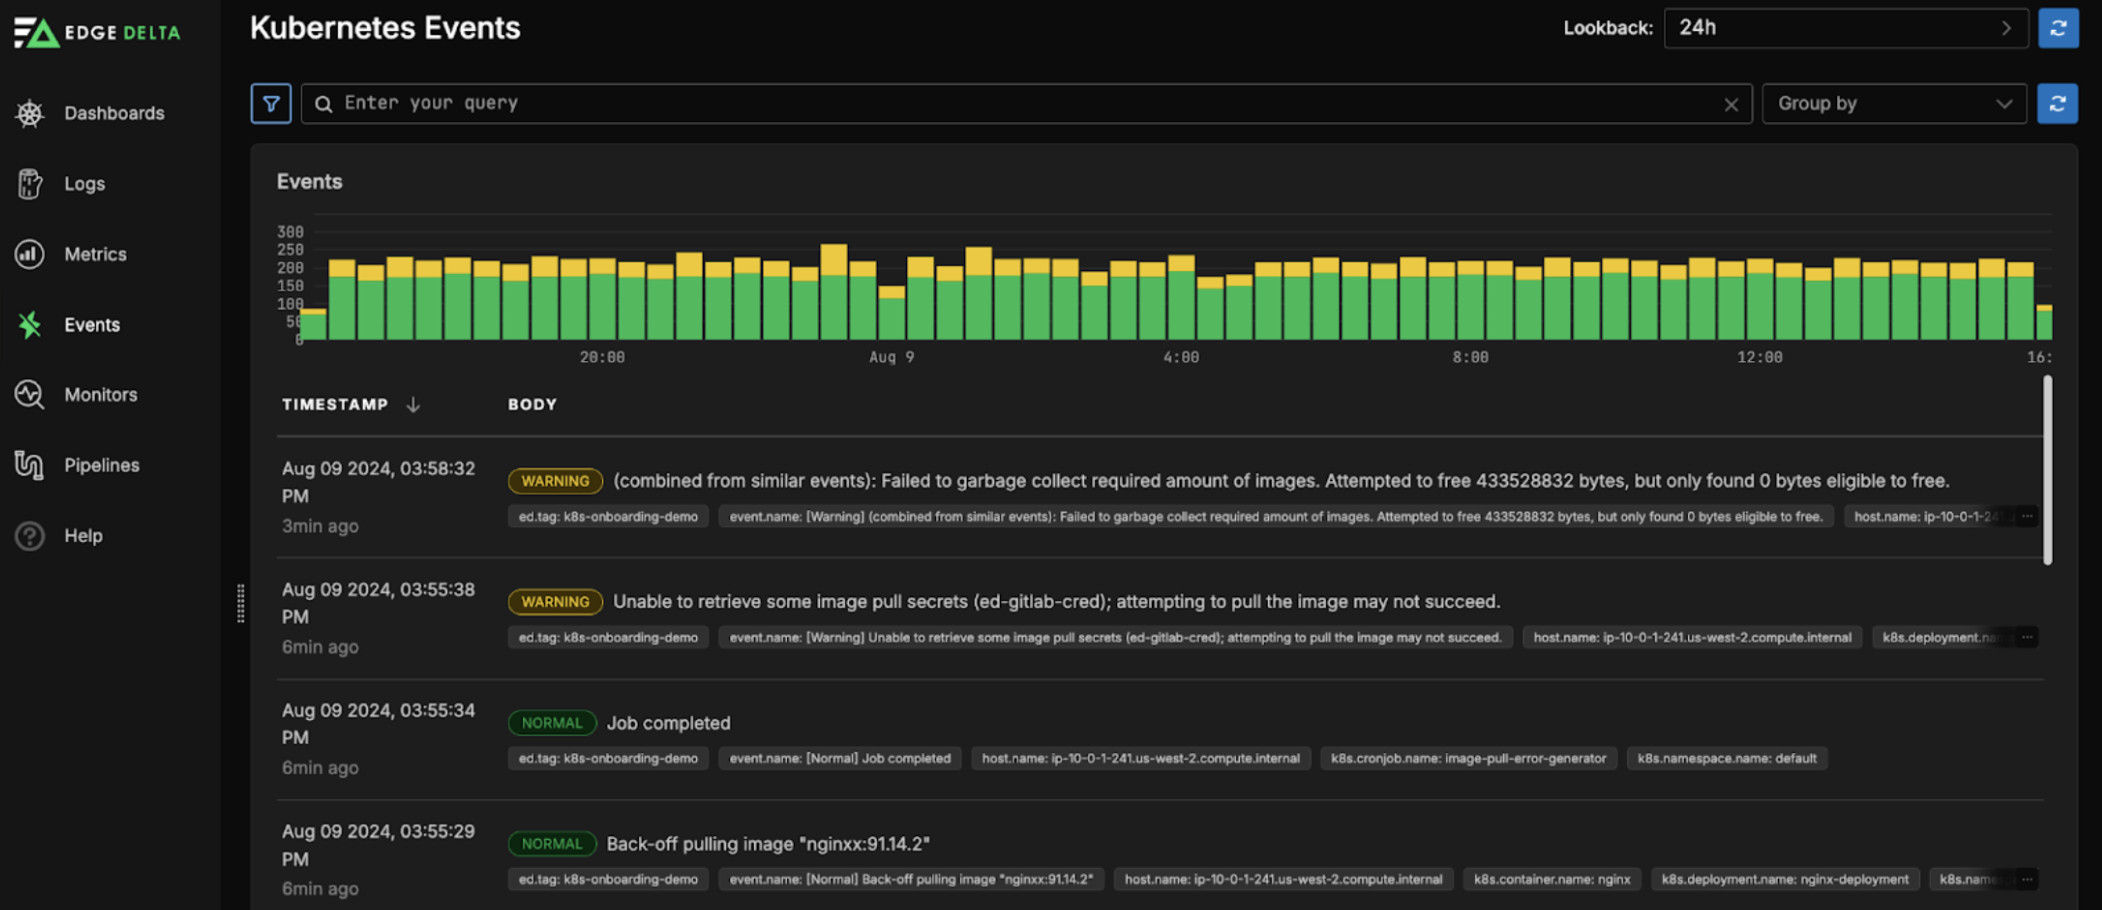
Edge Delta’s UI immediately renders a skyline graph, charting the events’ historical behavior, color-coded by severity level. Additionally, the UI displays relevant metadata for each event, including its timestamp and body.
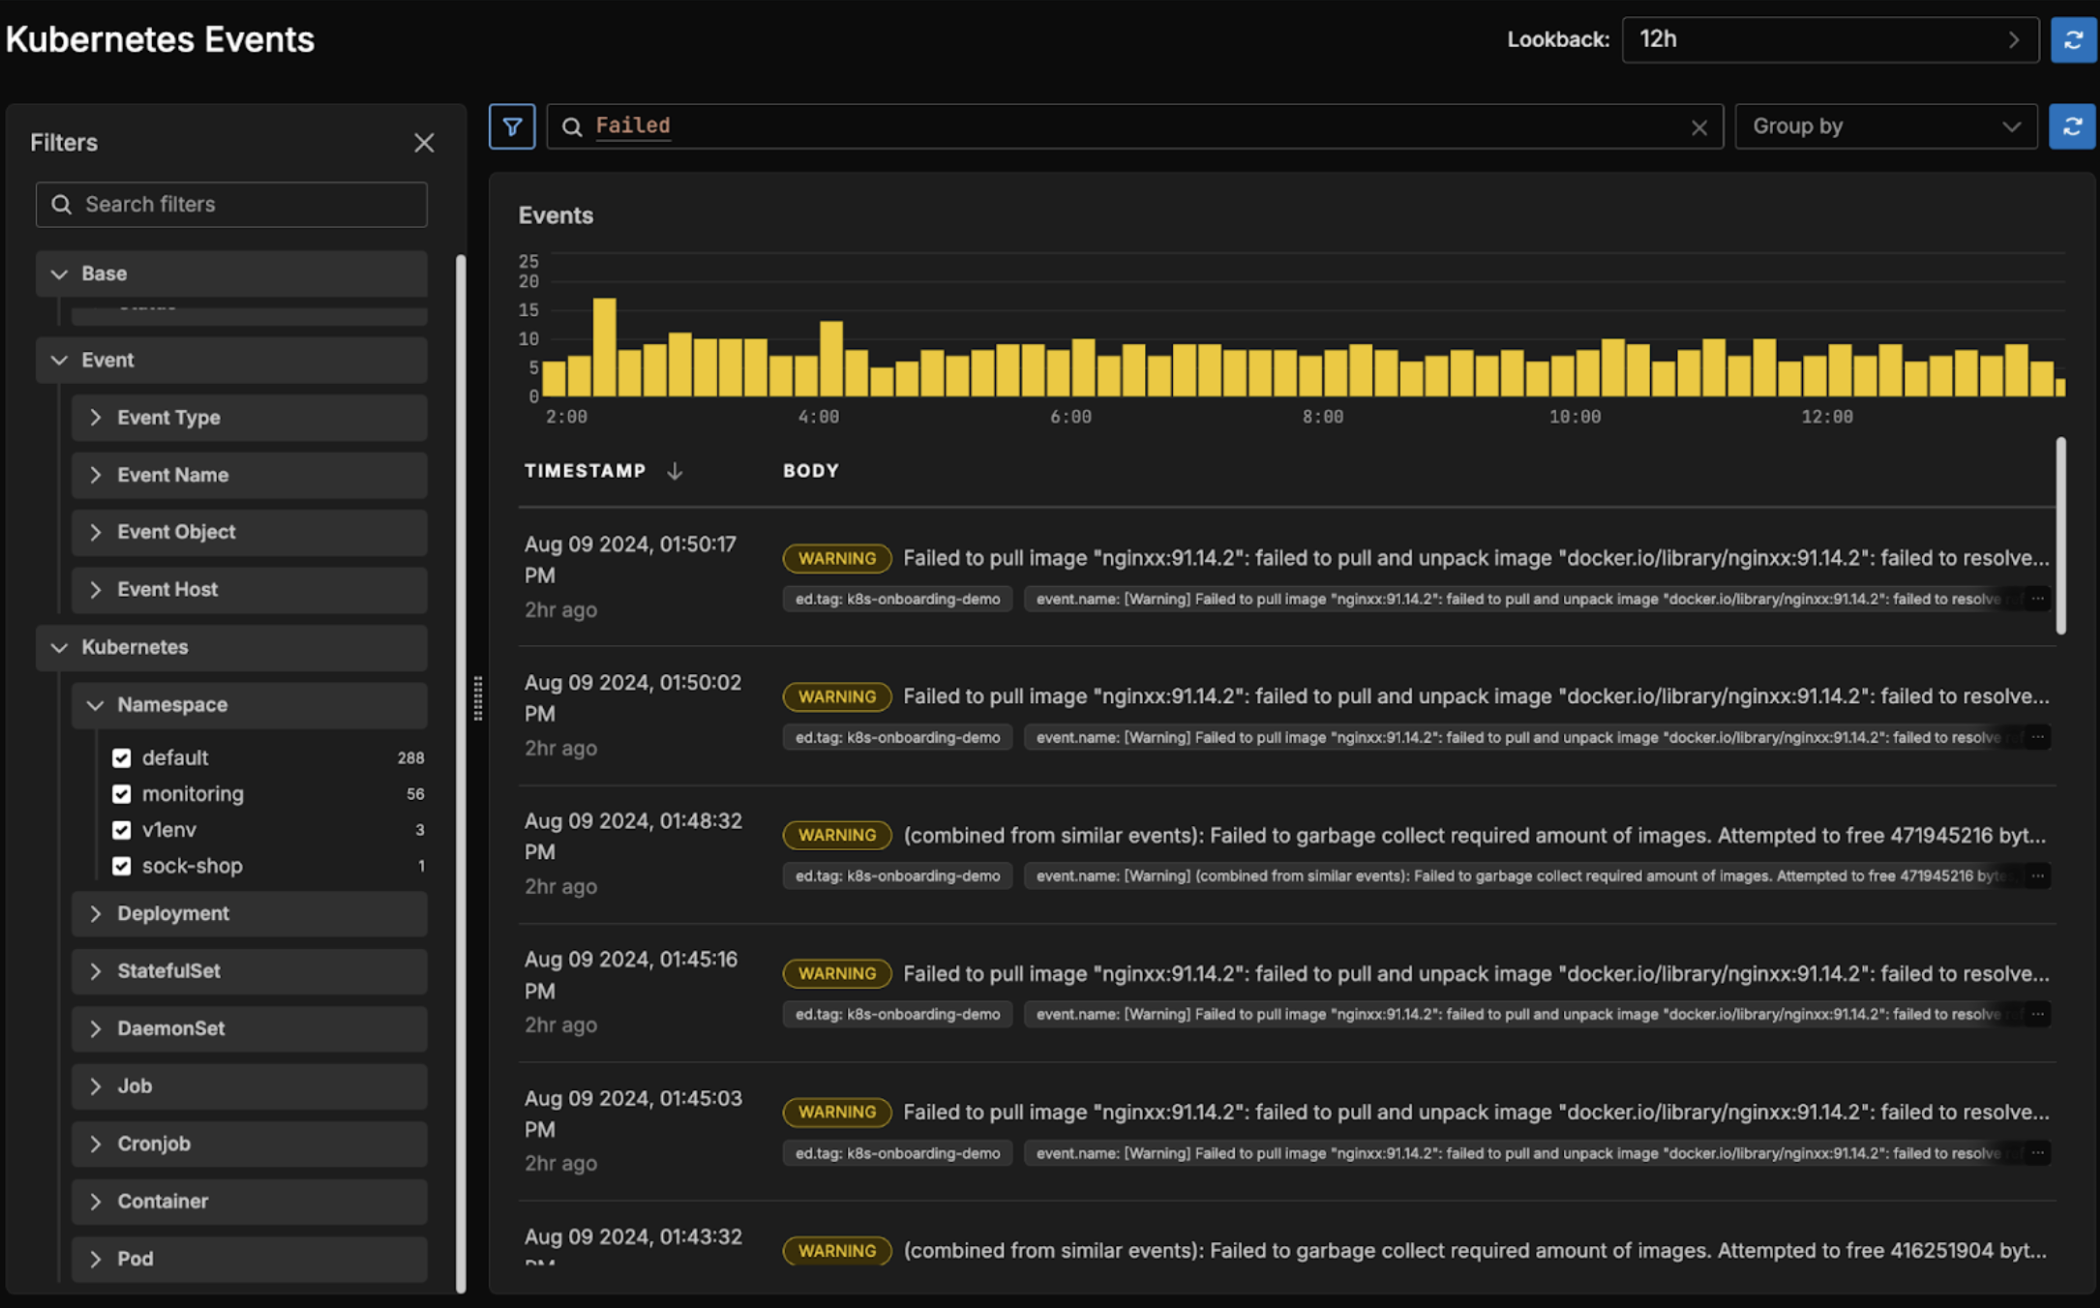
Users can filter event data on any number of fields, including — but not limited to — Event Type, Host Container, and Kubernetes namespace, and can also perform full text searches to query event messages containing specific keywords.
Additionally, users can drill down into individual events to get information like when the event was first registered and which component the event belongs to:
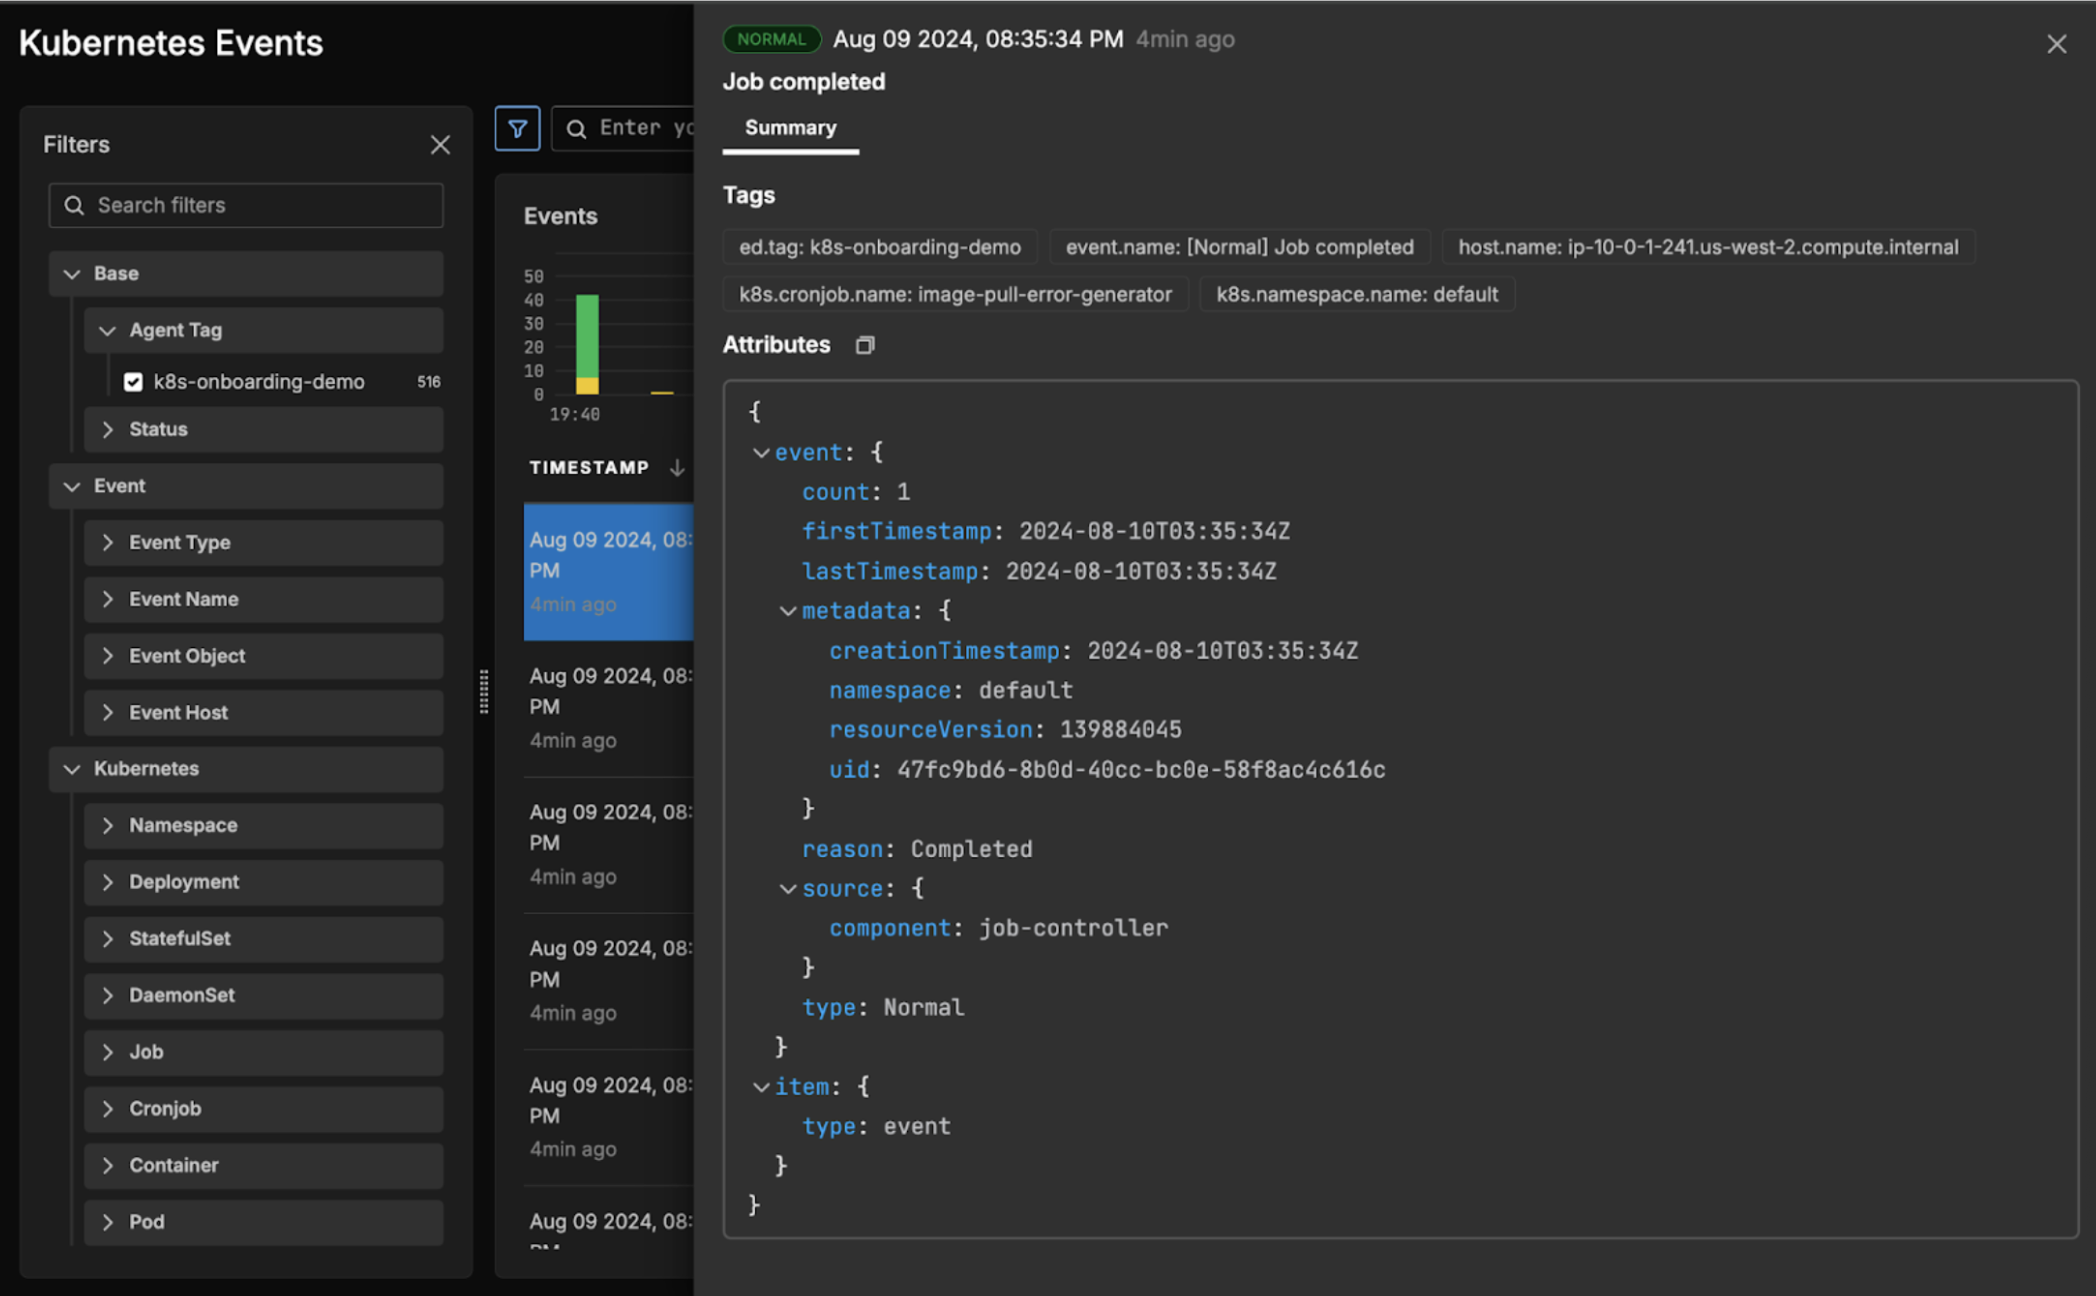
Once clicked, the event explorer provides the user with useful metadata for the selected event, including relevant tags along with individual attribute values. From this view, users can do a few interesting things:
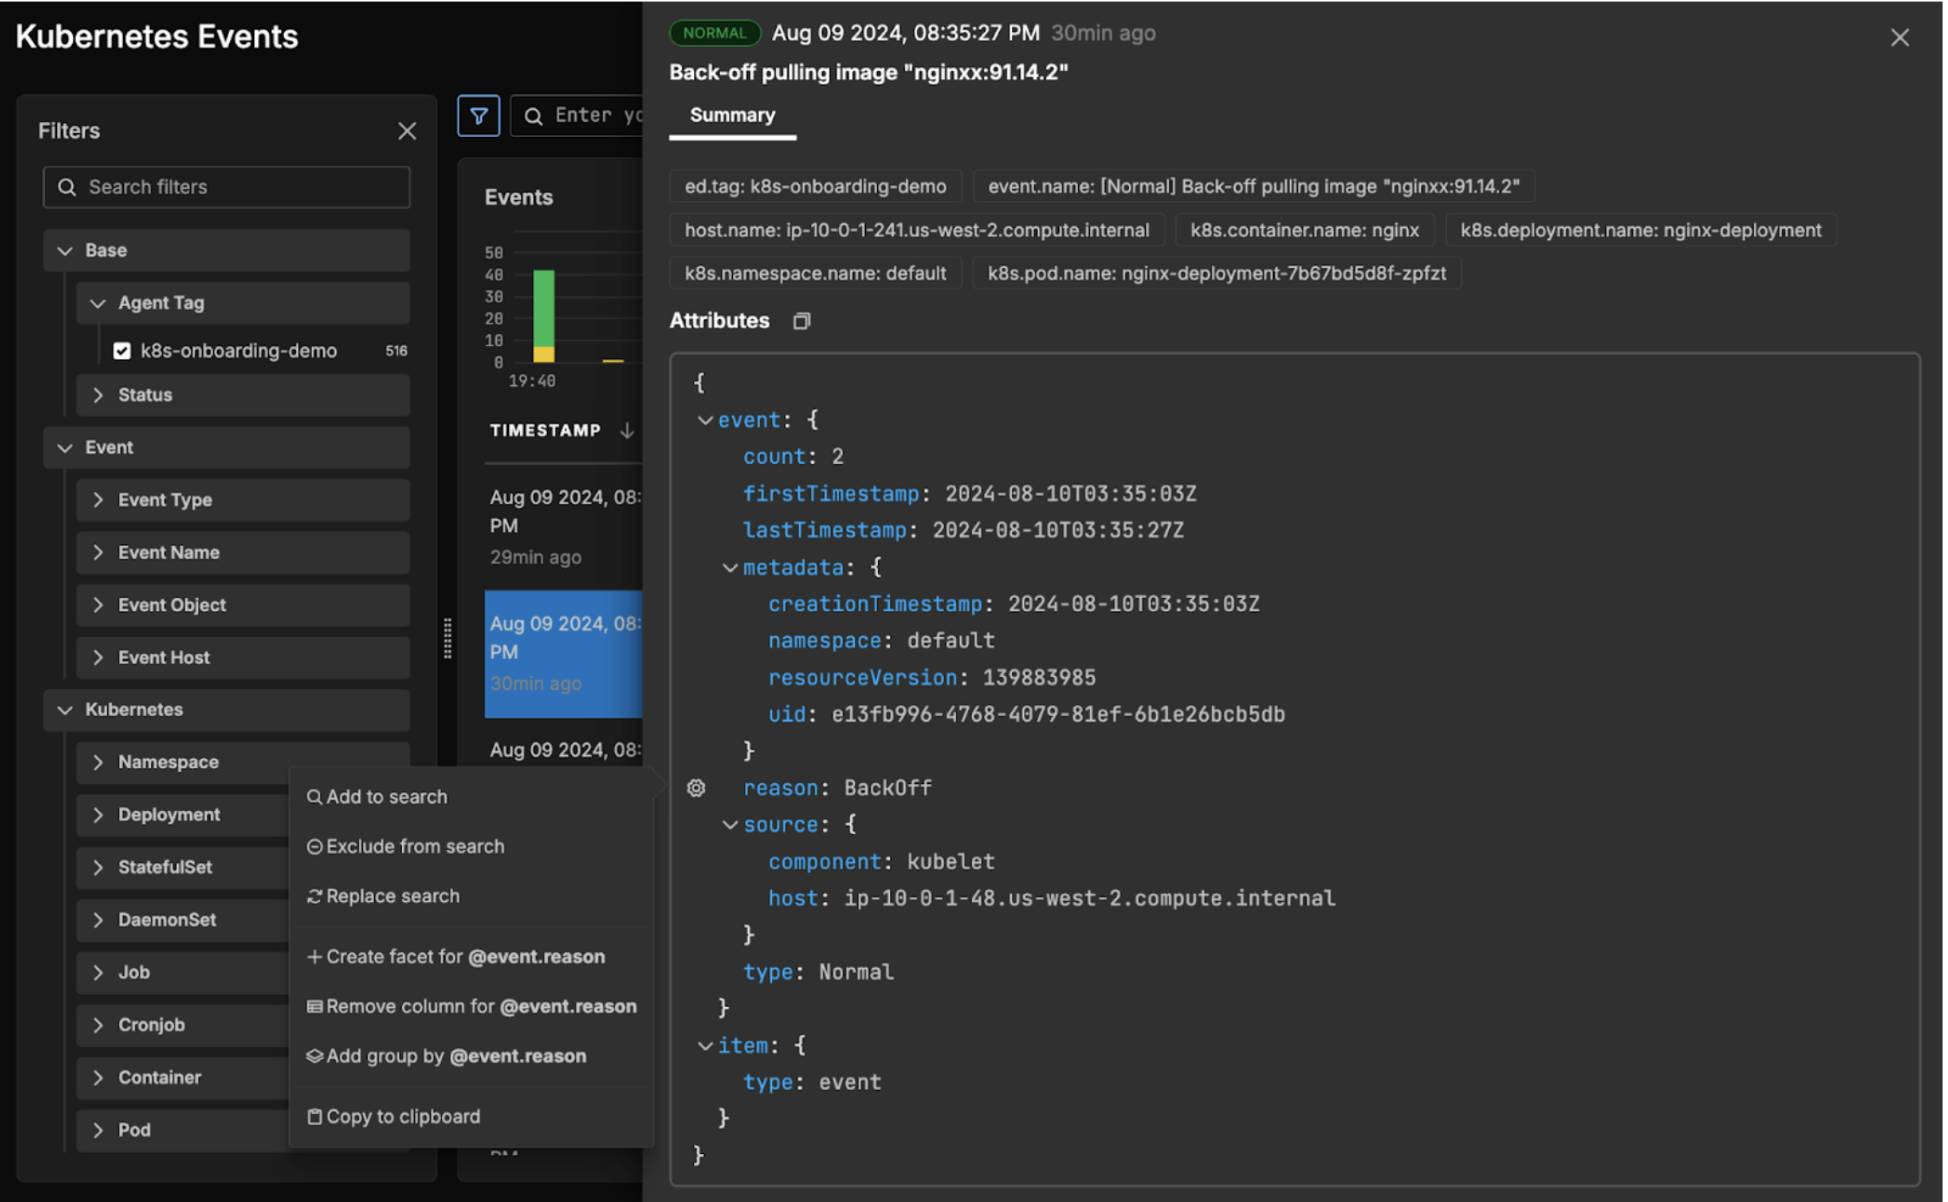
Selected the ‘reason’ attribute from the previous image
When a user clicks on a specific attribute (in this case, we have clicked on the ‘reason’ attribute) they are shown a new view, with a number of features. From here, users modify their original query by:
- Adding the chosen attribute to or removing it from the current event search query
- Replacing the existing query with one consisting only of the chosen attribute
- Adding the chosen attribute as a group by field
Additionally, users can add a column to the main view for the chosen attribute, to more quickly see its relation to individual events:
The @event.reason column has been added to the main view, rendering for each event the reason it was created.
And can add attributes to permanently reside in the Filters section, to more easily filter event data on it:
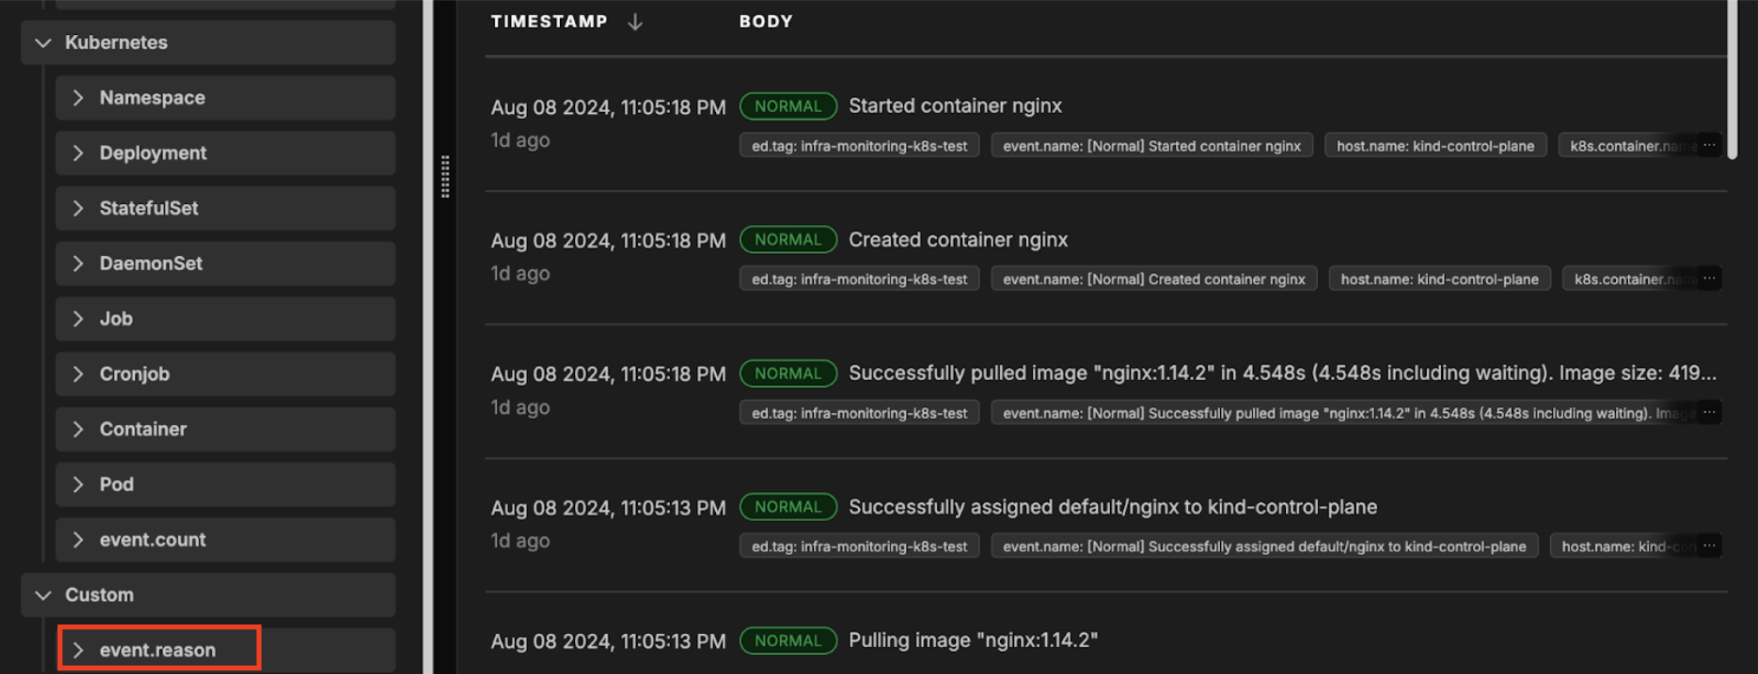
A new facet was created under the ‘Custom’ bar called ‘event.reason’, which the user can now filter on.
Improved Analysis and Visualization
In addition to search, the event explorer enables users to group their event data by any number of fields.
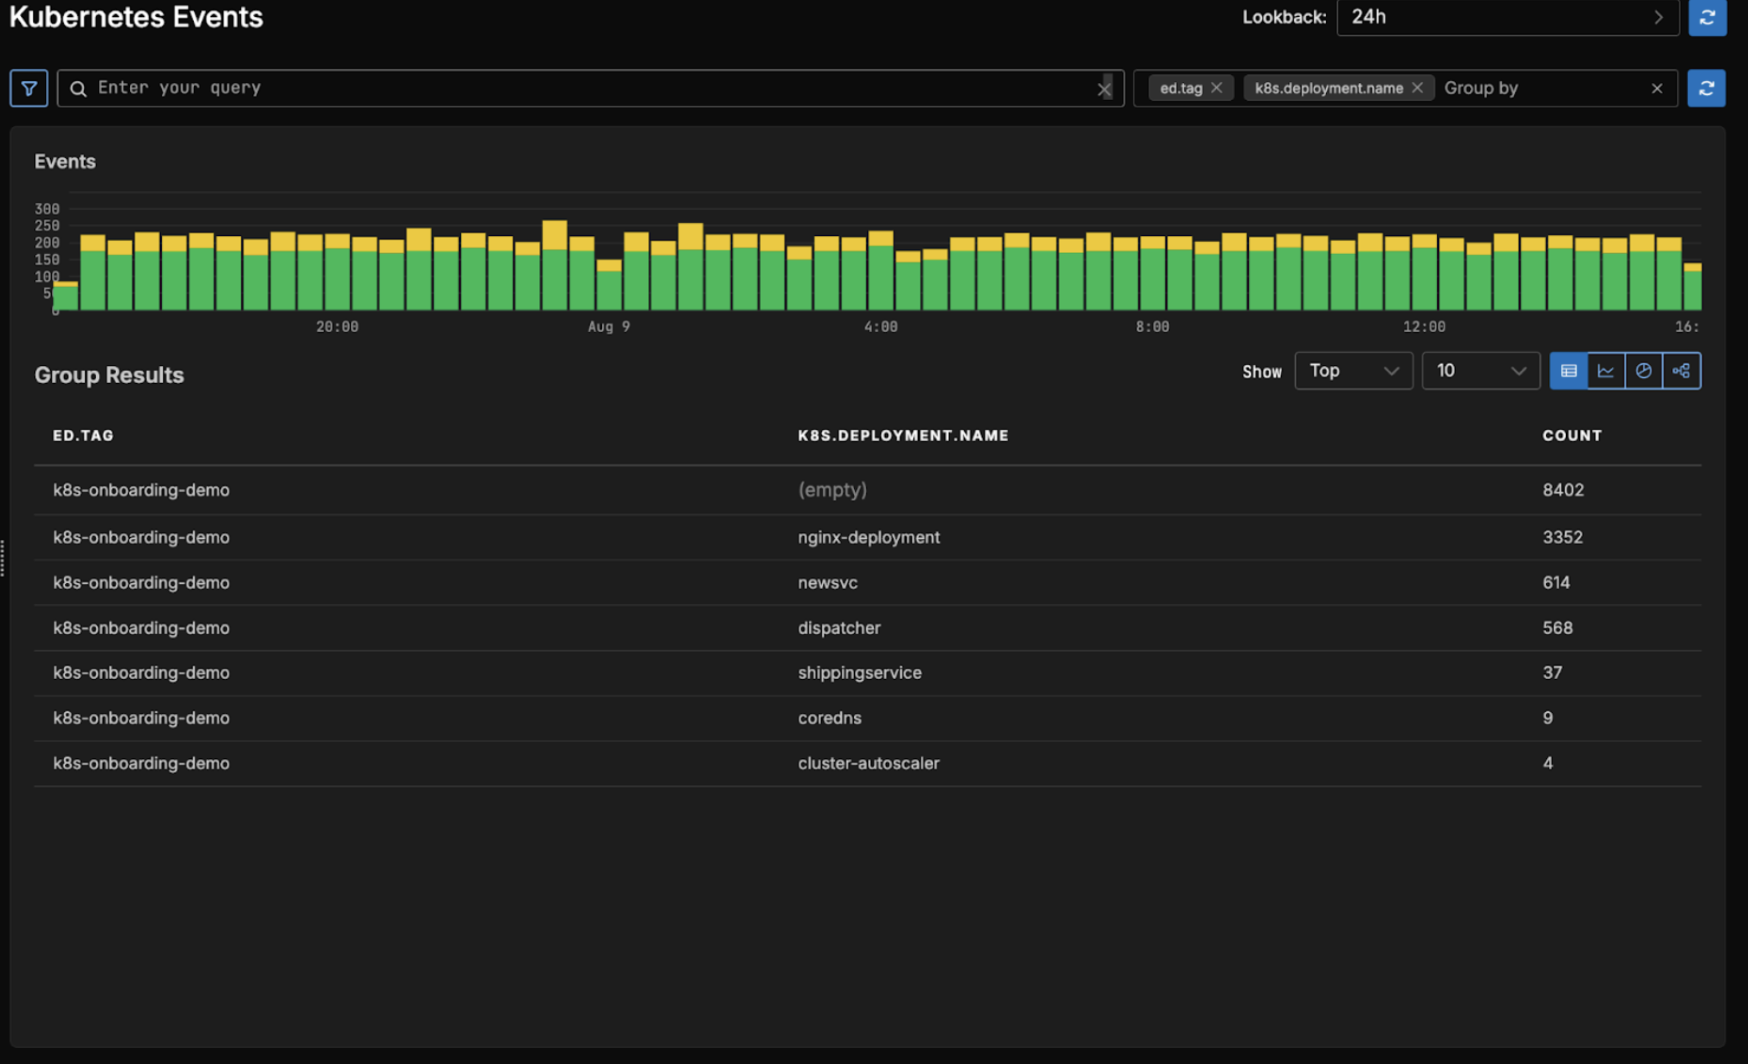
Users can easily render the most significant group results by modifying the visualization parameters, toggling between “Top” and “Bottom” counts and displaying anywhere from 2 to 50 rows. Users can also choose to visualize their group results a number of ways beyond the standard table representation. For the above query, here are the other possible visualizations:
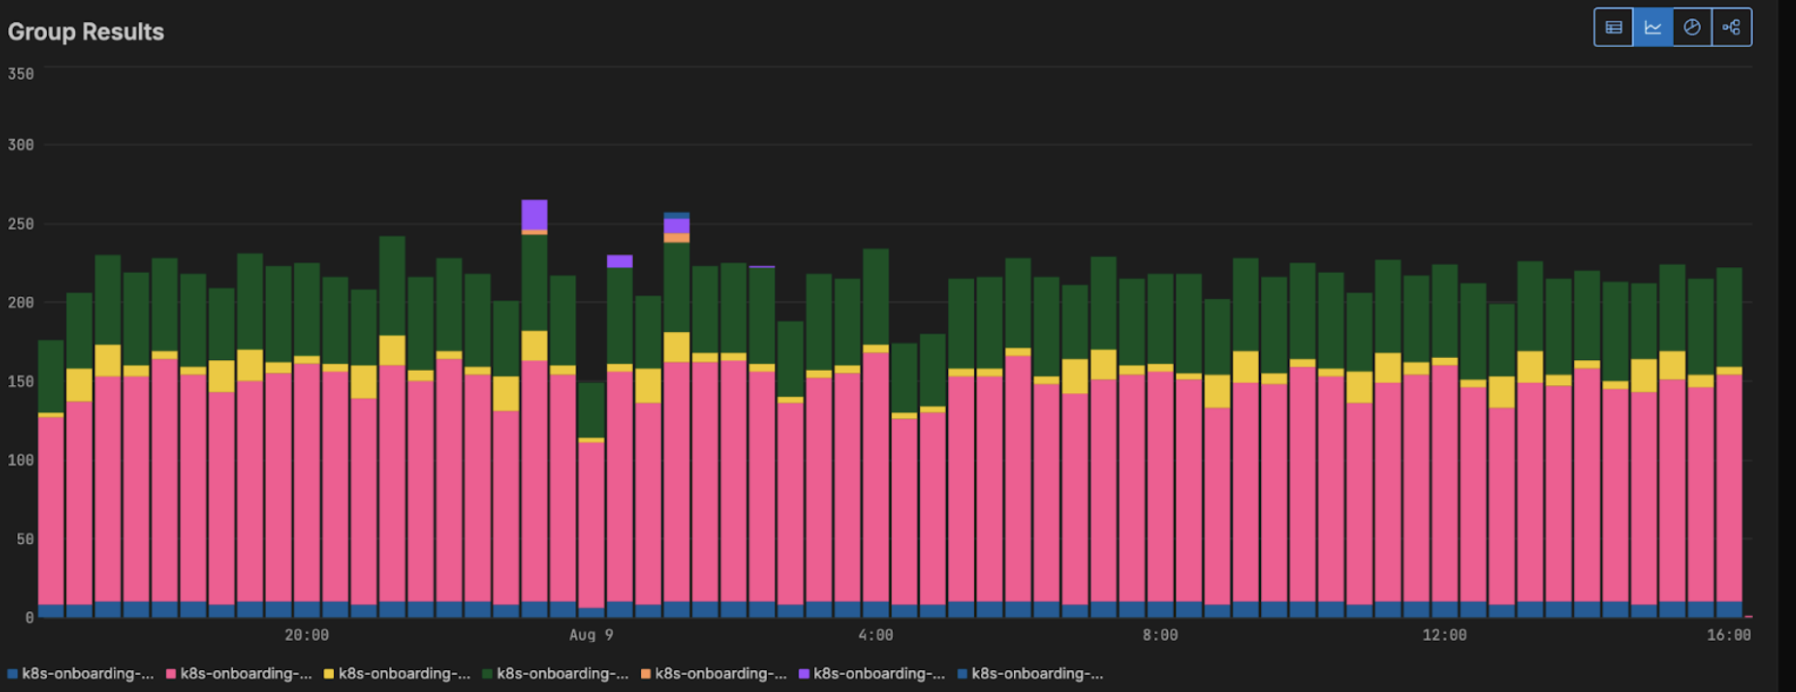
This is a more traditional skyline view of the data, visualizing the breakdown of each grouping count for each unit in time. It is great for seeing how the grouping counts have changed over time, during the chosen interval.
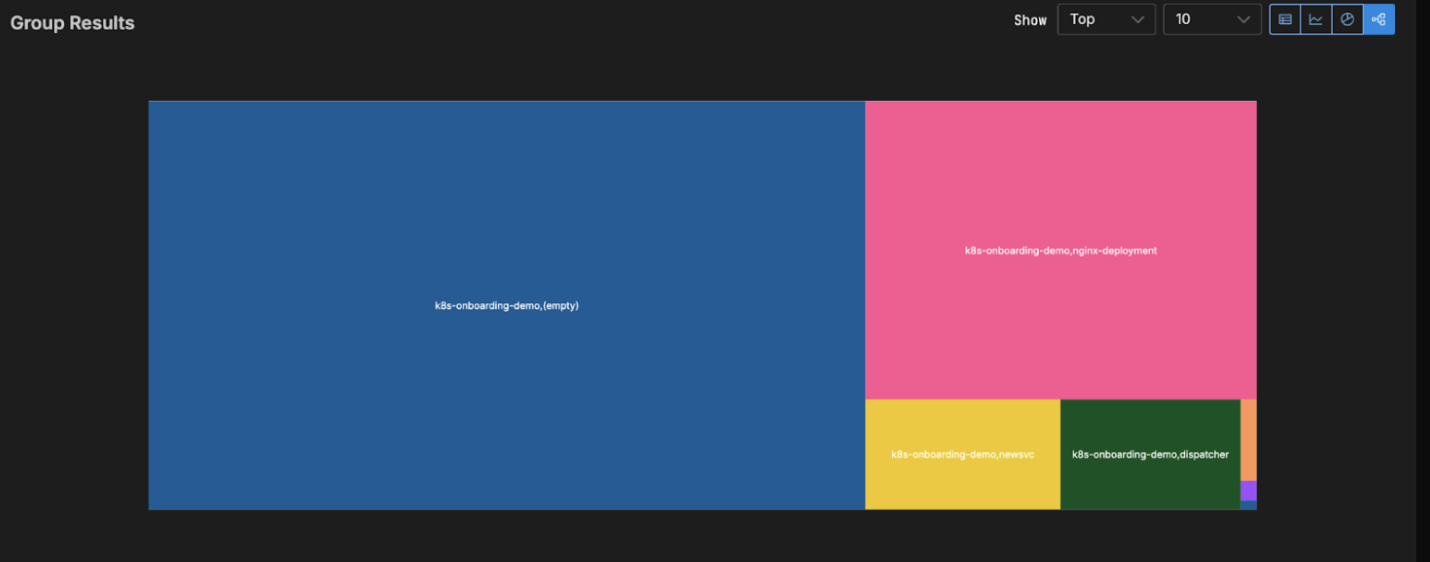
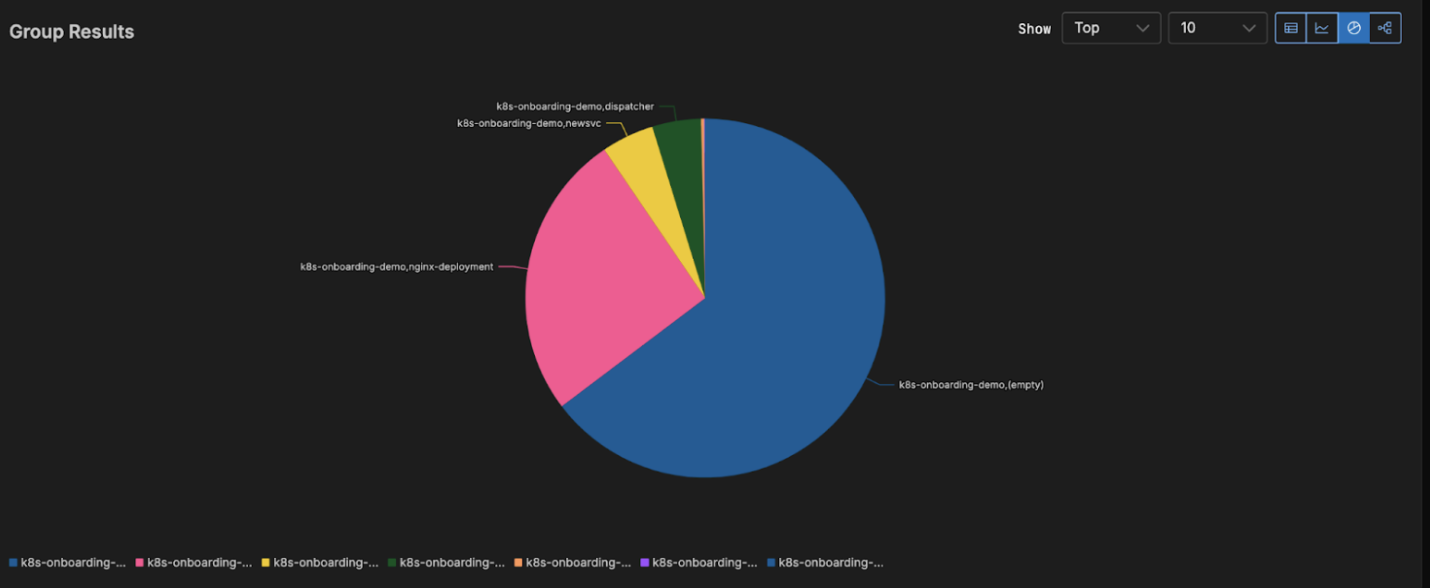
The block chart and pie chart visualizations focus more on the magnitude of each grouping count compared to one another.
Getting Started
Our new Kubernetes Event Explorer is now live in the Edge Delta environment. Give it a spin in our new sandbox, or sign up for a free trial!


