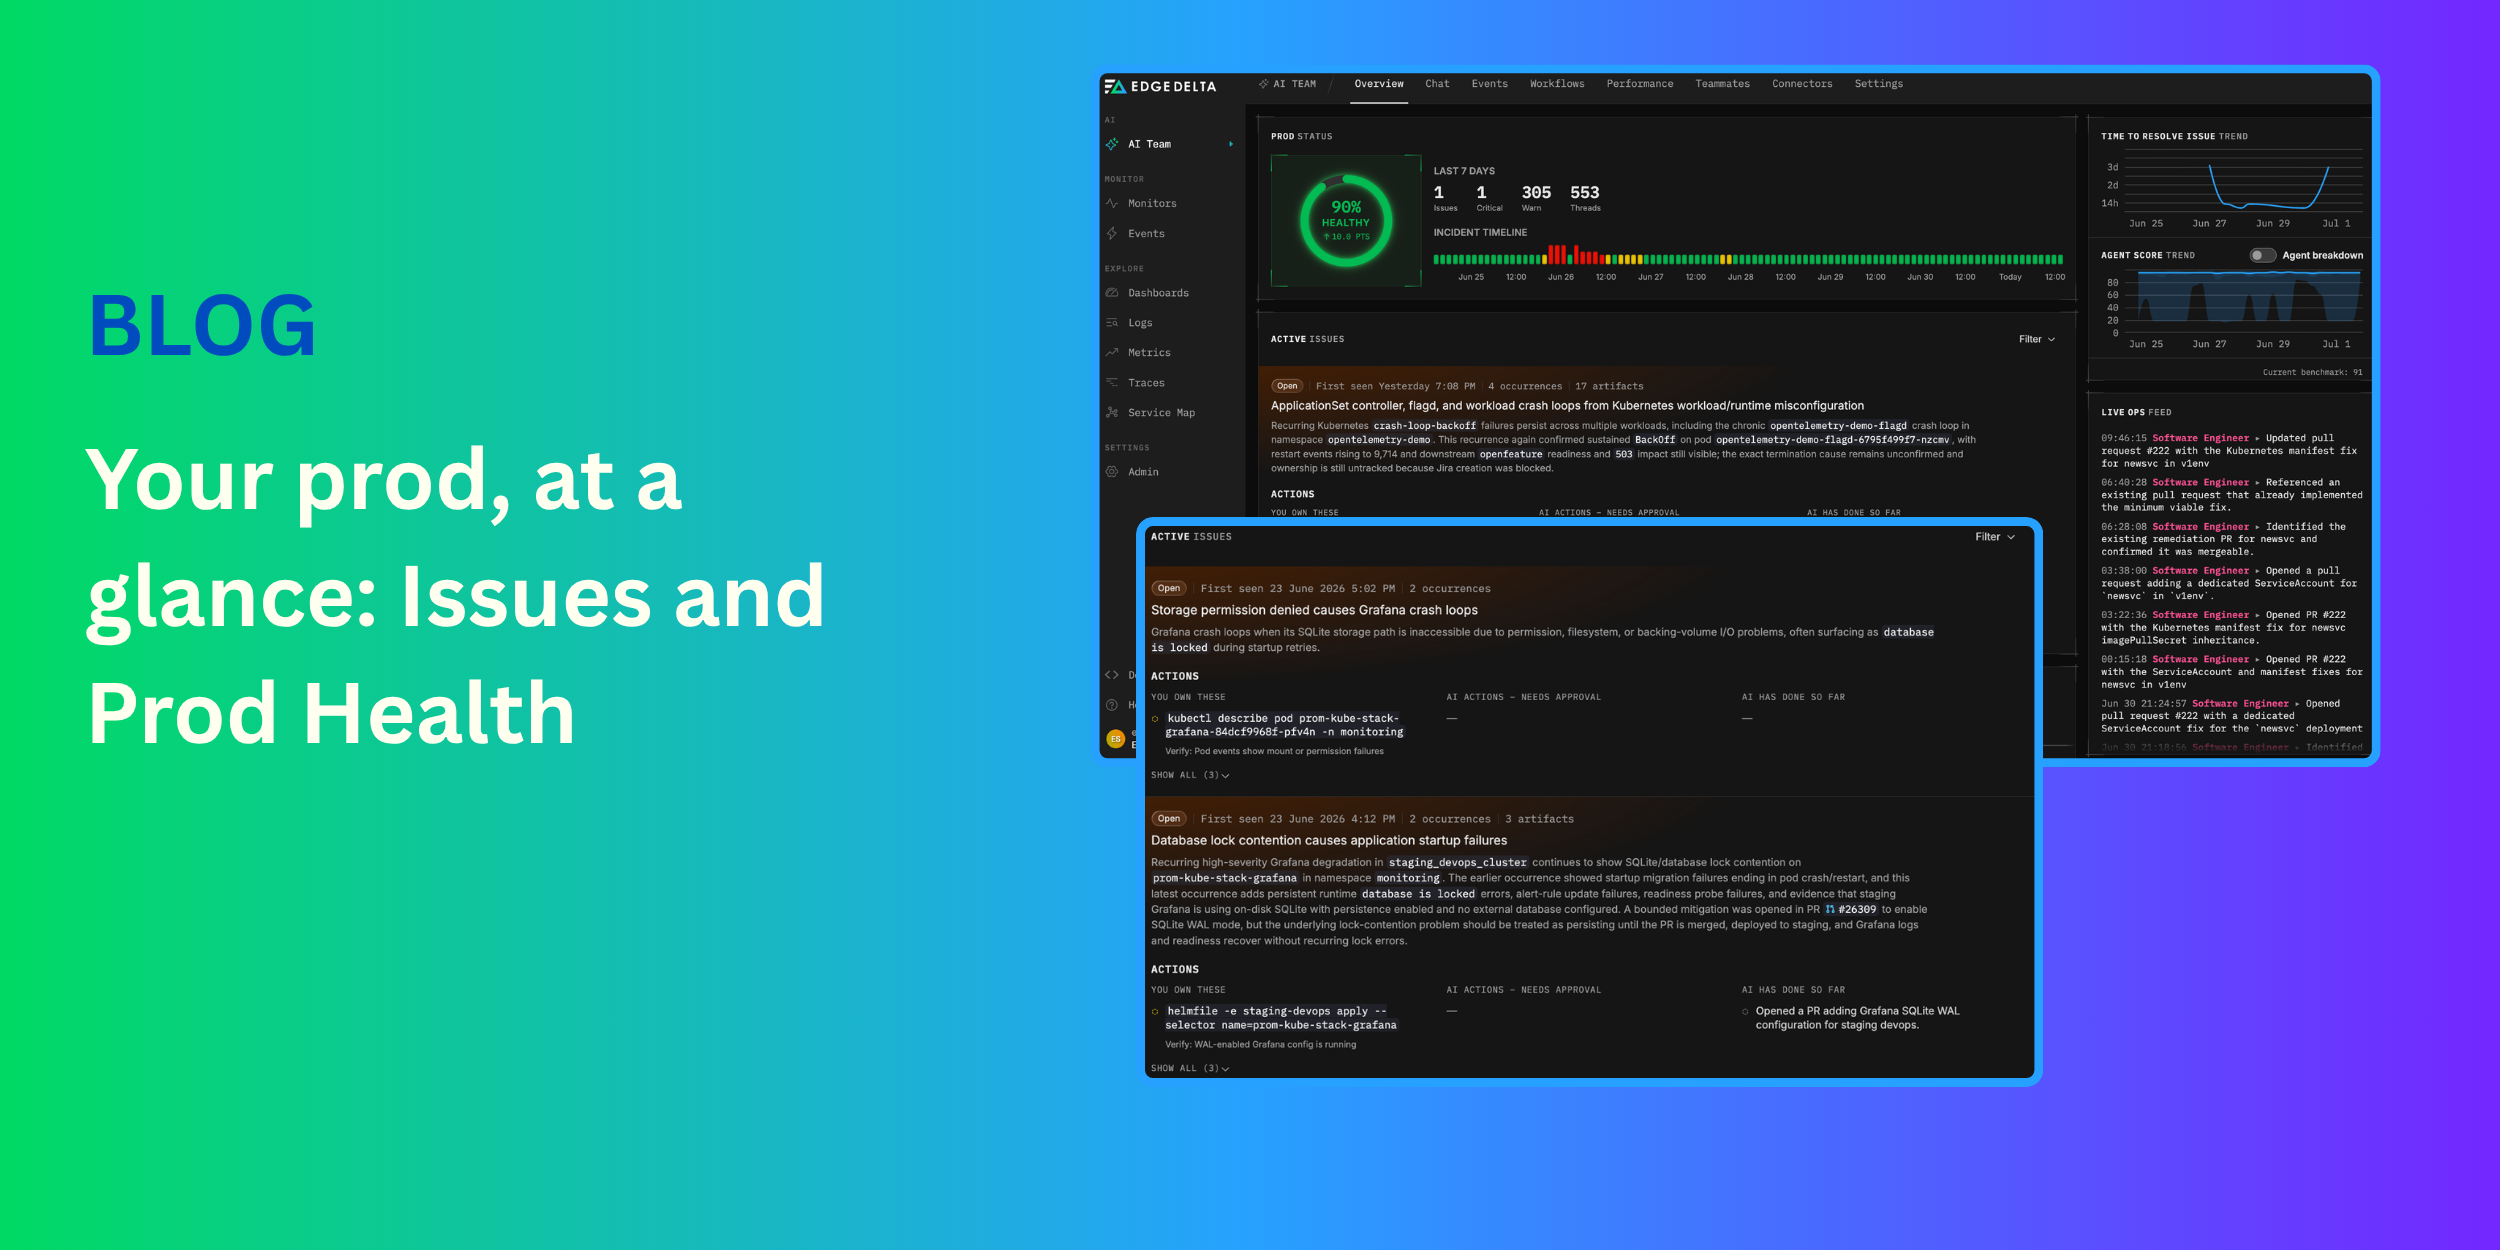
Monitors are a key piece of the observability puzzle — and that is no different with Edge Delta. While our agents are busy processing your data on the edge within your environments, our monitors sitting in our backend have access to your data aggregated across all environments. This gives our monitors the unique ability to present you with high-level data insights and to create a robust system to alert you when your services encounter errors.
As you might expect, managing a growing collection of observability data can rapidly become overwhelming, particularly when working with large quantities of log and metric data. Therefore, it is crucial that your monitoring experience is both smooth and intuitive, to maximize the value derived from the monitoring process.
Our goal with this release is straightforward: We want to simplify how you interact with your observability data. In this blog post, we’ll describe how we deliver on that goal.
What’s New?
This release improves upon our previous monitoring experience in a few key ways:
- New monitoring flow, giving users the ability to interact with their monitors at both a high and more granular level.
- Improved monitor editing and creation functionality, which streamlines the process of creating new and modifying pre-existing monitors.
- OnCall AI, to assist with troubleshooting using LLMs when monitor thresholds are reached.
- New pattern anomaly monitors, which automatically alert you on negative patterns before they turn into bigger issues.
Let’s drill down into each of them and see how they work:
New Monitoring Flow
Our new monitoring flow gives you a centralized view of your monitor collection and enables you to work on a more granular level to adjust monitor internals however you see fit. Here’s how we break down the experience:
Monitor Status Page
The ‘Monitor Status’ page gives users a historical view of their triggered monitors.
This page acts as a central repository for all monitors that have reported a threshold violation at either the WARN or ALERT level. Once added, these “open” monitors remain in this page until they are manually removed. With the monitor internals abstracted away, you can easily visualize your alerts and quickly identify which monitors within your collection need to be prioritized.
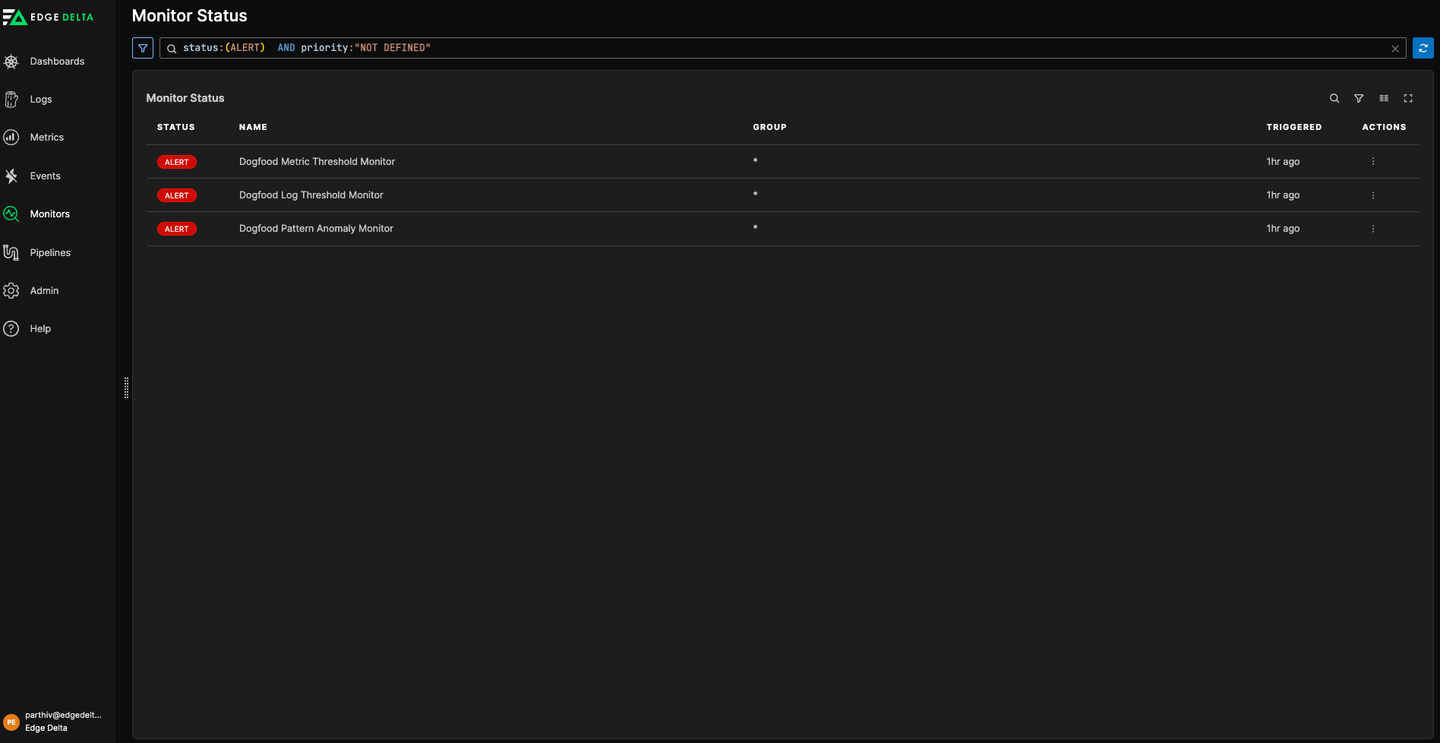
With this view, users can see the high-level information associated with each monitor, namely:
- Monitor Status (ALERT, WARN, or OK, depending on the status of the issue)
- Monitor Name
- Metric Group (the group from which the metric originates)
- Triggered (time elapsed since the monitor was added to this page)
Manage Monitors Page
The ‘Manage Monitors’ page gives you the space to perform actions on your monitor collection. Naturally, users can filter through these monitors by one or multiple features, and search for specific monitors in your collection, as well as:
-
Snooze/Unsnooze any monitor (action associated with silencing/unsilencing monitor notifications)
-
- Modifying thresholds for WARN and ALERT levels
- Updating notification settings
- Changing the underlying query
-
Remove a monitor from your collection
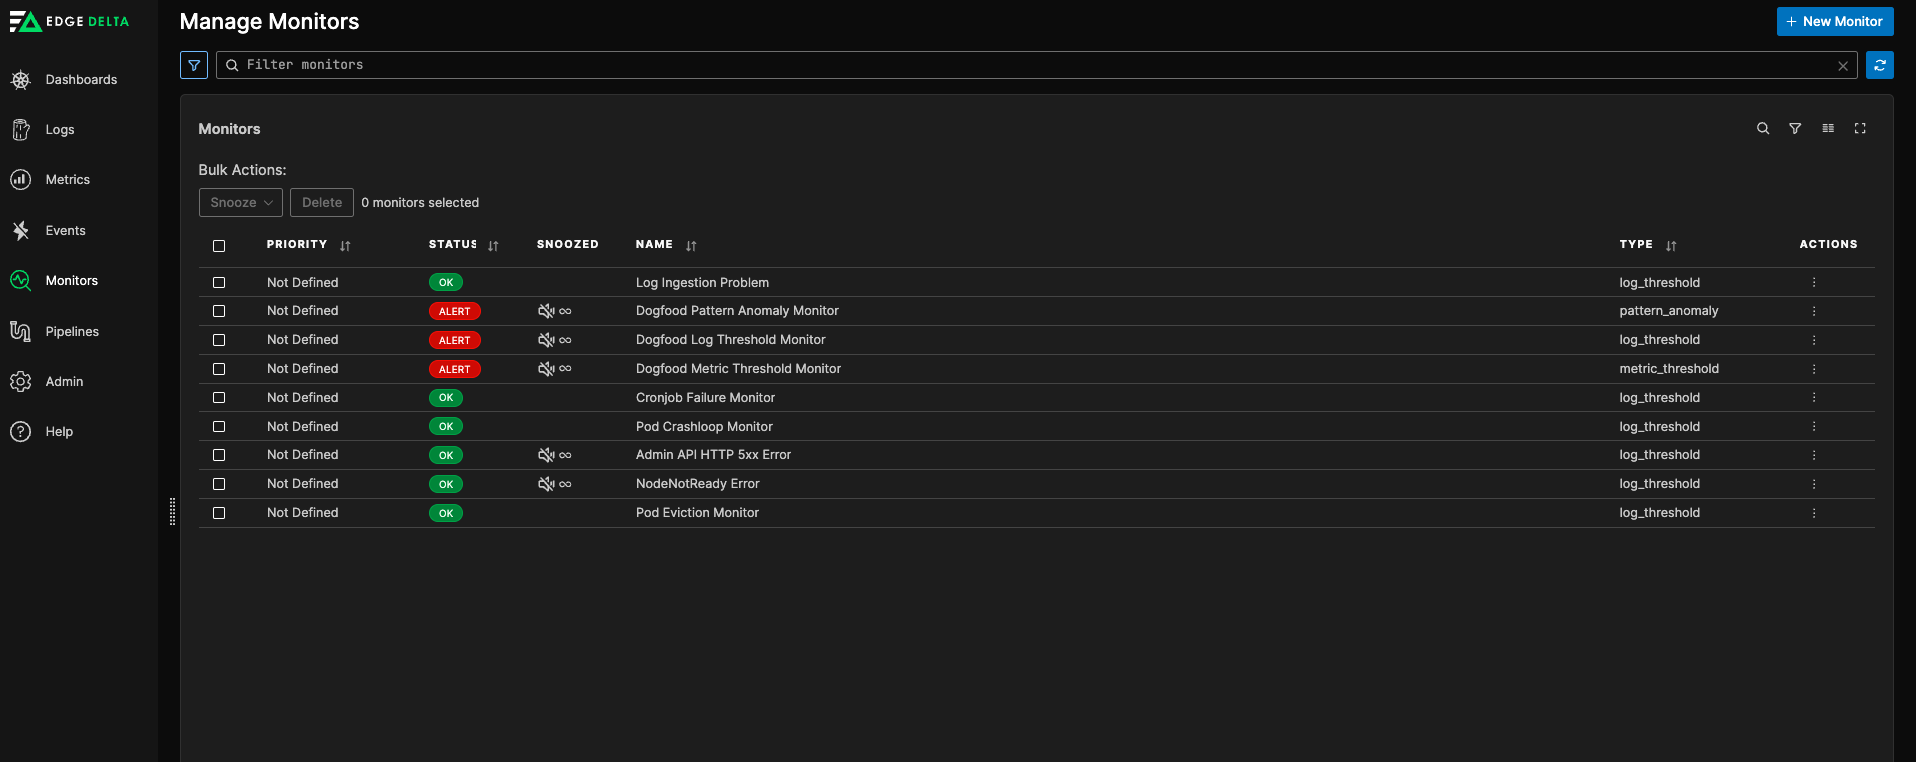
This more detailed view of your monitor collection includes:
- Priority (user defined value of Critical, High, Medium, or Low)
- Monitor Type (log threshold, metric threshold, or pattern anomaly)
- Snooze Status
Additionally, users can create entirely new monitors via the ‘New Monitor’ button.
Monitor Creation Direct From Log Search
The ‘Manage Monitors’ page isn’t the only place to create new monitors. Users can now create new monitors directly within our ‘Logs Search’ page, further streamlining the monitor creation process.
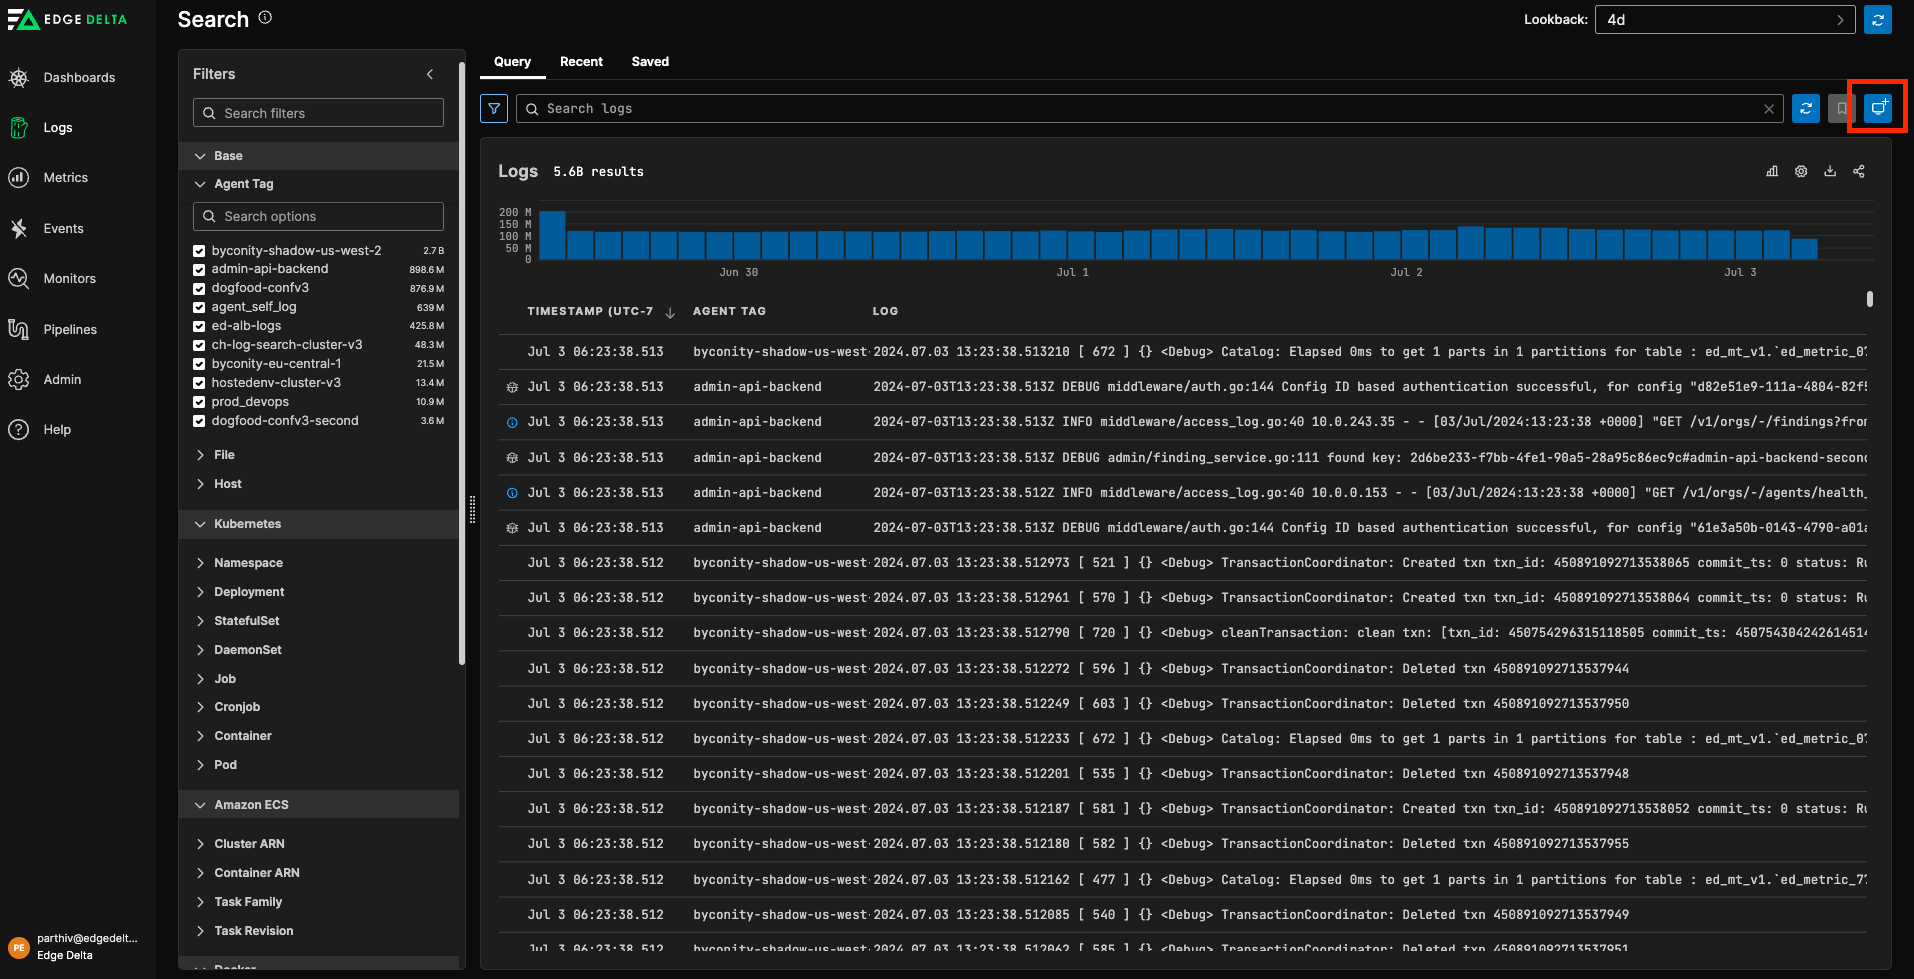
After querying logs within this interface (‘k8s.container.name:httprerecorder’ logs in the image above), users can immediately create a new monitor to track them. Once the button (denoted with a red boundary box in the image above) is clicked, the user is redirected to the monitor creation page, with their query pre-loaded.
This gives users the ability to play around with different queries and see visually how the corresponding logs have behaved historically, before choosing to create a new monitor to watch over them.
Dynamic Notification Routing
One of the more important additions in this release is our new, Edge Delta native, dynamic notification routing.
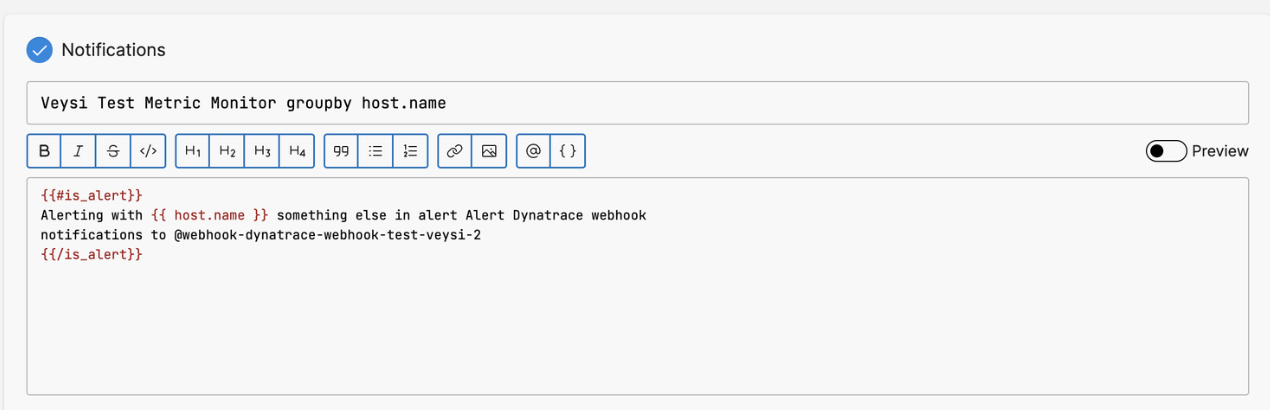
With dynamic routing, users can conditionally determine which teams to notify based on both monitor status and source of the associated metric. Within the ‘edit monitor’ interface, users can construct logic using Edge Delta native tags to send an alert payload to a particular slack channel, email address, or Pagerduty endpoint, to name a few.
The snippet below shows an example payload which routes notifications dynamically:
# This is a Pattern Anomaly Monitor
Testing a slack [monitor link](http://test.url)
{{#is_exact_match "ed.tag" "tj_hosted_v3_new"}}
The Agent Tag is **tj_hosted_v3_new**
@slack-legacy-cs-notify
{{/is_exact_match}}
{{#is_exact_match "ed.tag" "dbright_linux_demo"}}
The Agent Tag is **dbright_linux_demo**
@slack-legacy-slack-ds-notify
{{/is_exact_match}}
{{ed.tag}}
{{#is_alert}}
_This is an alert!_
{{/is_alert}}
In this example, the alert payload checks if the agent tag is either tj_hosted_v3_newor dbright_linux_demo, and depending on which is true, sends a notification to either the slack-legacy-cs-notify channel or slack-legacy-ds-notify channel respectively.
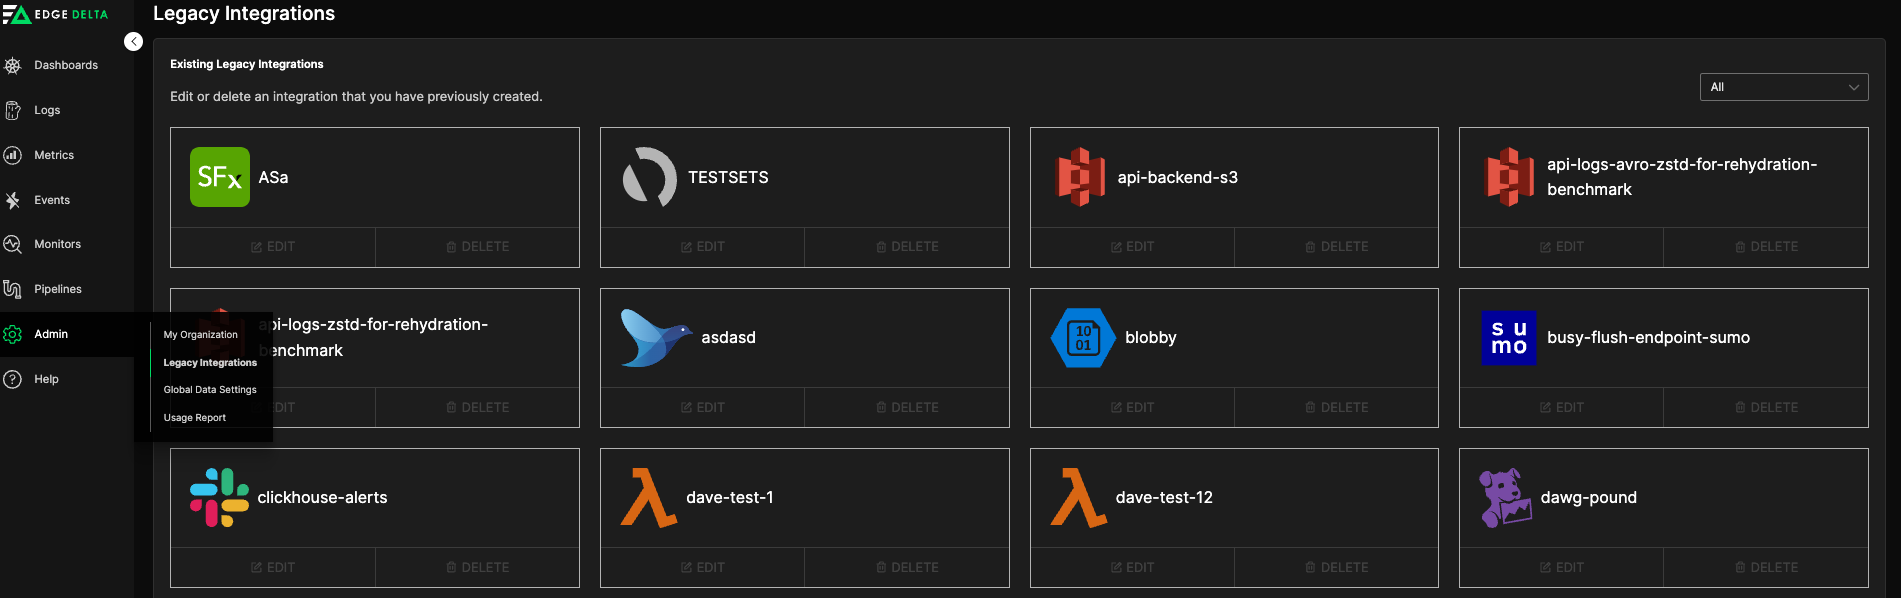
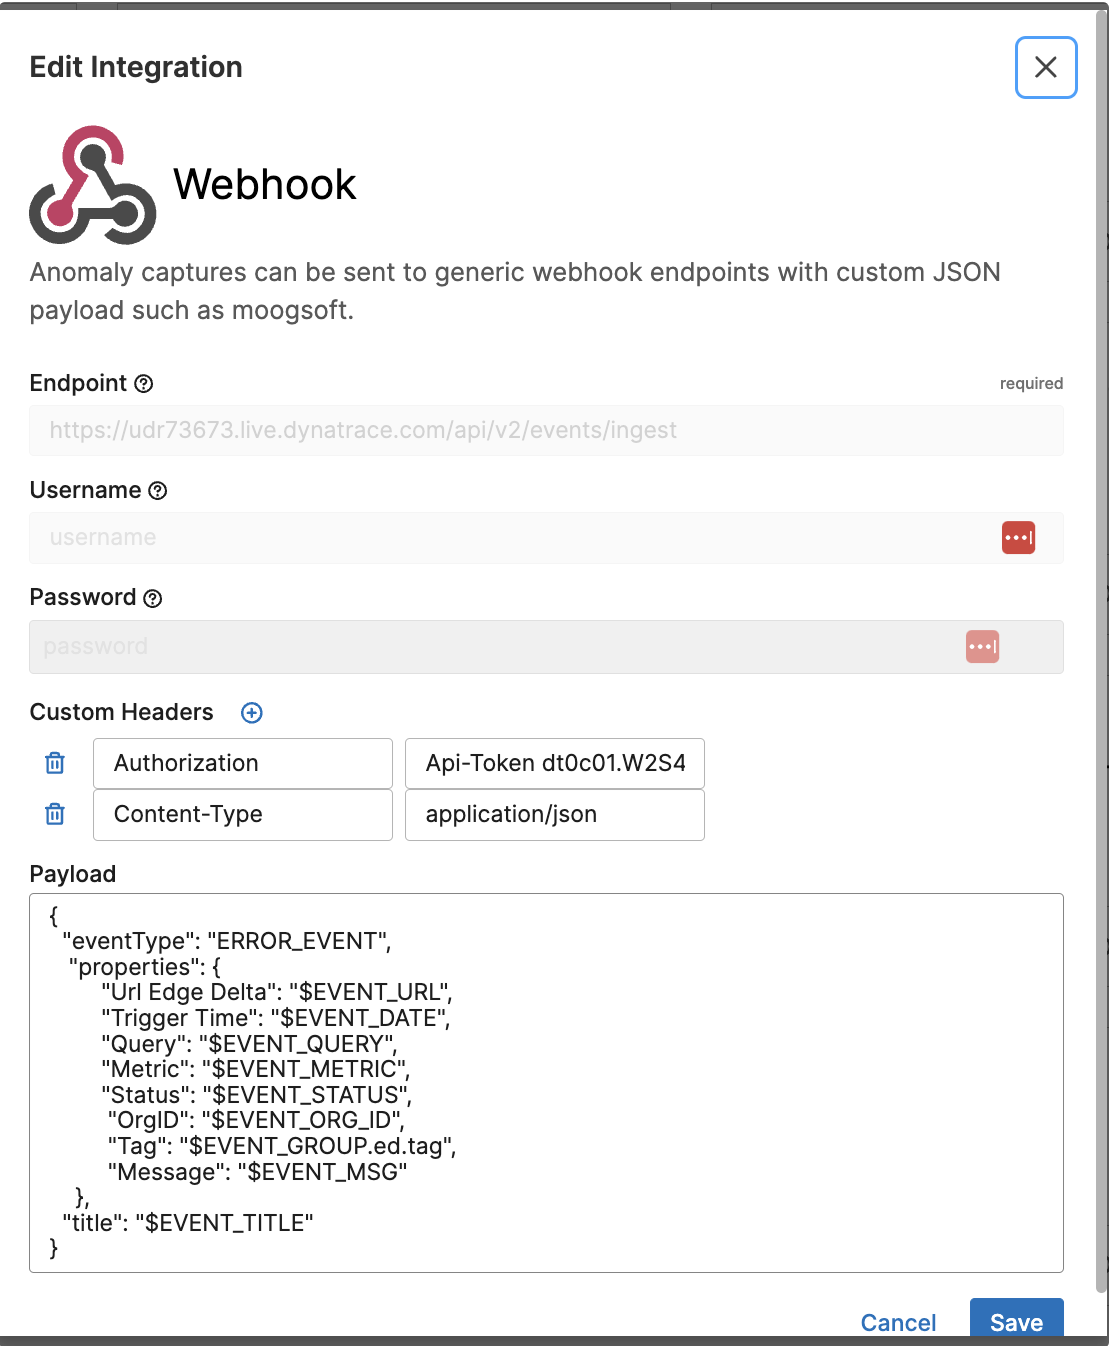
We are also releasing a generic webhook integration, which allows users to send the alert payload to any HTTPs endpoint which accepts POSTs. Users can add new trigger destinations via the admin → legacy integrations path:
Once added, you can configure the JSON structure as needed:
And reference a trigger destination within the routing payload.
Monitor Events Page
The ‘Monitor Events’ page gives you the space to visualize your alert history and inspect them in a more detailed manner.
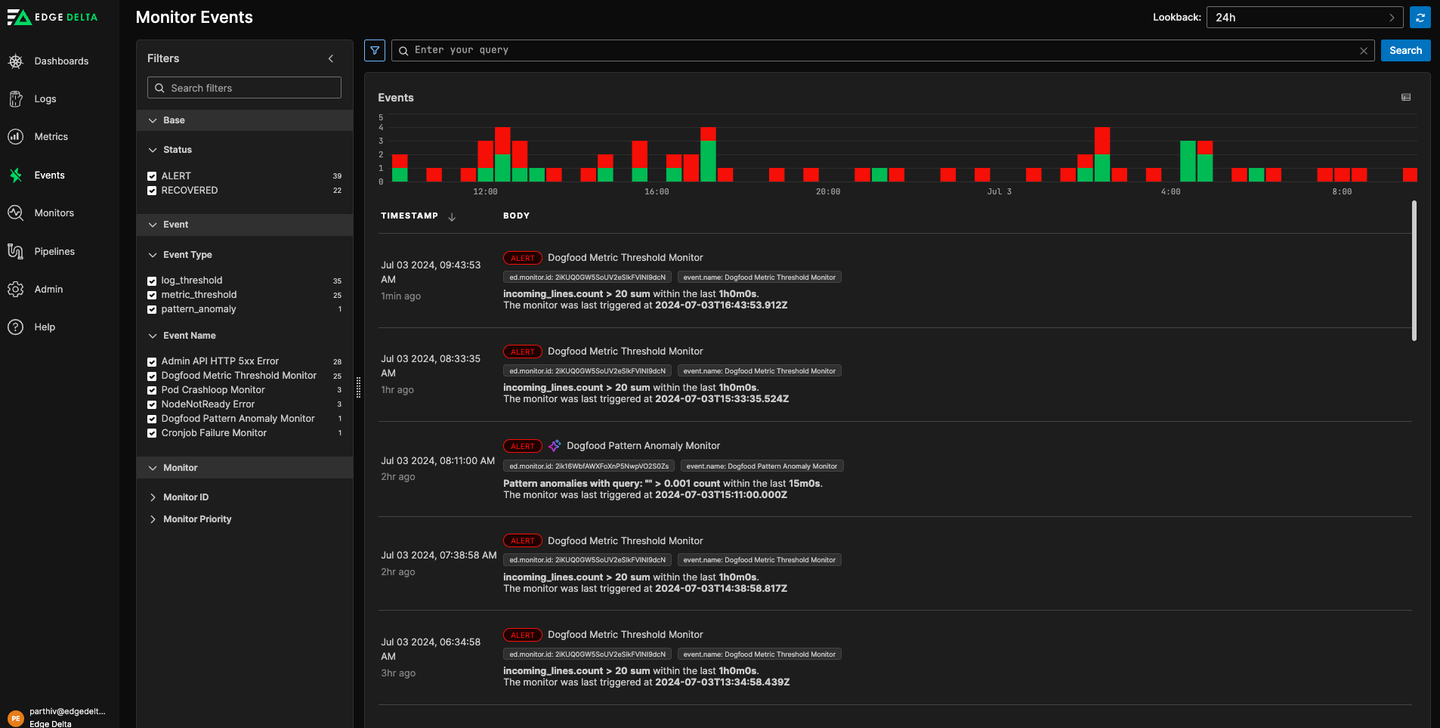
Within this page, users can view monitors with a RESOLVED status (achieved by resolving an alert from within the ‘Monitor Status’ page) or with the standard ALERT or WARN statuses, and can view more monitor-specific information, such as:
- Alert timestamp
- Monitor tags
- Query Information
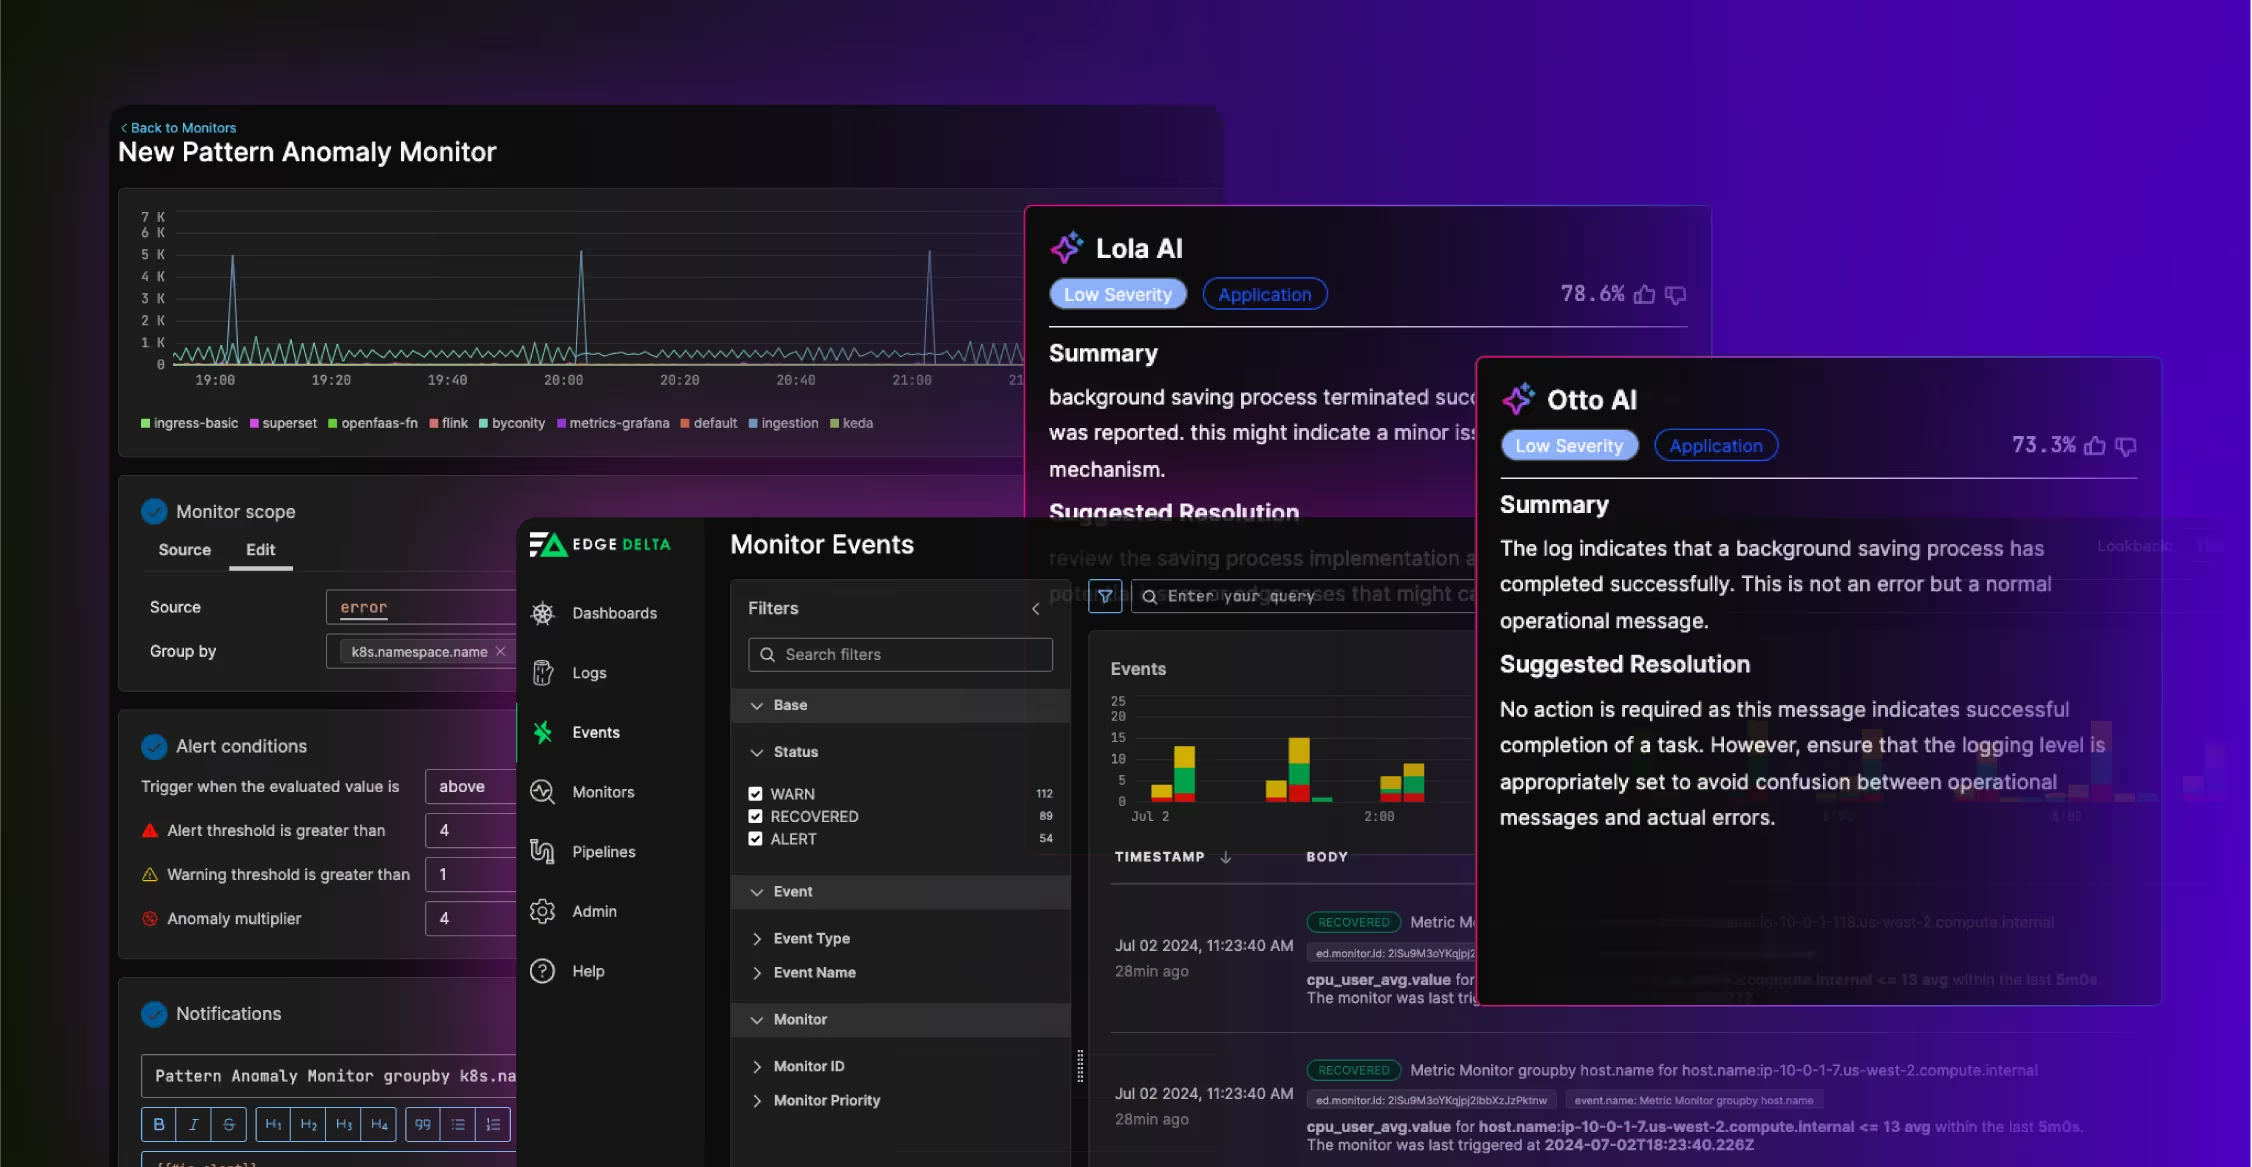
Additionally, the ‘Monitor Events’ page offers both a ‘Summary’ and ‘Attributes’ view for each monitor in your collection. Our ‘Attributes’ page is straightforward, rendering the raw JSON containing all relevant information about the chosen monitor. The ‘Summary’ page, on the other hand, goes deeper:
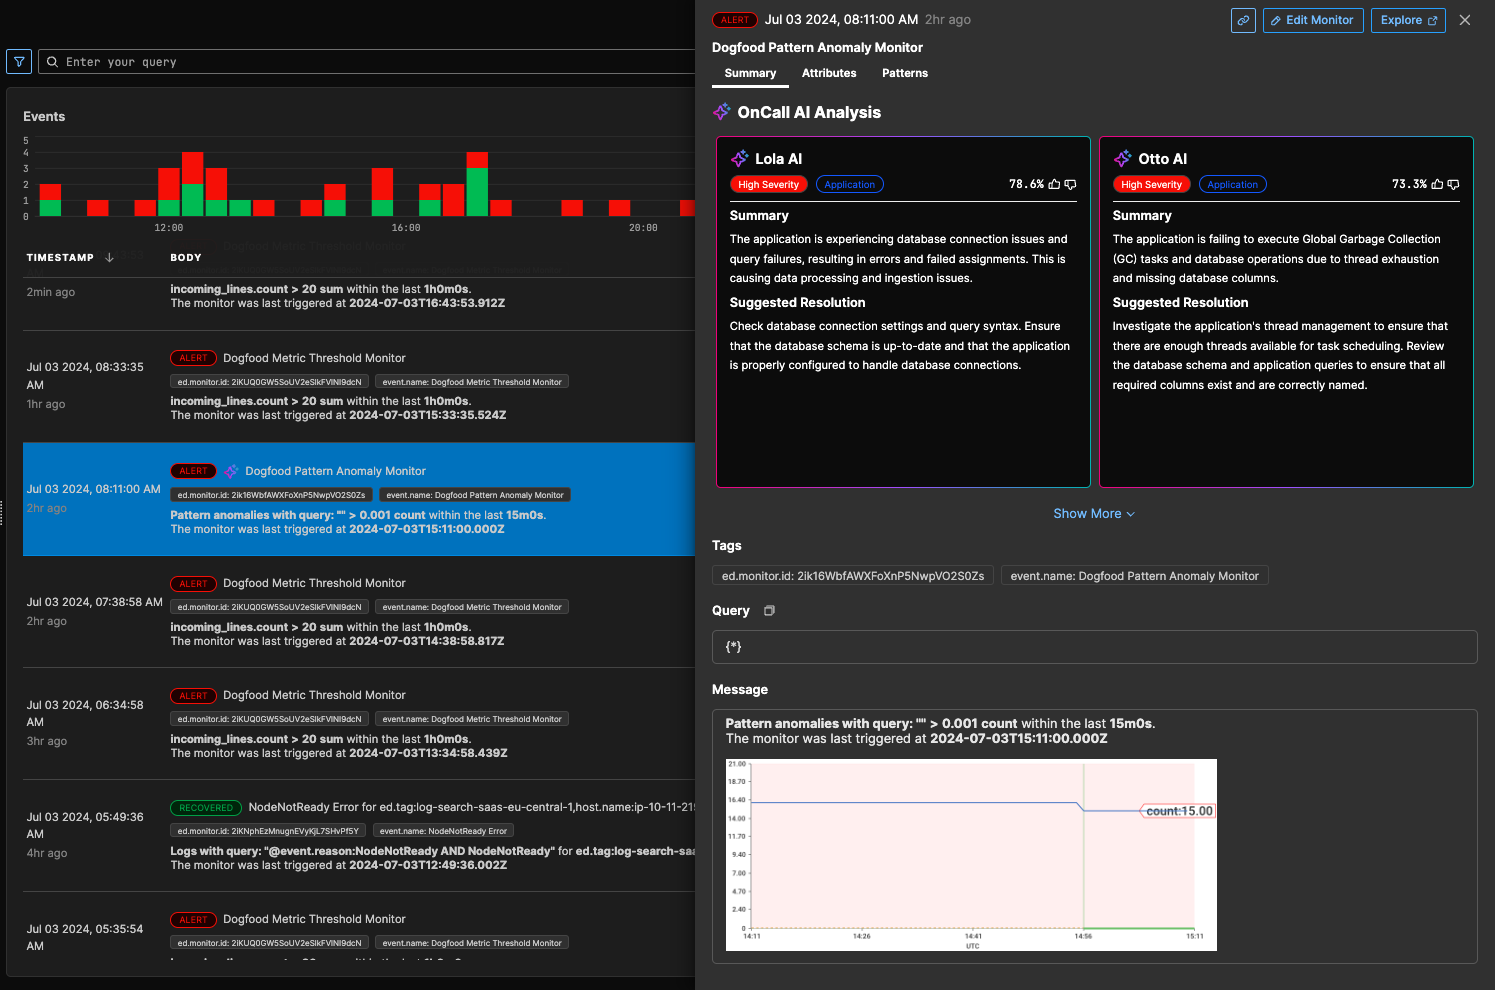
Not only do you see the chosen monitor’s history, with colored cutoffs for different alert conditions, you also receive troubleshooting assistance. Edge Delta’s OnCall AI Analysis tool leverages the power of the strongest LLMs on the market to parse through your monitor alert information, create a relevant summary of the issue, and provide actionable recommendations to solve the problem.
Pattern Anomaly Monitoring
Beyond the standard log and metric threshold monitors, we have added pattern anomaly monitors as a part of our new monitoring experience. Anomaly detection is one of our key differentiators, and with this release we are bringing the best of anomaly detection and monitoring together to you.
Users can now create a pattern anomaly monitor to explicitly track any subset of your pattern collection. They are configured in much the same way as log or metric threshold monitors, and track the counts of negative sentiment logs within the associated patterns.
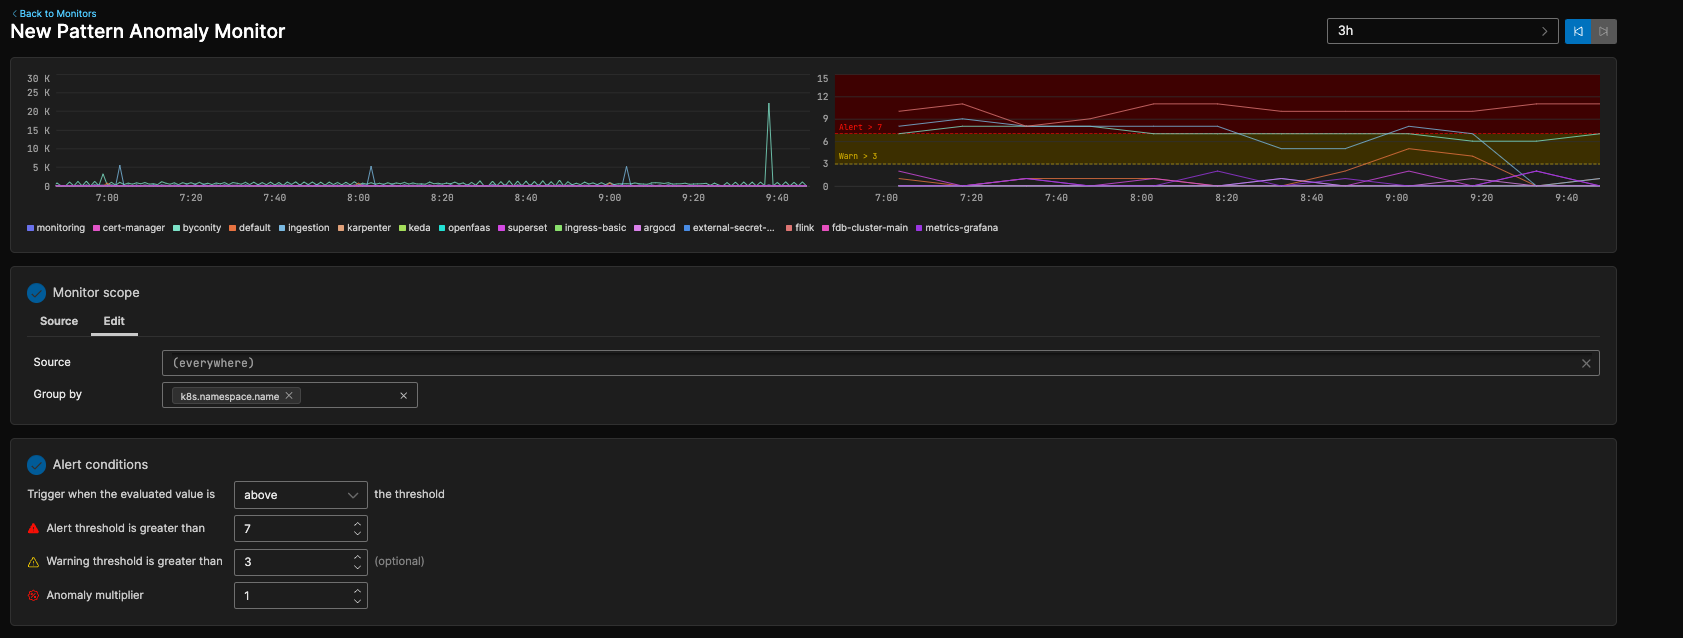
If these counts reach a level higher than the baseline, the monitor will trigger. As with log and threshold monitors, users can configure the grouping or alerting process however they choose.
Getting Started
Our New Monitoring Interface is now live in the Edge Delta Environment. Give it a try!