Picture asking your coding agent “what’s breaking in prod right now?” and watching it actually go find out. It searches your logs, clusters the errors into patterns, investigates relevant traces to find the failing call or service, and comes back with the config change that caused the regression and a rollback ready to run.
That’s what Edge Delta Agent Skills enable. They are a set of SKILL.md modules that drop into the AI agent you already use, Claude Code, Cursor, or Copilot to name a few, and teach it to investigate your telemetry through the edx CLI.
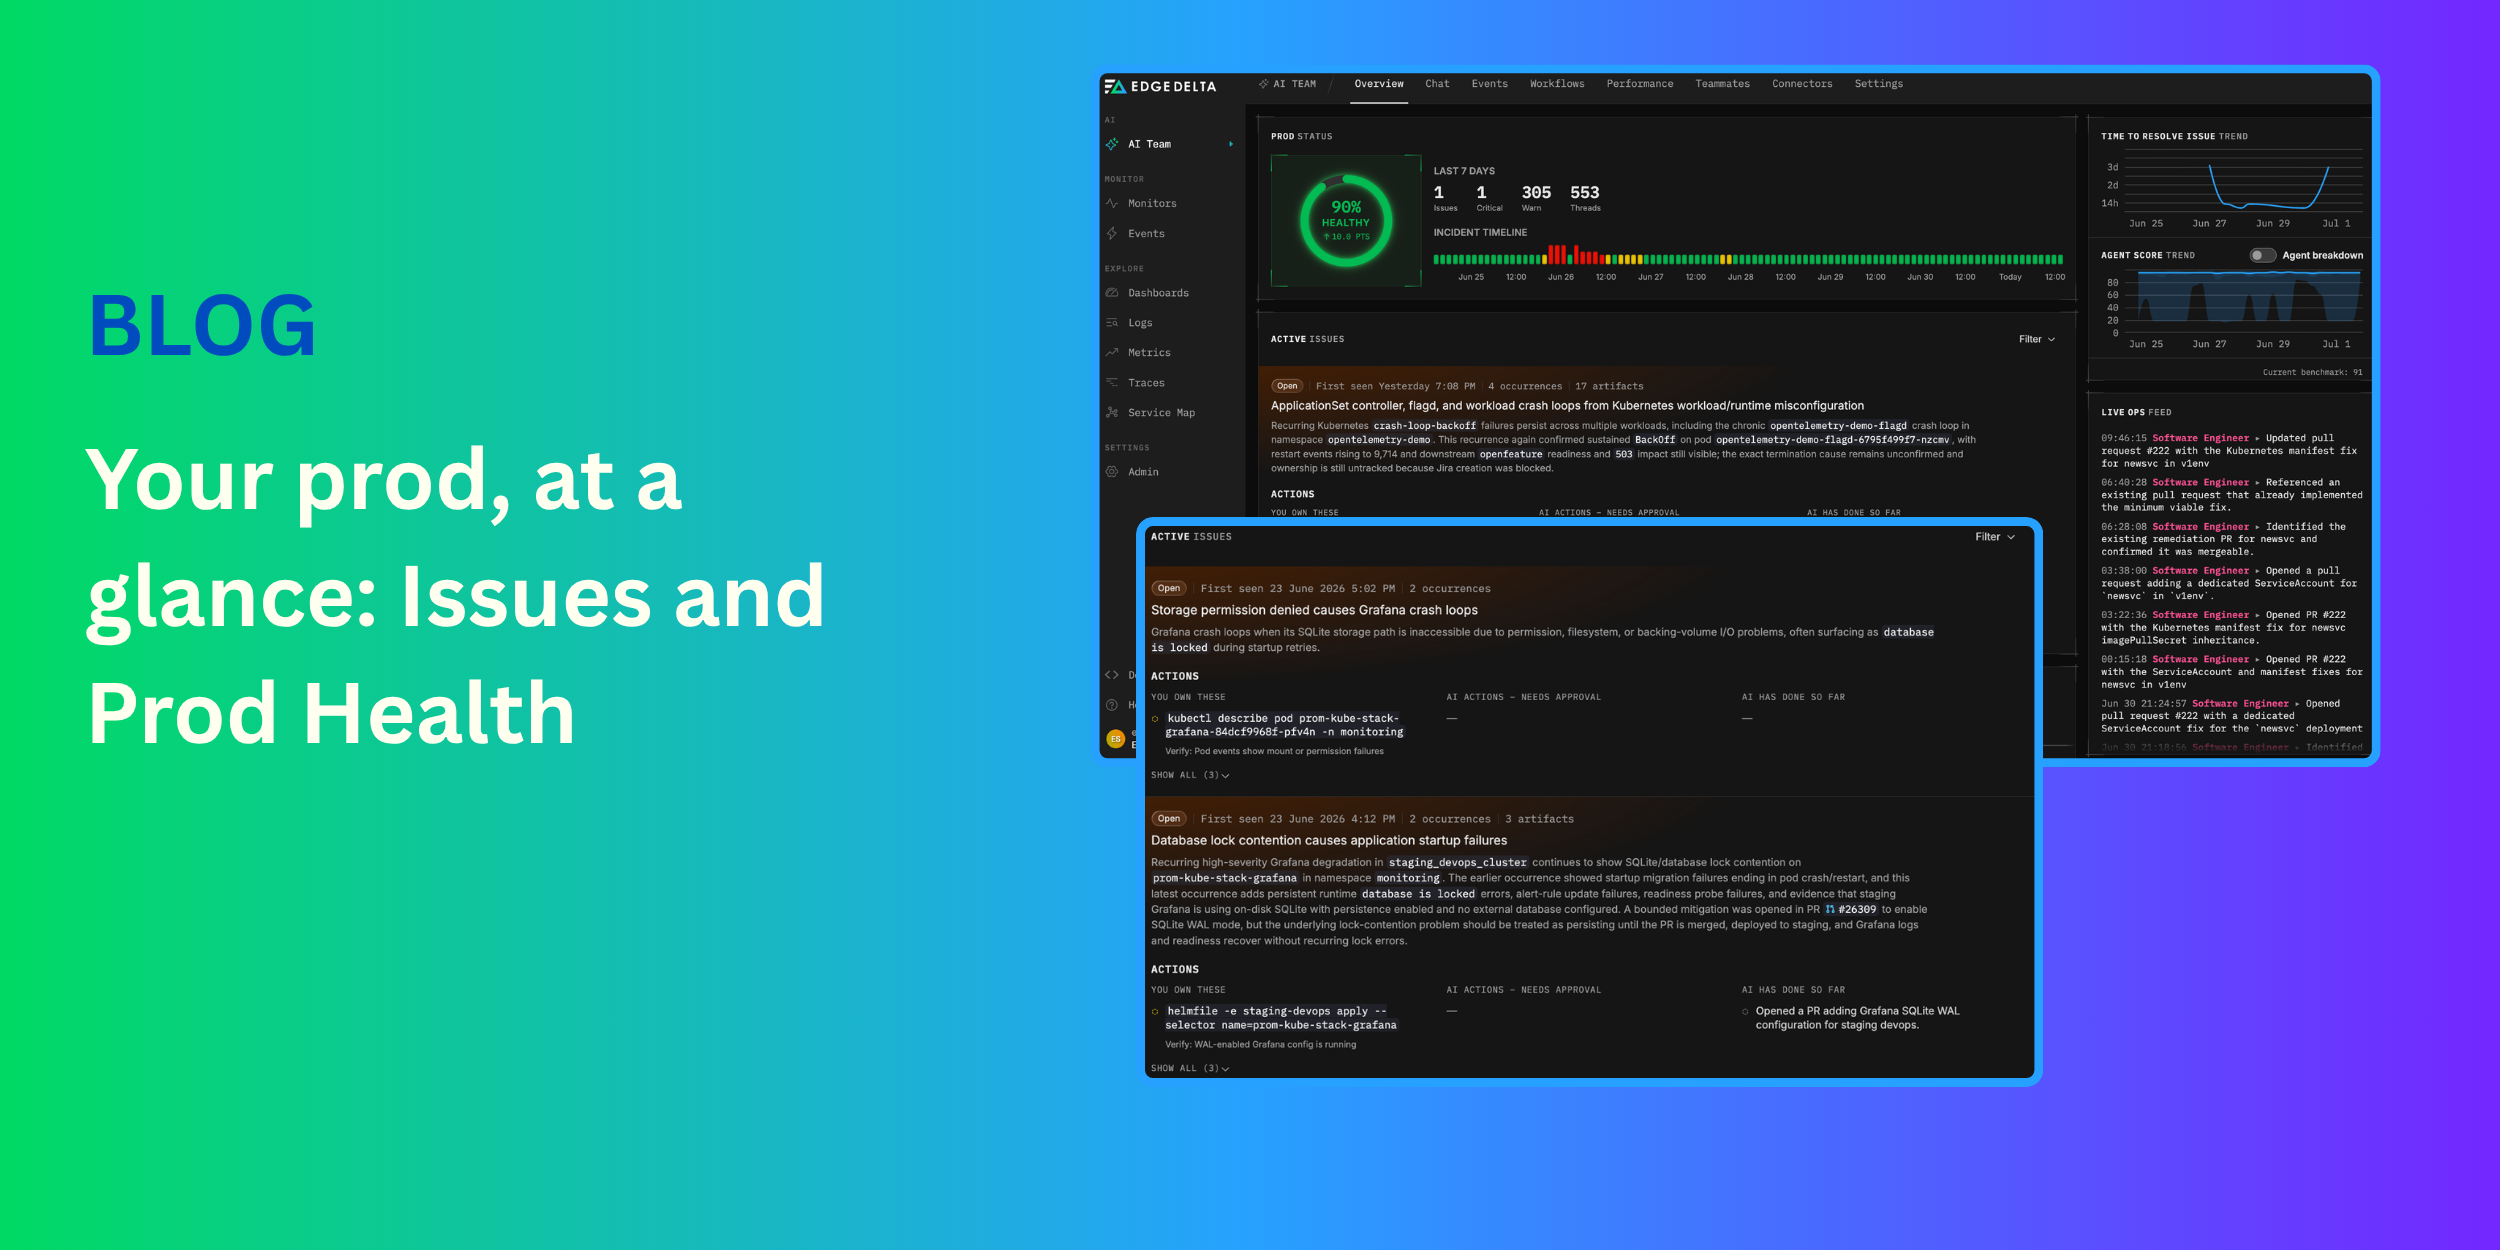
With so much of the modern SDLC powered by AI, it’s critical that developers can unlock insight into the health of their production systems directly from their AI agents, as they have deep context into their environments. Now, with Edge Delta’s CLI tool, instead of switching between chat windows, dashboards, and several different tools to piece together outages or issues, teams can collapse their observability discussions into one centralized conversation alongside software development and resolve incidents in a streamlined manner.
What are Edge Delta Agent Skills?
Agent Skills are modules written in the SKILL.md format, which means they work with Claude Code, Cursor, Copilot, and anything else that understands that convention. Each one teaches your agent a slice of the Edge Delta platform.
There’s a skill for each kind of signal you’d want to look at. ed-logs handles log search with CQL and volume graphs, ed-patterns does log patterns and anomaly and sentiment analysis, ed-metrics discovers and aggregates metrics, and ed-traces covers distributed traces and the service map. Beyond the raw signals, ed-events pulls in anomalies and monitor alerts and Kubernetes events, ed-monitors lets the agent create and resolve monitors, and ed-pipelines handles fleet management, config changes, and live capture. Tying those together is ed-investigate, a cross-signal workflow that runs a full incident investigation rather than a single query, and ed-ai-teammate connects to the AI Teammate side of the platform.
Underneath all of them is edx, the Edge Delta command line interface. It’s a single Go binary that talks to the whole platform, and the skills are essentially structured knowledge about how to drive it well. When your agent runs an investigation, it calls edx under the hood, and the skill is what tells it which commands to reach for and in what order.
Setting up Edge Delta Agent Skills in Your Environment
To begin with Edge Delta Agent Skills, first install edx. The Go toolchain is the quickest path:
go install github.com/edgedelta/edx@latestFrom here, you’ll need to authenticate into your Edge Delta account. OAuth is the default mechanism and the easiest way to get going. Running edx auth login opens your browser, the access token refreshes automatically, and your organization is read straight from the token:
edx auth login
edx auth status
For CI or other automation, an API token works better. Create one in the Edge Delta web app under Admin > API Tokens and pass it with --token, along with --org-id:
edx auth login --token <api-token> --org-id <org-id>If you’d rather not pass the token on the command line, the environment variables ED_API_TOKEN, ED_ORG_ID, and ED_API_URL all override the config file, which is handy in a pipeline.
Then add the skills to your agent. edx installs them for you and auto-detects which agent you’re running, whether that’s Claude Code, Cursor, or Copilot, and drops the files in the right place:
edx skills install
edx skills list
edx skills install pulls in the skill set, and edx skills list shows you what’s available and what’s already installed. The agent picks them up from there and can start running investigations against your org.
Investigating a Real Incident from Your Editor
Say error rates climbed after a recent deployment and you need to investigate further. Rather than opening a dashboard and trying to sift through telemetry yourself, you ask your agent in plain language, right there in Claude Code, something like “what’s causing the spike in errors over the last hour?”
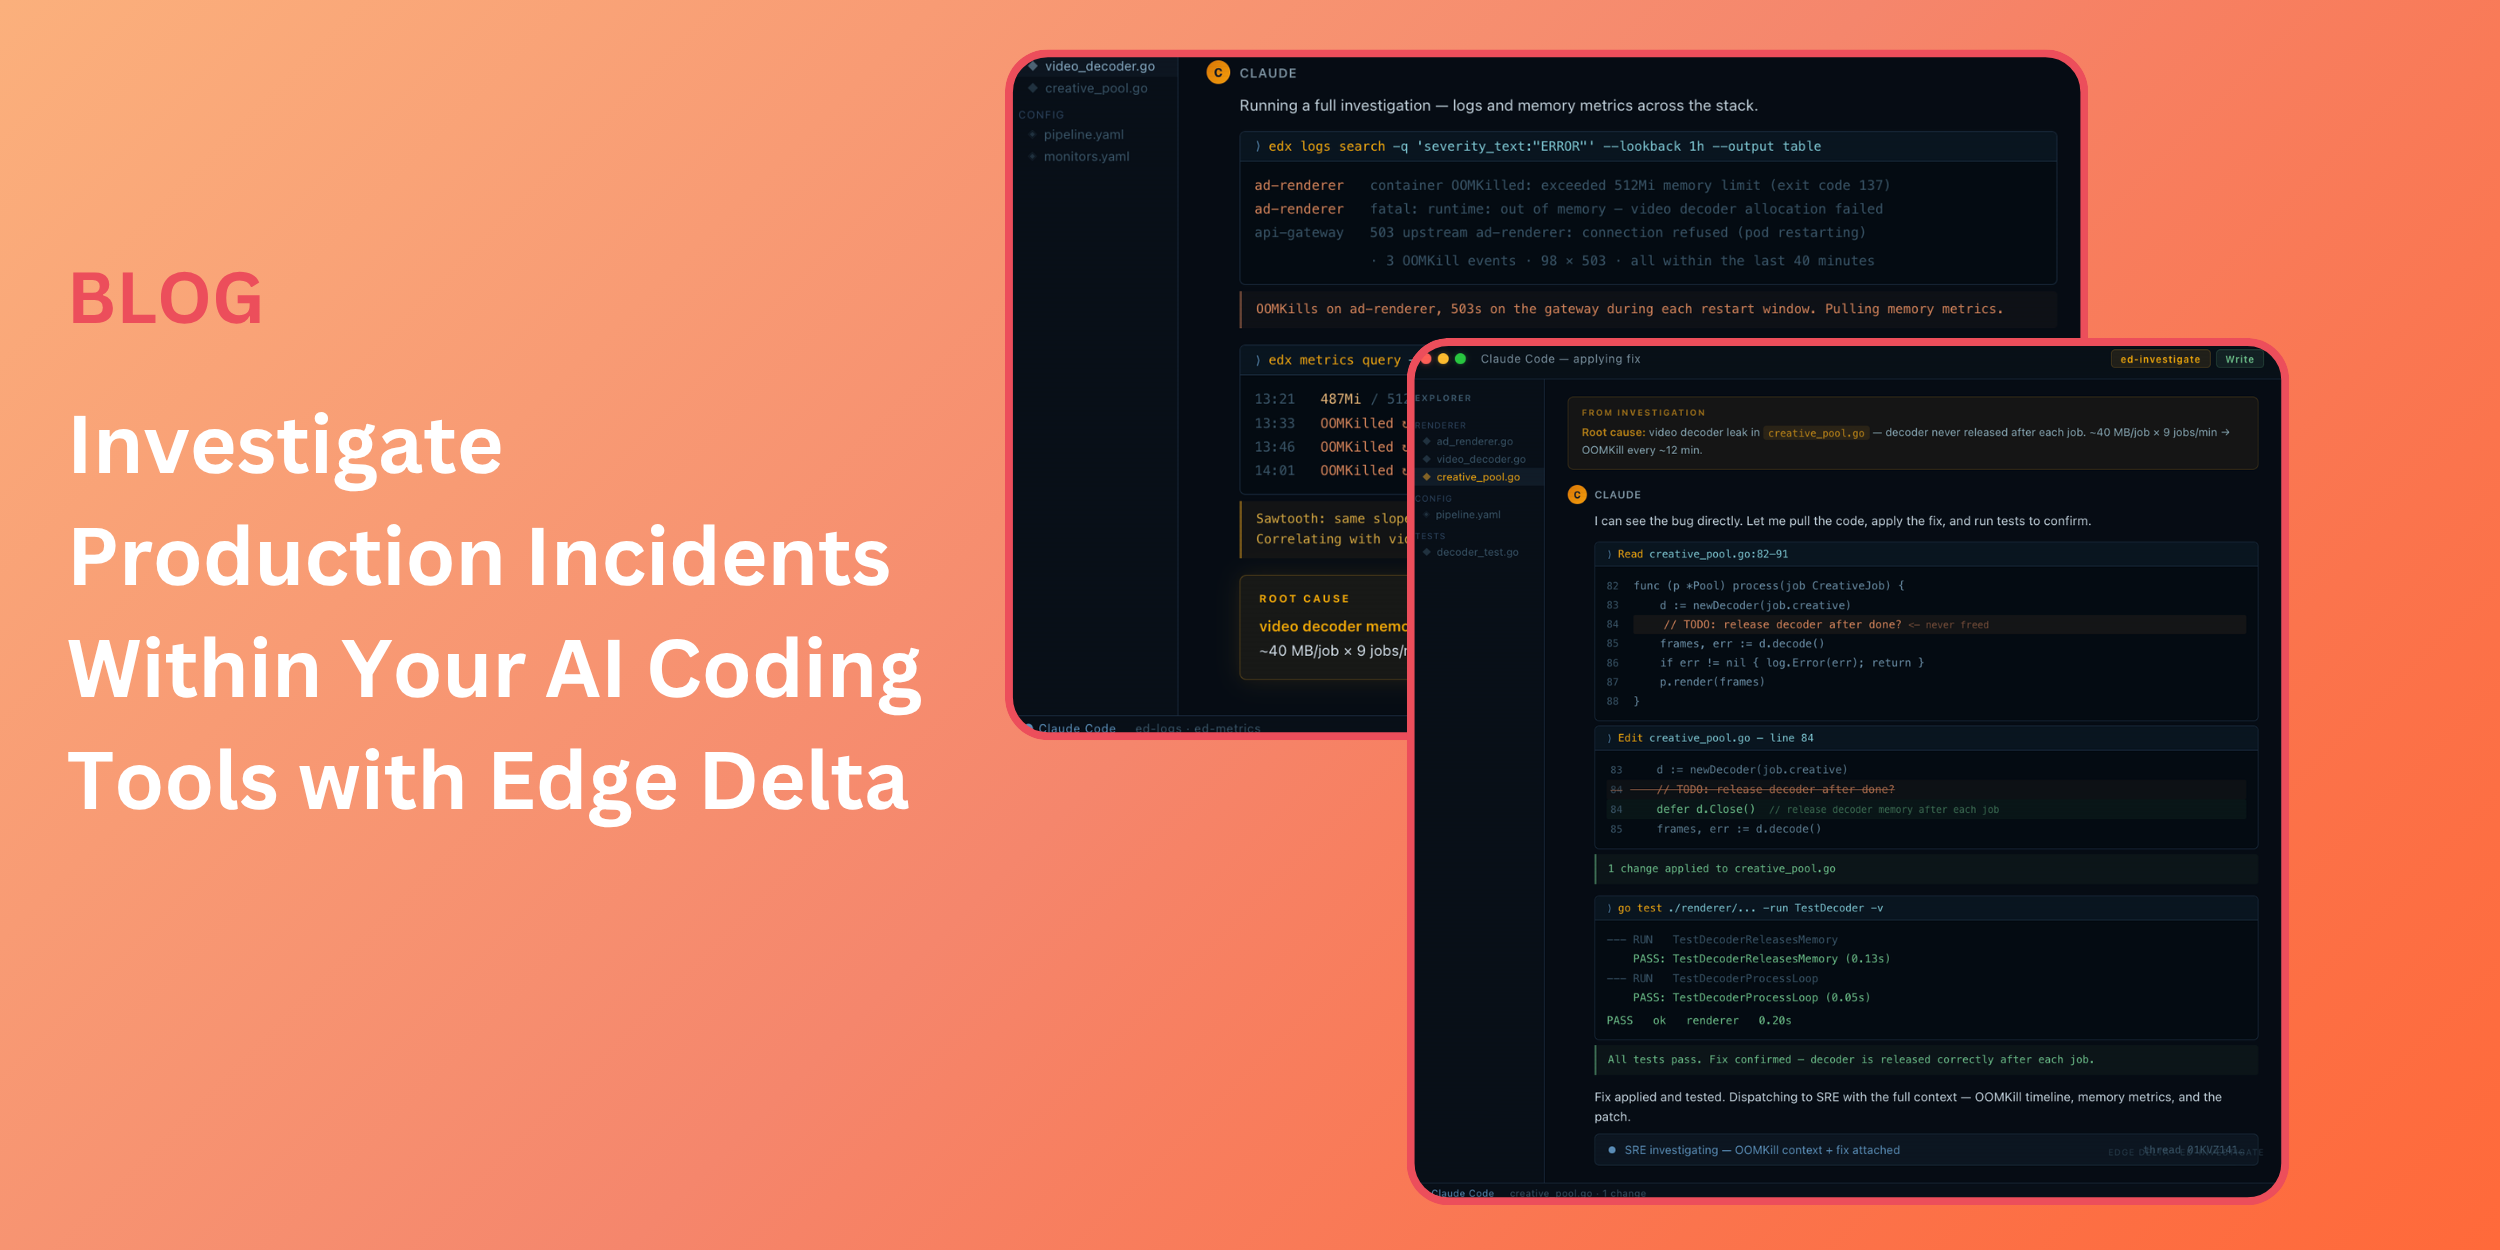
That question becomes a sequence of tool calls you don’t have to write. The ed-investigate skill runs edx logs search against the last hour, pulls structured error-severity events across every service in the stack, and hands back what it found: OOMKill events on the ad-renderer service, three of them in forty minutes, each one followed by a burst of 503s on the API gateway. Ninety-eight 503s total. All tracing back to the same pod.
The agent then pulls memory metrics for the affected pods. The pattern is a sawtooth: memory climbs steadily, hits the 512Mi ceiling, the container gets killed by the kernel, restarts clean at around 160Mi, and starts climbing again. Same slope, same ceiling, every cycle. Roughly twelve minutes between kills.
That regularity is what distinguishes a leak from a traffic spike. If load were driving it, the peaks would vary. They don’t. The skill correlates the climb rate against the ad-renderer’s video processing queue, nine jobs per minute, each allocating around 40MB for the decoder, and identifies that the decoder is never released after each job completes. Memory accumulates until the limit hits, the pod dies, and downstream callers get 503s for the ninety seconds it takes to cold-start again.
The output includes the specific file (creative_pool.go), the specific line, and the fix: a missing defer d.Close() after each processing job. That’s the full arc: question, search, metrics, root cause, fix location, without opening a dashboard or switching terminals. The investigation ran inside the same session where the deployment happened.
The deploy timestamp is the detail that makes this useful. The first OOMKill hit twenty-four minutes after ad-renderer:v2.14.1 shipped. Without correlating logs and metrics in the same query, that connection looks like a random infrastructure event. With it, it’s a regression you introduced and can immediately address.
Try it Yourself
If you already have an Edge Delta org, you’re a few commands away. Install edx, run edx skills install, and ask your agent the kind of question you’d normally open three tabs to answer.
If you’ve never used Edge Delta, you can still try the whole flow. Sign up for a free account, and there’s sample telemetry loaded in so you can run ed-investigate against a real incident without standing up any of your own infrastructure first. It’s the fastest way to see what the agent does before you point it at production.