

Kubernetes has become the standard, with 96% of surveyed organizations either considering or using the container orchestration system according to the Cloud Native Computing Foundation. Yet, logging for Kubernetes environments still presents many hurdles:
- High volumes of data push the limits of traditional observability platforms, in turn inhibiting visibility.
- Staying on top of frequently evolving environments requires teams to constantly update dashboards and onboard new services.
- Understanding the behavior of your services and knowing where an issue is occurring requires teams to be extremely conscious about what they’d like to monitor and alert on.
Today, we’re announcing a set of new features that solve these challenges, making it easy for developers to understand the health of their Kubernetes services – all the way down to the container level and in a highly automated manner.
When you deploy the Edge Delta agent in your Kubernetes environment, it will automatically discover every service and its underlying metadata within seconds. Using this, Edge Delta can build an instant history of service behavior dating back to the service’s initial deployment and create baselines. This functionality unlocks three features that augment the value Edge Delta already delivers to customers:
- Kubernetes Overview to map out your environment and understand its behavior at a high level
- Kubernetes Automated Findings to present insights, such as anomalies and other changes in behavior, and pinpoint the specific components that are affected
- Kubernetes Findings View to route insights to the appropriate team members for response and resolution
Once you install Edge Delta through a simple, single-line DaemonSet, all of these components work natively, out of the box – there’s no additional configuration.
Here’s how the features work at a high level.
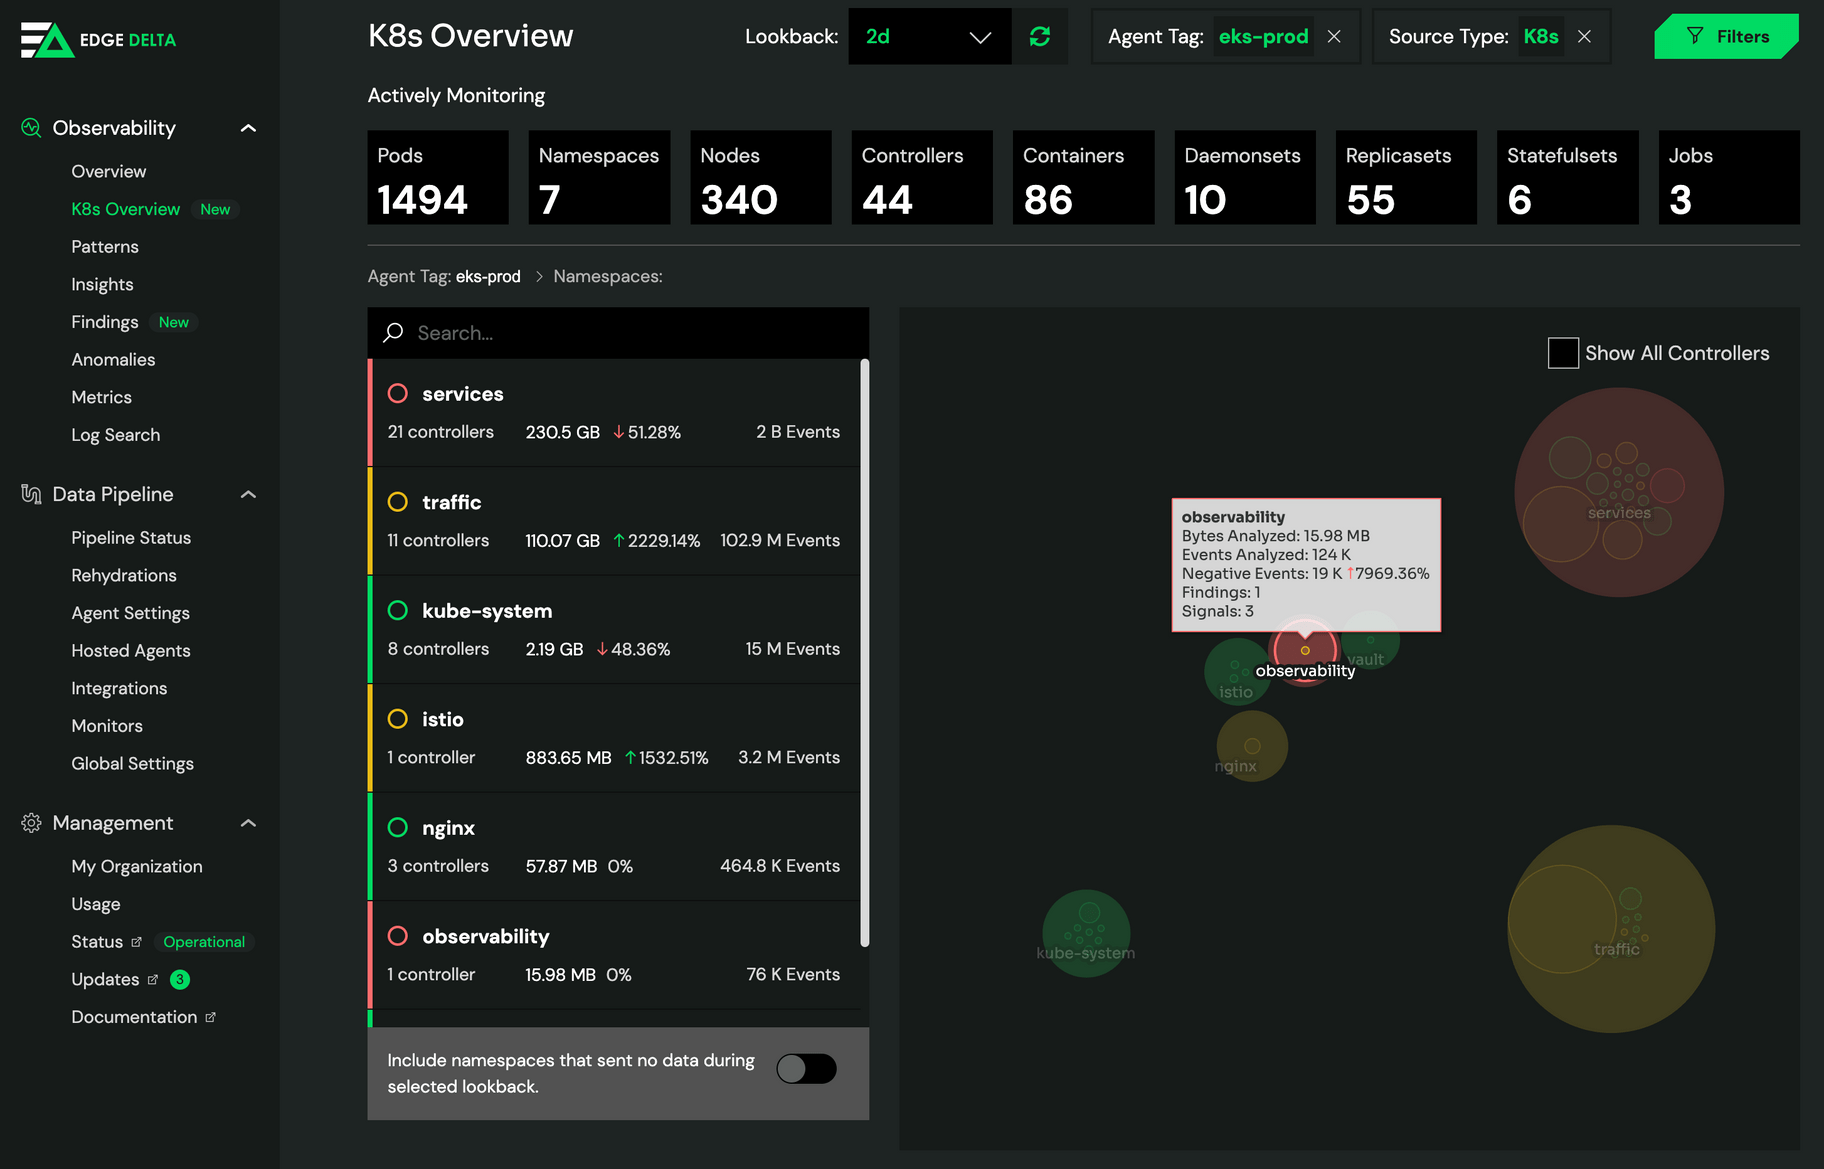
Kubernetes Overview
From the Edge Delta user interface, you will gain a visual map detailing all your Kubernetes clusters and the resources within them. This helps your team understand what services are being monitored, what components they consist of, and what their behavior is at a high level. From this screen, you can drill down into individual components to gauge their health or quickly navigate into the component’s log patterns.
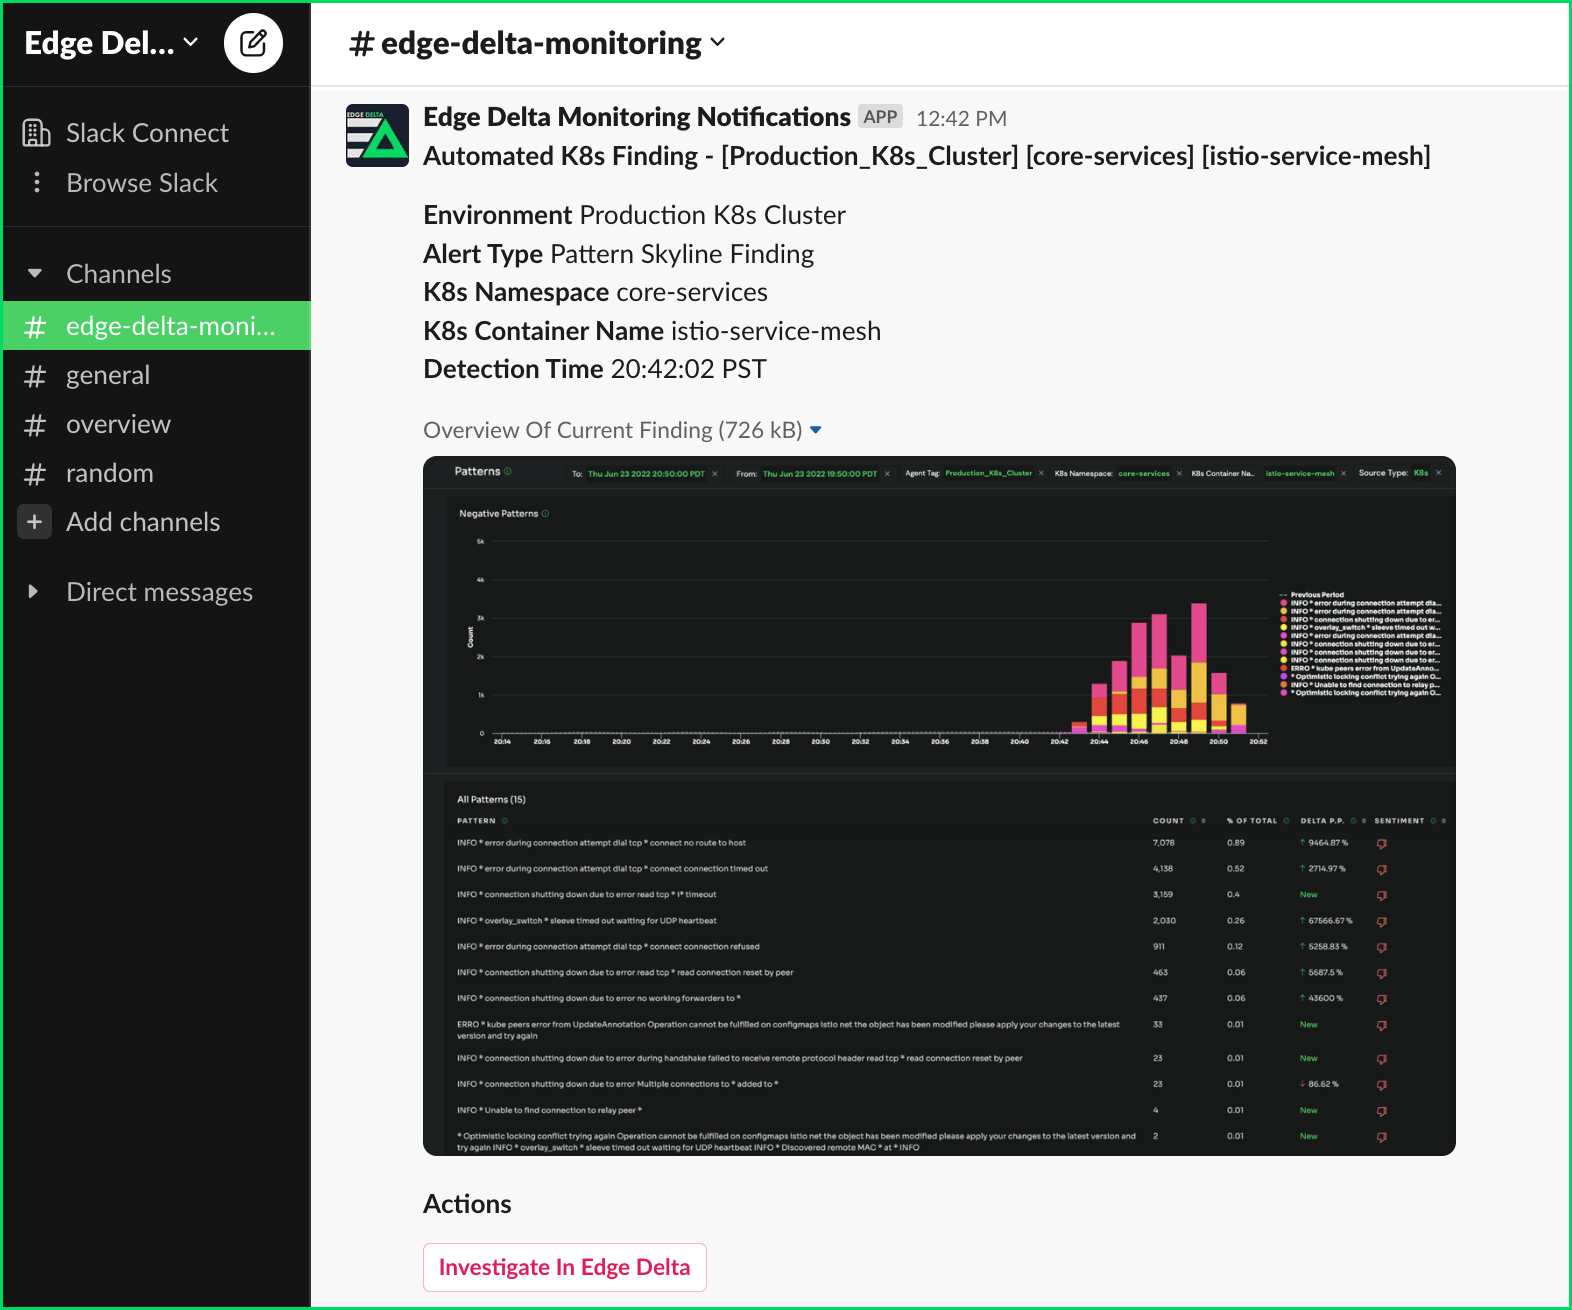
Kubernetes Automated Findings
As Edge Delta baselines the behavior of your Kubernetes components and understands what is “normal,” it can also easily identify anomalous behavior. If an anomaly or otherwise interesting event is detected, Edge Delta will trigger an alert that provides context into the affected components – without you having to set up said alert ahead of time. This feature helps your team more quickly identify and resolve issues by showing you exactly where the incident is occurring and what raw data is tied to it.
Kubernetes Findings View
The Automated Findings detailed above are also surfaced within Edge Delta through our Findings View. The main purpose of this screen is to simplify the process of routing insights to your teammates – in a matter of clicks, you can share any Finding with the appropriate party. Additionally, from this screen, you can organize behavior by native components, such as namespaces or containers. This makes it easier to collaborate with your peers and resolve issues faster.
Through these updates, Edge Delta gives your team always up-to-date observability into all of your Kubernetes resources. All of this – from the Kubernetes Overview topology to baselining environments for future anomalies – happens within seconds. Furthermore, because this information is presented so intuitively, your developers are equipped with the information they need to resolve issues, without leaning on DevOps or SRE team members.
Ultimately, this means your developers can spend more time focusing on building great software, and less time setting up alerts or troubleshooting issues.
If you’d like to see these updates in action, you can start a free trial.


