As users continue to rely on the containerization of apps for deployment and handling the complexities of Microservice architectures, along with providing distributed tracing functionalities, understanding the container observability process is crucial for maintaining performance and condition. This article goes into greater detail about what container observability looks like in practice, including its principles, challenges, and solutions.
Key Takeaways
- Container observability refers to the process of tracking and monitoring containerized applications to understand their behavior and performance better.
- Observability plays a crucial role in emitting outputs that expose the sequence of events and the state of the internal system used by IT developers and other users.
- Leveraging container observability is essential for optimizing the complexity of container environments, improving performance monitoring, and ensuring compliance and security.
- Achieving effective container observability requires employing a series of strategies, including implementing monitoring tools and instrumenting applications.
- Container observability faces challenges related to the increasing data volume and velocity, the dynamic and temporary nature of containers, and the complexity of Microservices.
What is Container Observability?
In IT and DevOps operations, observability plays a crucial role in emitting outputs that expose the sequence of events and the internal system state. Additionally, observability has become prominent due to the increasing adoption of cloud-native architecture.
Containers, being a core component of many cloud-native applications, require robust observability to ensure optimal performance and reliability. Container observability involves using specialized tools to monitor and analyze containerized applications. These tools collect data to identify issues, trends, and threshold triggers, focusing on the behavior and performance of containers, underlying infrastructures, and resource usage.
These tools gather data on:
- Container behavior and performance
- State of underlying container infrastructure
- Resources consumed by containers
To name a few. Below is an in-depth explanation of why container observability is essential and ways to leverage its capacity.
Why is Container Observability Important

Container observability involves using specialized tools to monitor and analyze containerized applications. These tools collect data to identify issues, trends, and threshold triggers, focusing on the behavior and performance of containers, underlying infrastructures, and resource usage.
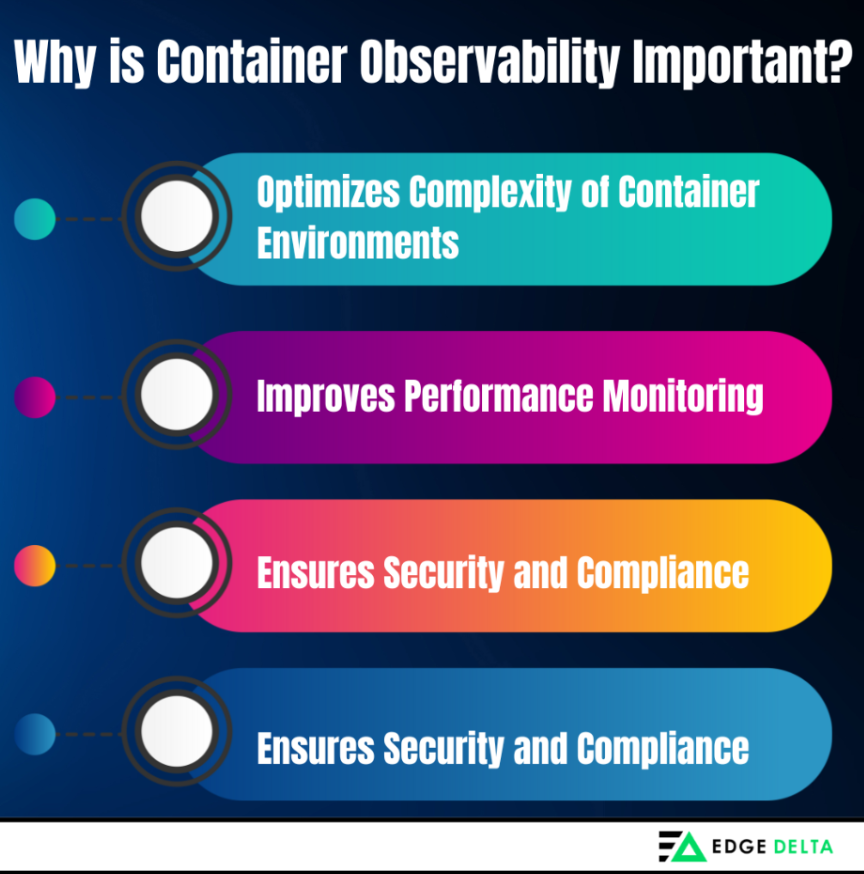
A container orchestration system can propagate and terminate containers based on internal and external factors. Naturally, to improve cloud observability, you need effective container observability. Container observability:
- Optimizes complexity of container environments.
- Improves performance monitoring and pipelines.
- Ensures compliance and security.
- Enables the identification, troubleshooting, and debugging of issues.
Container observability upgrades operational insight, simplifying diagnosis and accelerating issue resolution. It offers real-time visibility into containers, making proactive management feasible and improving overall application performance.
In the following section, we will explore the value of container observability connecting to and monitoring your systems.
Note
You can find third-party tools to help you enhance your monitoring capabilities for your containerized apps. For instance, you can use Edge Delta’s observability pipelines to reduce your observability costs. It processes data immediately after it’s created, allowing you to route processed data instead of raw data to your preferred destination, simplifying monitoring for applications, containerized or otherwise.
Optimizes Complexity of Container Environments
Containerization increases system complexity over time, so complex container environments require strong observability solutions. Container observability can offer real-time insights into dynamic and diverse infrastructure. Additionally, it provides continuous monitoring of container states, making detecting and diagnosing issues far easier. This process covers:
- Resource utilization
- Interactions
- Issues and anomalies
Container visibility aids in the understanding of intricate dependencies and performance bottlenecks within Microservices architectures. The level of insight observability ensures that applications run efficiently, support optimal performance, and minimize downtime — all of which are essential for maintaining the reliability and scalability of containerized environments.
Improves Performance Monitoring
Observing container behavior and understanding workload patterns are necessary to make proactive adjustments to enhance performance. There are instances wherein, if a specific container consistently demands more resources during a particular time of day, resources can be pre-allocated in anticipation. Conversely, resources can be scaled down during periods of low demand. Such dynamic adjustments, alerted by container observation, can lead to more efficient system management.
Identifying issues and inefficiencies in the application ensures optimal resource utilization, contributes to an improved user experience, and lowers the chances of downtime.
Ensures Security and Compliance
Monitoring security and compliance that adhere to the standards of containerized applications is crucial, especially in detecting system vulnerabilities and unauthorized access attempts.
The container observability approach collects and analyzes data from the containers and the surrounding environment. This data information is then used to identify and proactively address potential security and compliance issues.
Identify, Troubleshoot, and Debug Issues
Microservices are often run within containers, which can result in straightforward pinpointing of which specific service or containers are causing a problem. Container observability tools like Edge Delta provide enhanced logging and tracing capabilities to help streamline the troubleshooting process. The corresponding logs, combined with real-time metrics, provide developers and operations teams the ability to easily locate the root cause of issues effectively, which results in much shorter debugging time.
Structured logs across containers ensure consistency and ease of understanding, making troubleshooting faster and more effective. It facilitates identifying issues that arise in production, which includes:
– Slow performance
– Errors
– Downtime
– Root cause
– Health anomalies
Discover effective measures for leveraging container observability in the following section.
How to Achieve Effective Container Observability
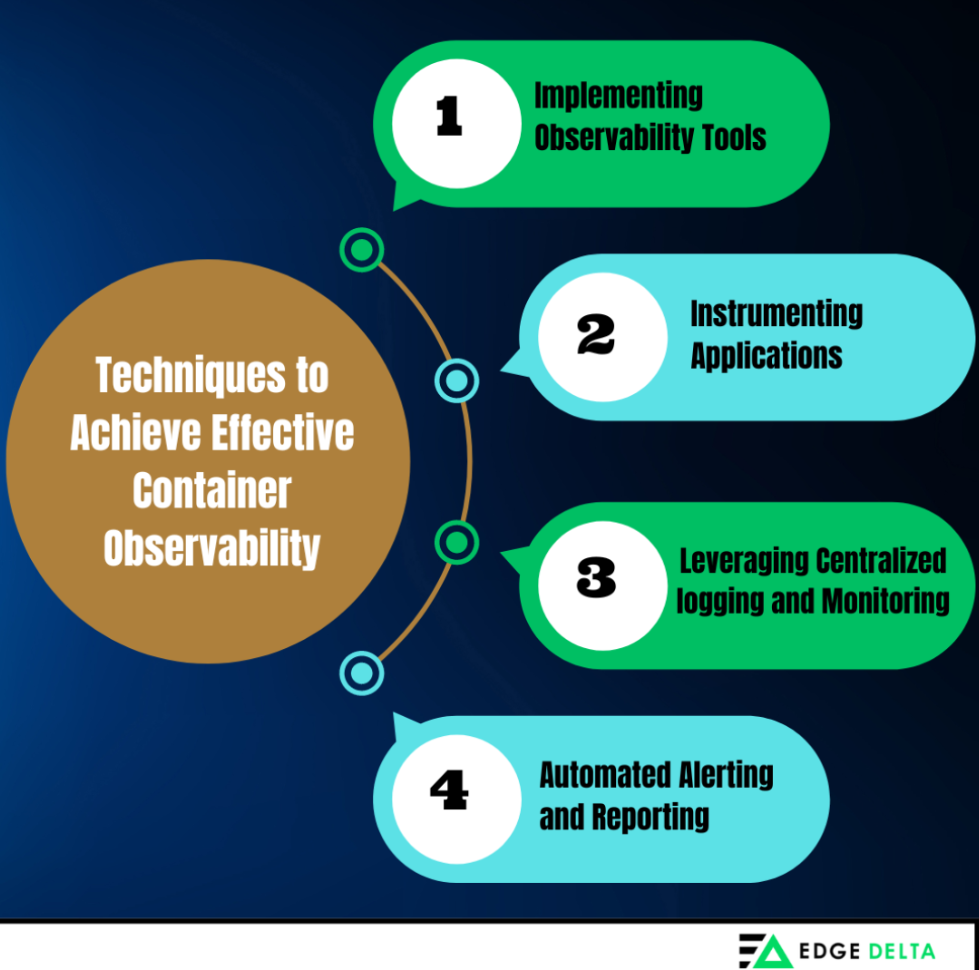
Achieving efficient container visibility requires a series of strategic steps and an approach that guarantees comprehensive monitoring, tracing, and logging of the containerized applications used by your organization. These approaches typically include the following:

Implementing Observability Tools
Implementing the right tools is the first step towards achieving effective observability. Container observability tools help DevOps teams and IT developers monitor the activities of running containers, and as a result their telemetry data as well. Additionally, they can analyze data to provide observability and insights into container performance.
Here are some tips for selecting and integrating observability tools tailored for container environments:
- Select the appropriate container observability tool to integrate with your organization’s orchestration platform.
- Trace the tool’s performance metrics and network traffic.
- Choose tools which have configurable alerts for any performance issues and anomalies, which can enable responses.
Pro Tip
When using container-based platforms, you can leverage third-party tools for monitoring. For instance, you can use tools like Edge Delta to monitor Docker containers. This tool lets you analyze logs and metrics collected by other containers to stream to your preferred destination.
Instrumenting Applications
Instrumenting applications is crucial for observability as it captures telemetry data generated by your code. The process involves instrumenting your application code to emit trace data. This approach allows DevOps to gain insight into infrastructure performance—many SDK libraries, OpenTelemetry API, and code-less agent-based tools facilitate this instrumentation.
The containerized data instrumentation process involves two methods organizations can use:
- Automatic Instrumentation: This allows users to leverage open telemetry cluster libraries to instrument the organization’s application and provides insights directly on the team portal, including automated libraries.
- Manual Instrumentation: Codes can be manually written into the organization’s applications using SDKs and APIs to emit and capture trace data.
Leveraging Centralized Logging and Monitoring
Centralized logging and monitoring requires the aggregation of logs from various containers, ensuring that logs include relevant metadata. This data is essential for easier troubleshooting and includes:
- Container ID
- Service name
- Timestamps
By centralizing logging and monitoring, observability efforts are streamlined, enabling DevOps teams to track error reporting and related data centrally. Implementing centralized logging involves:
- Aggregating Logs: A centralized logging system collects logs from all containers. This step can be done using tools like the ELK Stack, Logstash, Fluentd, and more.
- Include Metadata: Ensure that logs contain relevant metadata.
- Log Management: Regularly organize and analyze logs to detect patterns and issues.
Automated Alerting and Reporting
Automated alerting and reporting are significant factors that enhance proactive management. This method ensures that the organization’s development team is promptly notified of any issues or anomalies, enabling quick response and resolution. It includes:
- Automated Reports: These reports regularly update the containerized applications’ health performance, offering a comprehensive overview of the telemetry data present in the application.
- Define Alerts: This uses thresholds to activate alerts when metrics exceed acceptable limits. Alerts are set based on key performance indicators (KPIs) such as CPU usage, memory consumption, and response times.
- Notification Channels: Incorporate alerting systems with notification channels like email, Slack, or PagerDuty to ensure timely notifications suitable for team members.
In the following section, learn about the challenges of observability containers and the possible solutions users can use to improve their data infrastructure.
Challenges in Container Observability + Solutions
Performance management among containerized applications has continued to become more challenging. Application observability, monitoring, and performance tuning are much more difficult within containerized environments. Here is a breakdown of some of the most common container observability challenges, along with some potential solutions:
| Challenge | Description | Potential Solutions |
|---|---|---|
| Data Volume and Velocity | Refers to the increasing volume and velocity of data in container environments | Efficient Data Analysis, Scalable Data Storage Solutions, and Data Aggregation |
| Dynamic and Ephemeral Nature | Refers to the container’s ephemeral nature, which makes maintaining consistent observability and tracking transient issues challenging | Orchestration Integration, Persistent Storage, and Service Discovery |
| Microservice Complexity | Microservice architecture and distributed system adds layers of complexity to containerized applications | Centralized Monitoring, Distributed Tracing, Correlation ID Employment |
| Tool Integration and Overhead | Integrating multiple observability tools can be complex and add container overhead | Unified Observability Platform Integration, APIs and Standard Protocols, Regular Audits |
To develop practical solutions for container monitoring, IT teams must first understand why maintaining visibility and optimizing application performance within containerized environments are uniquely challenging.
Increasing Data Volume and Velocity
The increasing volume and velocity of data in container environments present challenges in managing and analyzing large volumes, including log metrics and traces of real-time observability data. The data’s high volume and velocity make it challenging to collect, store, and analyze information in real-time.
Possible solutions for data volume and velocity include:
- Efficient Data Analysis: Integrate analytical platforms like Edge Delta that support stream and batch processing to identify anomalies in datasets and patterns in real-time.
- Scalable Data Storage Solutions: Deploy scalable storage systems to handle large amounts of data, providing efficient search capability.
- Data Aggregation: Reduce the data volume and ensure relevant information is prioritized. Data aggregation tools collect and process data before storing it.
Dynamic and Ephemeral Nature of Containers
Containers are ephemeral in nature, often being created and destroyed within short periods. This approach often involves different sets of tools, workloads, and technologies, including:
- Container runtime
- Types of containers
- Operating systems
The container’s ephemeral nature makes maintaining consistent observability and tracking transient issues challenging. The following are possible solutions for container observability’s dynamic and transient nature:
- Orchestration Integration: Integrate observability tools with container orchestration platforms like Kubernetes, which can provide context and metadata for dynamically created containers.
- Persistent Storage: Ensure logs and metrics are stored in persistent volumes, even if containers are temporary, to maintain historical data for analysis.
- Service Discovery: Use service discovery tools to automatically detect and monitor newly created containers. Tools like Consul or Kubernetes’ native service discovery features can help maintain visibility.
Complexity of Microservices
Microservice architecture and distributed systems add layers of complexity to containerized applications. Observing interactions and dependencies between multiple microservices and identifying trends across the system has become more challenging.
To address the interactions and identification challenges faced with complex microservices, here are some solutions that IT developers and teams can integrate:
- Utilize Centralized Monitoring: Aggregates data from all microservices into a unified system view.
- Implement Distributed Tracing: Utilize tools like Jaeger or OpenTelemetry to track requests and identify bottlenecks propagating through different microservices.
- Employ Correlation IDs: Trace requests across different microservices, ensuring organizations can follow a single request through multiple services and pinpoint where issues occur.
Pro Tip
You can leverage tools like Edge Delta when using OpenTelemetry or Jaeger as you implement distributed tracing. With this tool, you can simplify OpenTelemetry adoption and log data investigation while avoiding potential vendor lock-ins.
Container Observability Tool Integration and Overhead
Integrating multiple observability tools can be complex and add container overhead. Issues related to tool integration, data silos, and the operational overhead of managing observability tools can hinder effective observability.
Organizations can use these solutions to leverage tools and help minimize these overhead issues:
- Unified Observability Platforms: Consider tools that offer integrated solutions using unified observability platforms that combine logging, monitoring, and tracing capabilities—Datadog and Splunk are two examples.
- APIs and Standard Protocols: Leverage standard protocols and APIs to integrate different observability tools.
- Regular Audits: Perform regular audits of your observability stack to identify and eliminate data silos and ensure efficient tool integration.
Implementing instrumented applications and tools that leverage centralized logging and monitoring helps to achieve effective container observability. Additionally, this comprehensive approach offers the visibility and insights necessary to maintain performance and surpass security challenges.
Wrap Up
Addressing the challenges of containerized observation is critical to achieving practical observation and ensuring that applications are efficiently monitored, traced, and logged comprehensively. Container observability excels in managing the complexities of microservice architectures and provides essential distributed tracing functionalities, making it a superior solution for modern, dynamic applications.
FAQs on Container Observability
What is observability in Kubernetes?
Kubernetes observability is gaining insight into the behavior and performance of applications running on the Kubernetes system.
What is the use of observability?
Observability allows IT developers and DevOps teams to understand system performance, receive alerts or issues, and provide solutions to improve performance and impact users.
How does container monitoring work?
Container monitoring solutions use metric capture, analytics, transaction tracing, and visualization to monitor the health and effectiveness of containerized applications.
What is a container, in simple words?
Containers are logical groupings of software that store all the necessary elements to run on any environment or infrastructure.


