

Application Performance Monitoring (APM) has evolved significantly as applications themselves have become more distributed. Early tools focused on host-level metrics, such as CPU, memory, disk, and basic uptime, to answer a simple question: is the system up or down? But as distributed systems and cloud-native architectures have become the norm, these coarse signals have become insufficient for understanding why a request is slow or failing.
Modern applications span many services, runtimes, and infrastructure layers, requiring richer signals such as distributed tracing, structured logs, and high-cardinality metrics to follow individual requests across service boundaries. While powerful, these capabilities often introduce proprietary agents, vendor lock-in, and inconsistent data models.
The OpenTelemetry (OTEL) Java Agent was created to address these challenges with a vendor-neutral, standardized approach to instrumentation. By attaching to the JVM, the agent automatically instruments popular Java frameworks and libraries — without code changes — to generate consistent traces, metrics, and logs that follow open semantic conventions. This abstracts the how of instrumentation while standardizing the what of telemetry data, enabling deep visibility without sacrificing portability, interoperability, or long-term flexibility.
In this blog post, we’ll walk through three deployment scenarios for collecting OpenTelemetry traces from a simple Java app with Edge Delta’s Telemetry Pipelines. Once this normalized trace data is ingested, it can be filtered, processed, enriched, and visualized — and used to power agentic workflows with Edge Delta’s AI Teammates.
Basic Concept and Architecture
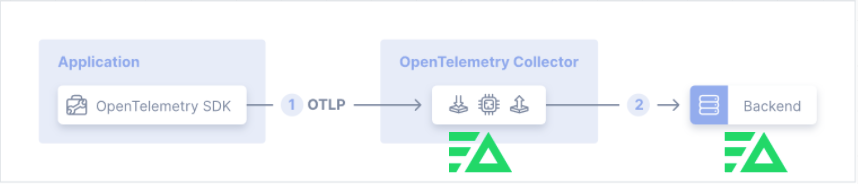
At a high level, the architecture we’ll use in this post consists of a Java application running on a host or Kubernetes, with:
- The OTEL Java Agent attached to the JVM for auto-instrumentation
- Telemetry exported via OTLP (gRPC or HTTP)
- The Edge Delta Agent acting as an OTEL Collector and serving as the control and optimization layer
Conceptually, the OTEL Java Agent uses auto-instrumentation to collect traces (and optionally metrics and logs) without requiring code changes — and then exports this telemetry data via OTLP to the Edge Delta Agent. The Edge Delta Agent performs filtering, aggregation and metricization, enrichment, sampling, and routing as close to the source as possible before sending the data to one or more backends, including Edge Delta’s own Observability Platform.
You’ll see this same pattern repeated across the three deployment scenarios below. The primary differences are where the Edge Delta Agent runs and which OTLP endpoint the Java application targets.
Demo Application and Setup
For this example, we’ll use a simple Java web application that is automatically instrumented using the OpenTelemetry zero-code Java Agent, which can be downloaded here. The application generates spans for both the embedded HTTP server handling incoming requests and the JDK HTTP client making outbound calls to httpbin.org, all without requiring any changes to application code.
As you interact with the application, each click produces spans for the inbound request and the corresponding outbound call. These spans are exported to the configured backend via the OTEL Java Agent, so be sure to keep the JVM (and browser) running long enough for the exporter to flush telemetry data before shutting down the demo.
This setup is consistent across all three deployment scenarios, and the example source code can be found in this repository.
OTEL Java Agent Configuration
This demo uses environment variable–based configuration for the OTEL zero-code Java Agent. If you prefer to test with direct command-line options, you can follow the directions in our documentation. For more advanced, code-based Java application tracing to Edge Delta, see the Java instrumentation guide.
The baseline environment variable configuration looks like this (we’ll only override the endpoint in each deployment scenario):
export OTEL_SERVICE_NAME=otel-java-demo
export OTEL_TRACES_EXPORTER=otlp
export OTEL_METRICS_EXPORTER=none
export OTEL_EXPORTER_OTLP_PROTOCOL=grpc
export OTEL_JAVAAGENT_DEBUG=false

java -javaagent:otel-javaagent.jar -jar target/java-demo-app-0.1.0.jar
Generating Traces
Across all deployment scenarios, the process for generating traces is the same.
First, start the Java demo application with the OTEL Java Agent enabled. Next, open the application in your browser (typically at https://edgedelta.com or a forwarded URL) and click the “Send traced request” button.
The application generates a parent trace along with several child spans for downstream calls. The OTEL exporter then sends this telemetry data to the configured OTLP endpoint in Edge Delta.
In the following sections, we’ll walk through three Edge Delta deployment options: Cloud Pipeline, Edge Pipeline on EC2, and Edge Pipeline on EKS.
Deployment Scenario One: Cloud Pipeline
This scenario is the quickest way to get started. It may not be the most cost-efficient option for long-term use, but it’s ideal for learning, demos, or validating your OTEL Java instrumentation with Edge Delta.
In this pattern, the Java application sends trace data directly to an Edge Delta Cloud Pipeline OTLP endpoint, where Edge Delta processes the data before forwarding it to downstream observability or analytics tools.
Steps
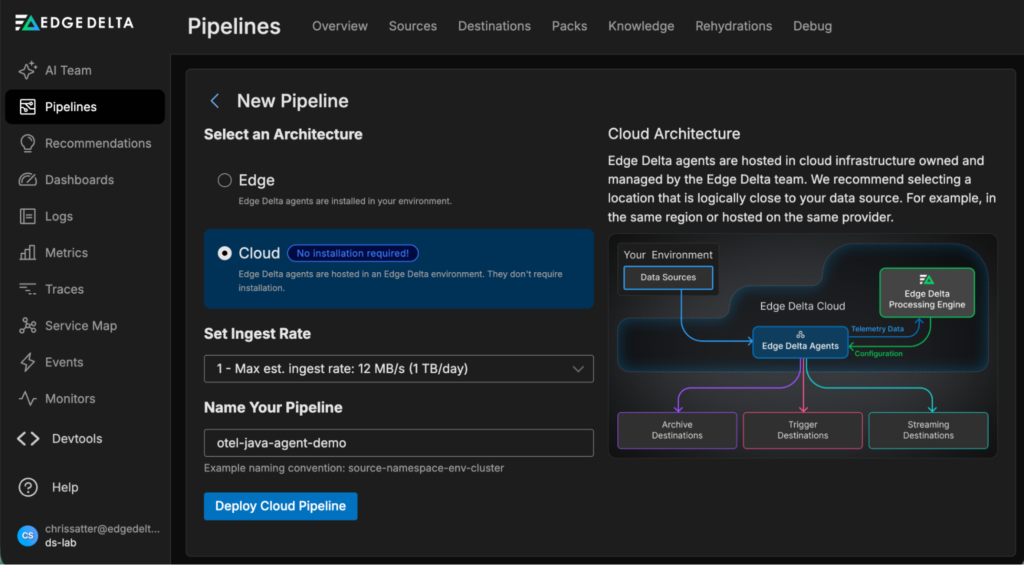
Step 1: Create the Edge Delta Cloud Pipeline
Click “New Pipeline” from the “Pipelines” section of the Edge Delta UI and select “Cloud.” Fill out the form and click “Deploy Cloud Pipeline.” This step will give you an OTLP gRPC endpoint:
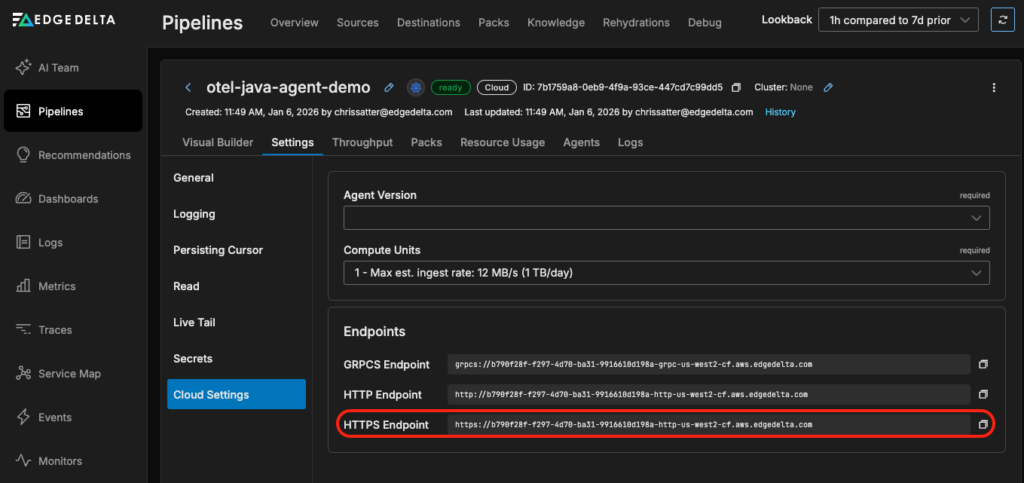
Step 2: Copy the HTTPS Endpoint
Once your pipeline is created, select “Pipelines” from the left menu, select your pipeline, click “Settings,” and then click “Cloud Settings.” Copy the HTTPS endpoint you’ll use in your OTEL Java Agent configuration:
Step 3: Configure the Application to Send Traces to the Cloud Pipeline
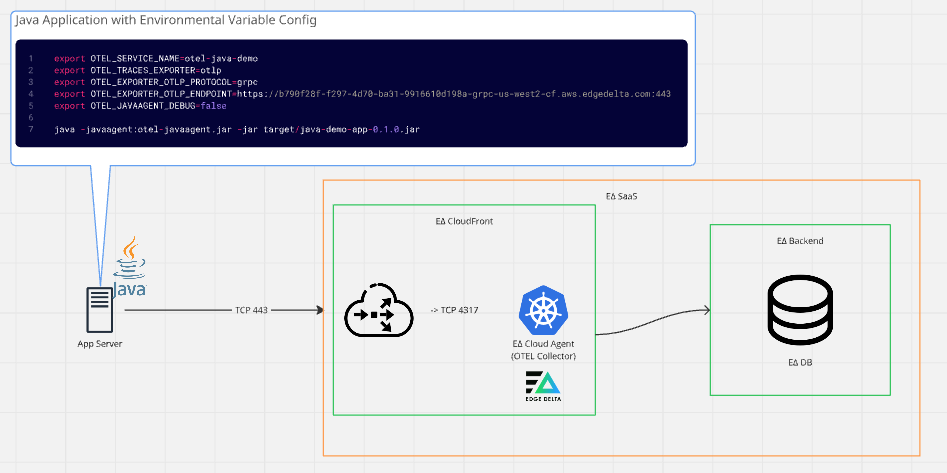
On the host where the Java app runs, set your environment variables (using the same base config as earlier, but with the endpoint you copied in the previous step):
export OTEL_SERVICE_NAME=otel-java-demo
export OTEL_TRACES_EXPORTER=otlp
export OTEL_METRICS_EXPORTER=none
export OTEL_EXPORTER_OTLP_PROTOCOL=grpc
export OTEL_EXPORTER_OTLP_ENDPOINT=https://b790f28f-f297-4d70-ba31-9916610d198a-grpc-us-west2-cf.aws.edgedelta.com:443
export OTEL_JAVAAGENT_DEBUG=false

java -javaagent:otel-javaagent.jar -jar target/java-demo-app-0.1.0.jar
This endpoint uses gRPC over TCP 443, which hits a load balancer on Edge Delta’s SaaS and is then translated internally to TCP 4317 (gRPC).
Step 4: Create and Inspect Traces
Open https://edgedelta.com in your browser to verify the demo UI loads, and click the “Send traced request” button. This will create a parent trace, as well as three additional spans associated with it. You can then inspect those traces in Edge Delta, which we will discuss later in this post.
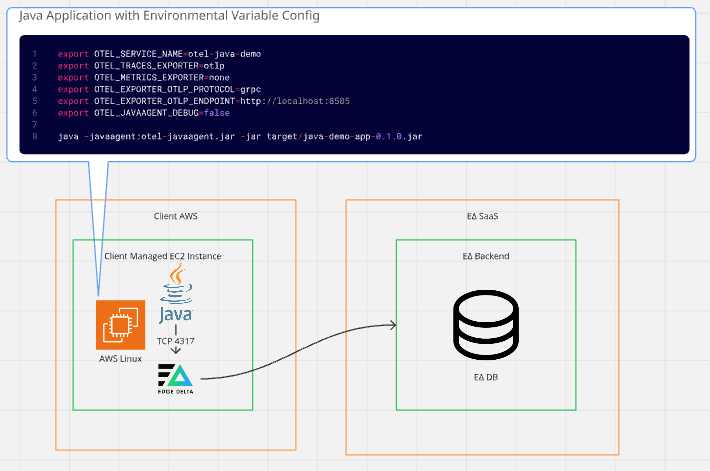
Deployment Scenario Two: Edge Pipeline on EC2
In this scenario, the Edge Delta Agent runs on the same EC2 instance as your Java application. The application exports trace data to localhost, allowing Edge Delta to process it locally before forwarding it downstream.
This pattern brings Edge Delta as close to the edge as possible, which makes filtering, aggregation, enrichment, sampling, and routing more efficient. It also avoids the need to send high-volume raw data off-host only to have it dropped later.
For this example, we’ll assume a free-tier–eligible EC2 Linux instance (such as a t3.micro) is running the Java demo application.
Steps
Step 1: Create the Edge Pipeline
Click “New Pipeline” from the “Pipelines” section of the Edge Delta UI and select “Edge.” This will generate a command to install the Edge Delta Linux Agent on your EC2 instance.
Step 2: Install the Edge Delta Agent on EC2
Copy the generated install command and run it on the EC2 Linux instance.
Step 3: Confirm the Agent Is Connected
In the Edge Delta UI, check the pipeline overview to make sure the agent appears under the list of agents associated with this pipeline.
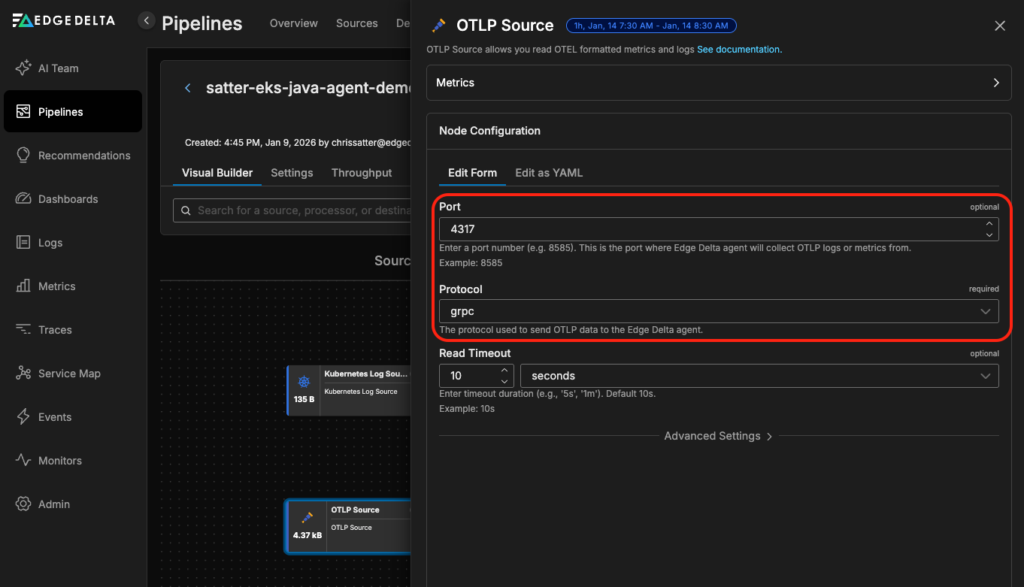
Step 4: Configure the Pipeline OTLP Input
Navigate to the visual Pipeline Builder by clicking on your pipeline from the “Pipeline Overview” page. Toggle into edit mode and click “Add Node” to add an OTLP Source node. Configure the OTLP Source node to listen on port 8585 and use the gRPC protocol. Then, connect this new node to the Edge Delta Destination node.
Step 5: Run the Java Demo App on EC2
On the EC2 instance, export environment variables and start the demo app:
export OTEL_SERVICE_NAME=otel-java-demo
export OTEL_TRACES_EXPORTER=otlp
export OTEL_METRICS_EXPORTER=none
export OTEL_EXPORTER_OTLP_PROTOCOL=grpc
export OTEL_EXPORTER_OTLP_ENDPOINT=http://localhost:8585
export OTEL_JAVAAGENT_DEBUG=false

java -javaagent:otel-javaagent.jar -jar target/java-demo-app-0.1.0.jar
Step 6: Allow Access to the Demo UI
In your EC2 security group rules, allow inbound traffic to port 8080(or whichever port the Java App is bound to) from your IP.
Step 7: Generate and Inspect Traces
Open the application in your browser using the EC2 public hostname and port, and click the “Send traced request” button in the Java HTTP client demo. This will create a parent trace, as well as three additional spans associated with it. You can then inspect those traces in Edge Delta, which we will discuss later in this post.
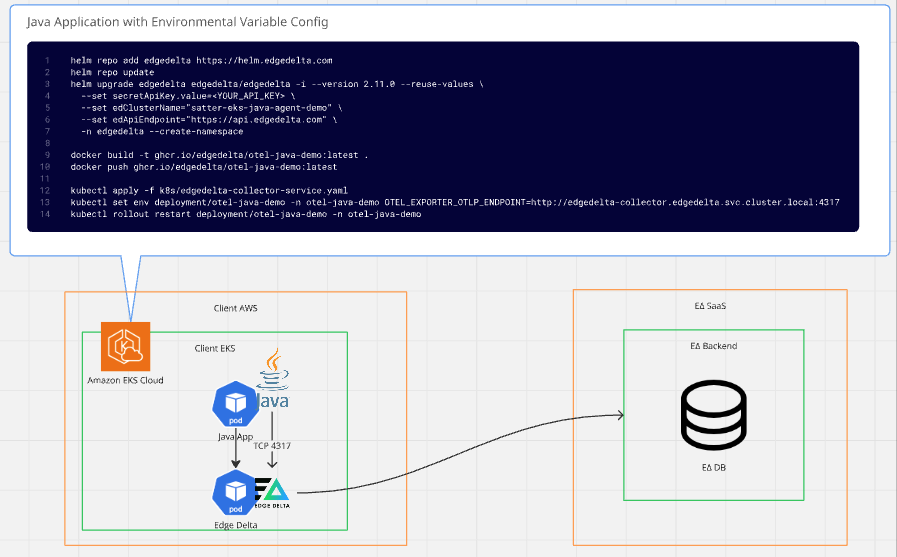
Deployment Scenario Three: Edge Pipeline on EKS
For Kubernetes workloads, you can export trace data directly to an Edge Delta Cloud Pipeline as in the first deployment scenario, but it is often more efficient to run Edge Delta within the cluster.
In this pattern, the Edge Delta Agent runs as a DaemonSet or ReplicaSet, and your Java applications send OTLP traffic to a collector service inside the cluster. The Edge Delta Agent processes the data locally before forwarding it to your chosen destinations.
Steps
Step 1: Create the Edge Pipeline
In the Edge Delta UI, create a Node Pipeline for Kubernetes by selecting “Edge” as the pipeline architecture, with “Node” as the “Kubernetes Deployment Type.” Note that there are multiple deployment options for Kubernetes, but for this demo, we’ll use the Node option. For other options, see the documentation.
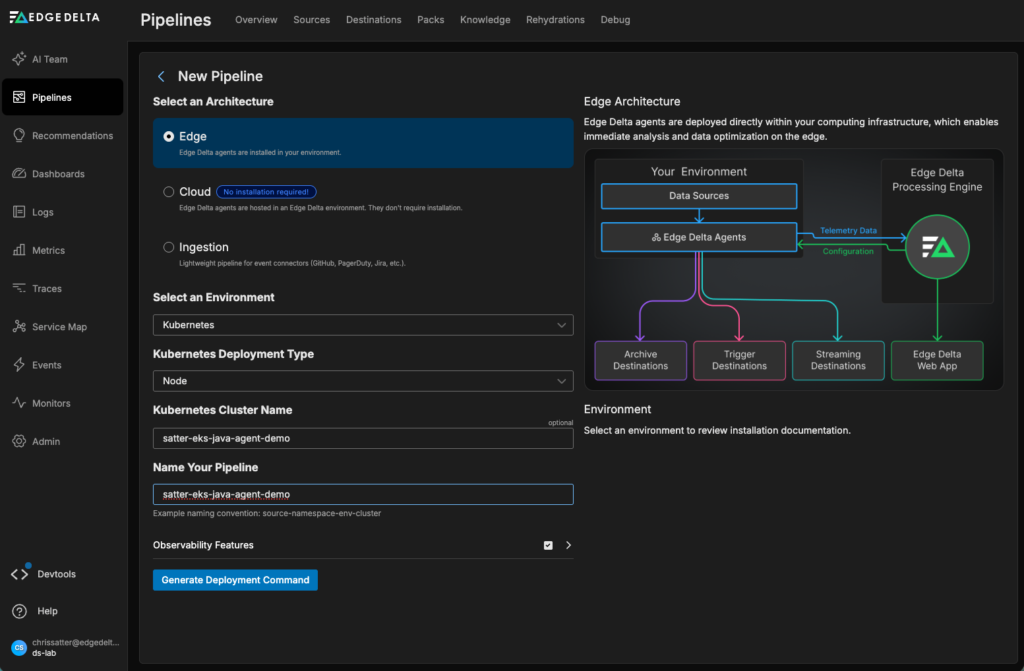
Step 2: Generate the Deployment Command
Click “Generate Deployment Command” for Kubernetes. This shows the Helm commands needed to add the Edge Delta Helm chart repository, update the Helm repositories, and deploy the Edge Delta Agent into your cluster.
Step 3: Deploy Edge Delta into EKS
From your EKS cluster context, run:
helm repo add edgedelta https://helm.edgedelta.com
helm repo update
helm upgrade edgedelta edgedelta/edgedelta -i --version 2.11.0 --reuse-values \
  --set secretApiKey.value=<YOUR_API_KEY> \
  --set edClusterName="<YOUR_CLUSTER_NAME>" \
  --set edApiEndpoint="https://api.edgedelta.com" \
  -n edgedelta --create-namespace
Step 4: Build and Push the Java Demo Image
Build and push the demo app container to a registry accessible by your EKS cluster by running the following commands:
docker build -t ghcr.io/edgedelta/otel-java-demo:latest .
docker push ghcr.io/edgedelta/otel-java-demo:latest
Step 5: Deploy the Edge Delta Collector Service and Connect the OTEL Endpoint
Apply the collector service manifest and set the OTEL endpoint on your Java demo deployment:
kubectl apply -f k8s/edgedelta-collector-service.yaml

kubectl set env deployment/otel-java-demo -n otel-java-demo \
  OTEL_EXPORTER_OTLP_ENDPOINT=http://edgedelta-collector.edgedelta.svc.cluster.local:4317

kubectl rollout restart deployment/otel-java-demo -n otel-java-demo
Step 6: Configure the OTLP Input in the Edge Delta Pipeline
Once your agent is communicating with the Edge Delta Pipeline, navigate to the visual Pipeline Builder by clicking on your pipeline from the “Pipeline Overview” page.
Toggle into edit mode and click “Add Node” to add an OTLP Source node. Configure the OTLP Source node to listen on TCP port 4317 and use the gRPC protocol. Then, connect this new node to the Edge Delta Destination node, and save and deploy your pipeline.
Step 7: Access the Java Demo Application and Generate Traces
Expose the Java demo app locally via port-forwarding:
kubectl port-forward svc/otel-java-demo 8080:8080 -n otel-java-demoThen open https://edgedelta.com in your browser, and click the “Send traced request” button. This will create a parent trace, as well as plus three additional spans associated with it. You can then inspect those traces in Edge Delta, which we will discuss in the next section.
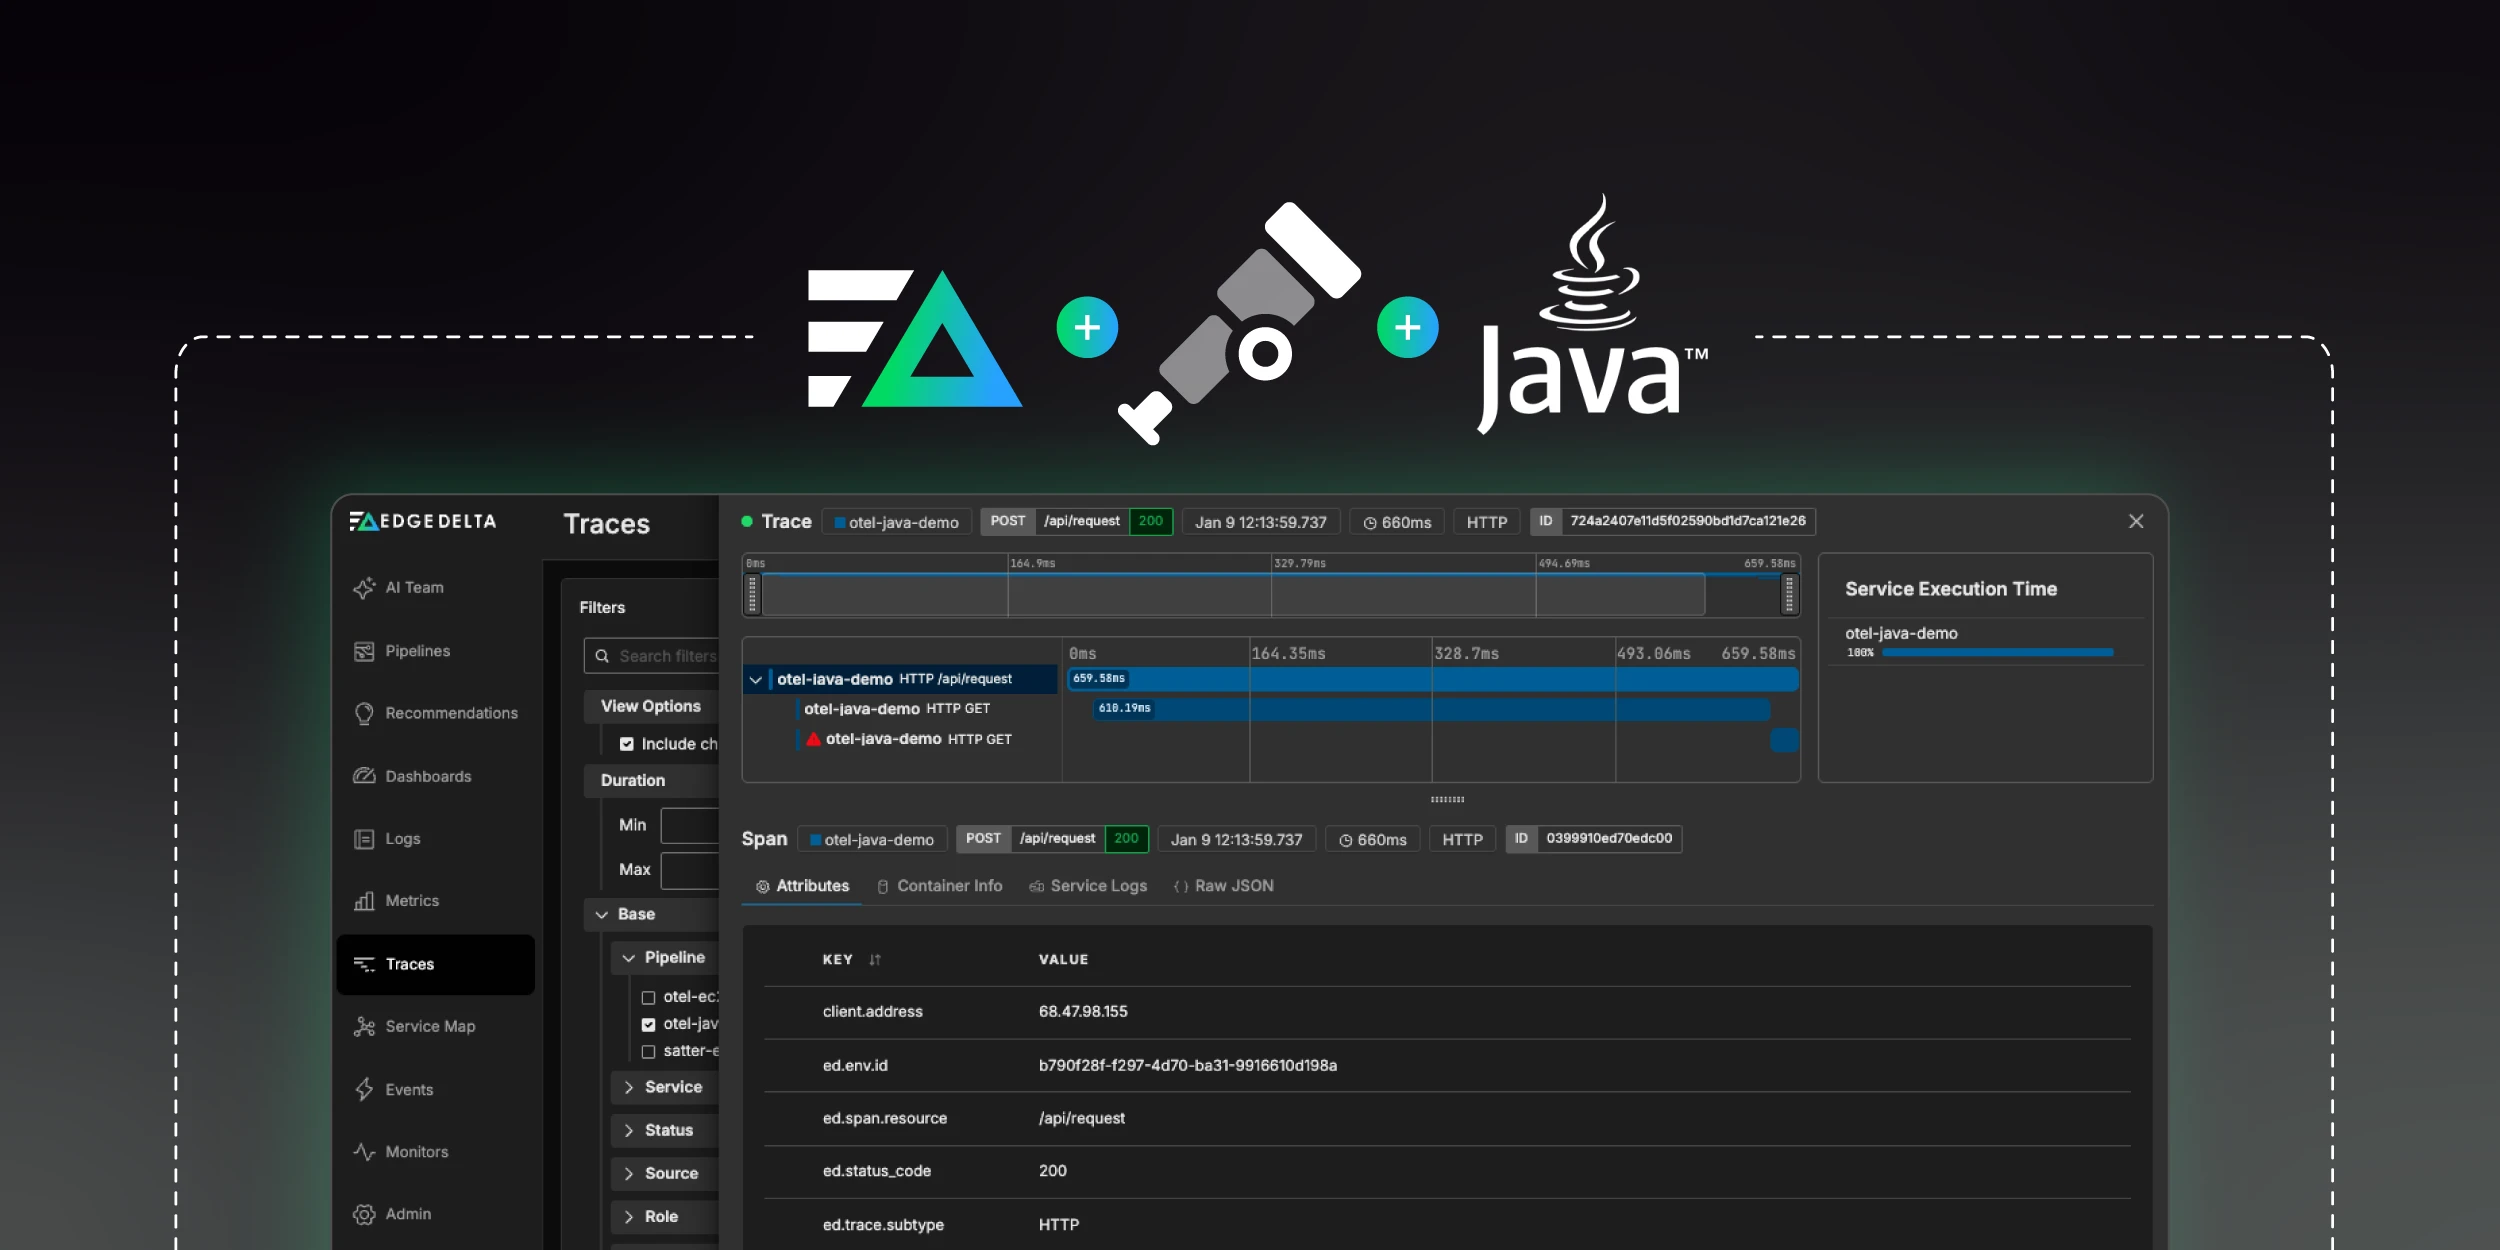
Explore Traces in Edge Delta
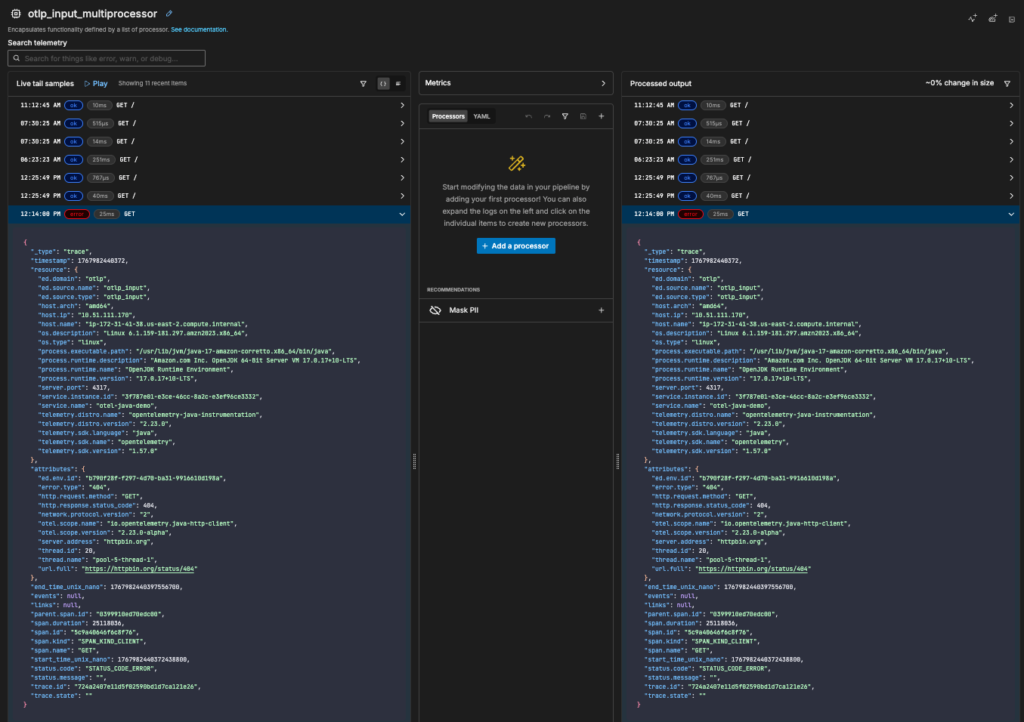
Once your traces are flowing through your pipeline, you can get a real time view with Live Capture. To get there, open the multiprocessor node attached to the OTLP source. From there, you can add any processing rules to ensure your data is optimized for downstream analysis:
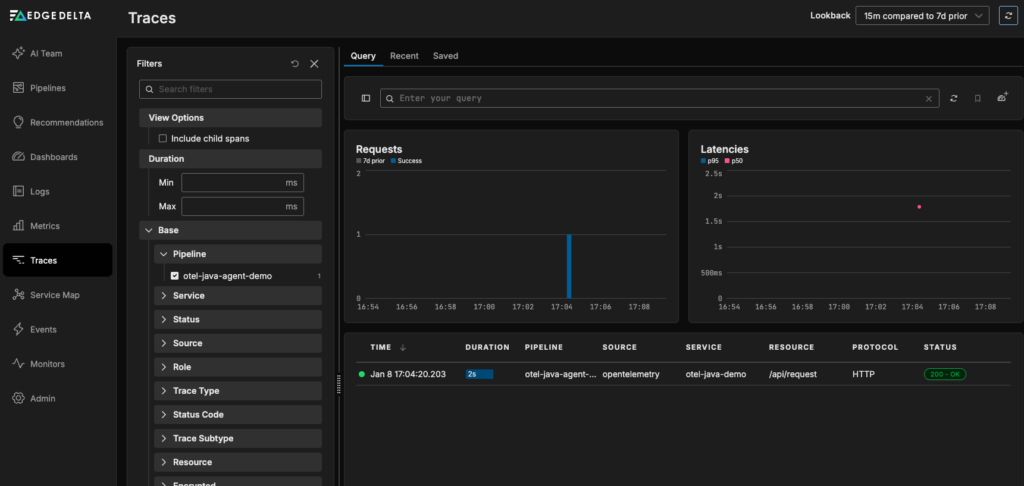
If you’re forwarding your trace data to Edge Delta’s Observability Platform, as we did in this example, you can dive deeper from Traces page, which makes it easy to isolate the traces you’re interested in:
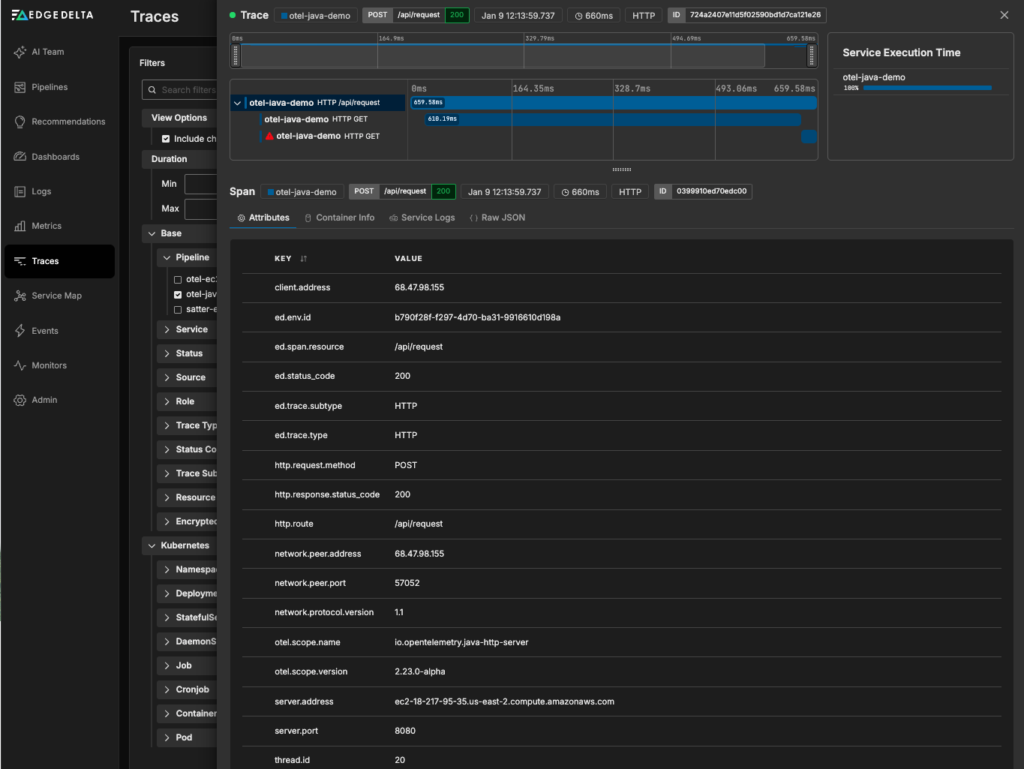
From there, you can click on the trace you generated to see its associated spans, service logs, duration, and more:
Next Steps: Run Reliable Agentic Workflows with Clean, Normalized Data
In this blog post, we’ve demonstrated three different approaches to collecting OpenTelemetry Traces from a simple Java application with Edge Delta. Once your trace data is flowing through your pipeline, you can filter, aggregate, enrich, and sample it as you see fit, and route it to the downstream destinations of your choice, including Edge Delta’s own Observability Platform.
Those same standardized traces can also power Edge Delta’s AI Teammates, the only platform where telemetry data, observability, and AI form a self-improving loop. This agentic observability team analyzes signals from across your environment to automatically surface critical issues from alert noise, identify root causes, and map symptoms to dependencies and recent code changes — all while keeping humans in the loop with clear, actionable summaries.
OpenTelemetry provides a clean, consistent data model by design, which means AI Teammates can operate effectively without being constrained by fragmented or inconsistent data.
If you’d like to learn more about how Edge Delta supports OpenTelemetry, book a meeting with a member of our technical team. You can also try AI Teammates yourself with a free, 30-day trial.


