The status quo for monitoring is no longer good enough.
Traditional monitoring vendors have required DevOps, Security, and SRE teams to take the same approach for over a decade. That is, centralizing raw logs, metrics, and traces by compressing them, encrypting them, and shipping them – often to a cloud or data center on the other side of the world. Then, unpacking the data, ingesting it, indexing it, querying upon it, dashboarding it, and only then generating alerts.
Ten years ago, the centralize-then-analyze approach worked just fine. However, when you use this approach with today’s data volumes, you’re severely limited in what you can do for real-time use cases.
Take, for example, a Fortune 100 company we worked with. This company was monitoring their Amazon EKS production environment using Splunk. Naturally, this environment generated so much data that it became cost-prohibitive to ingest everything. Plus, as they pulled more data into Splunk, indexes and partitions grew, and query performance degraded. So, the team started neglecting and throwing out certain data sets. Ultimately, to meet budget and performance requirements, the company was forced to compromise the types of questions they could ask of their data.
I point out this example because it demonstrates the range of challenges that traditional centralized observability platforms create, from cost to management to performance, and why this approach doesn’t work today. Let’s explore these challenges in greater depth.
Cost: Centralize-then-analyze approaches are cost-prohibitive
While some vendors are inching towards a tiered pricing model, observability platforms predominantly charge based on data ingestion. As data volumes have grown, this cost model creates issues for customers and forces them to filter and truncate the data they analyze. In other words, you must look into your “crystal ball” and pick which data to alert on and which data to throw out. We’ve found that many organizations are only analyzing 6% or less of their production data.
Some are using alternative storage options, like Amazon S3 or Azure Blob Storage, to lower costs. However, you can’t alert on these datasets in real-time meaning these storage volumes can be challenging to integrate with your observability stack – vendors design their platforms for easy ingestion, not easy egress.
Management: Growing data sets become too unwieldy to manage
That brings us to our second challenge – management. To keep alerts firing correctly, you have to stay on top of different data structures, changing data shapes, new schemas and libraries, fluctuating baselines, etc. As you ingest more into your platform, the data becomes overwhelming to maintain and, in some cases, completely unmanageable. The end result leads to either alert fatigue or alternatively risking a production outage.
Performance: Centralized platforms can’t keep up with the rate data is generated
Lastly, and perhaps most critically, we have the performance challenge. To keep production environments up and running, DevOps, SRE, and Security teams need to understand patterns and spot anomalies as they occur. However, the limitations of centralized platforms prevent these teams from analyzing 100% of the data (cost) and receiving high-quality alerts (management). When they get the data they need, they can’t move fast enough because the queries aren’t keeping up with the data volumes (performance).
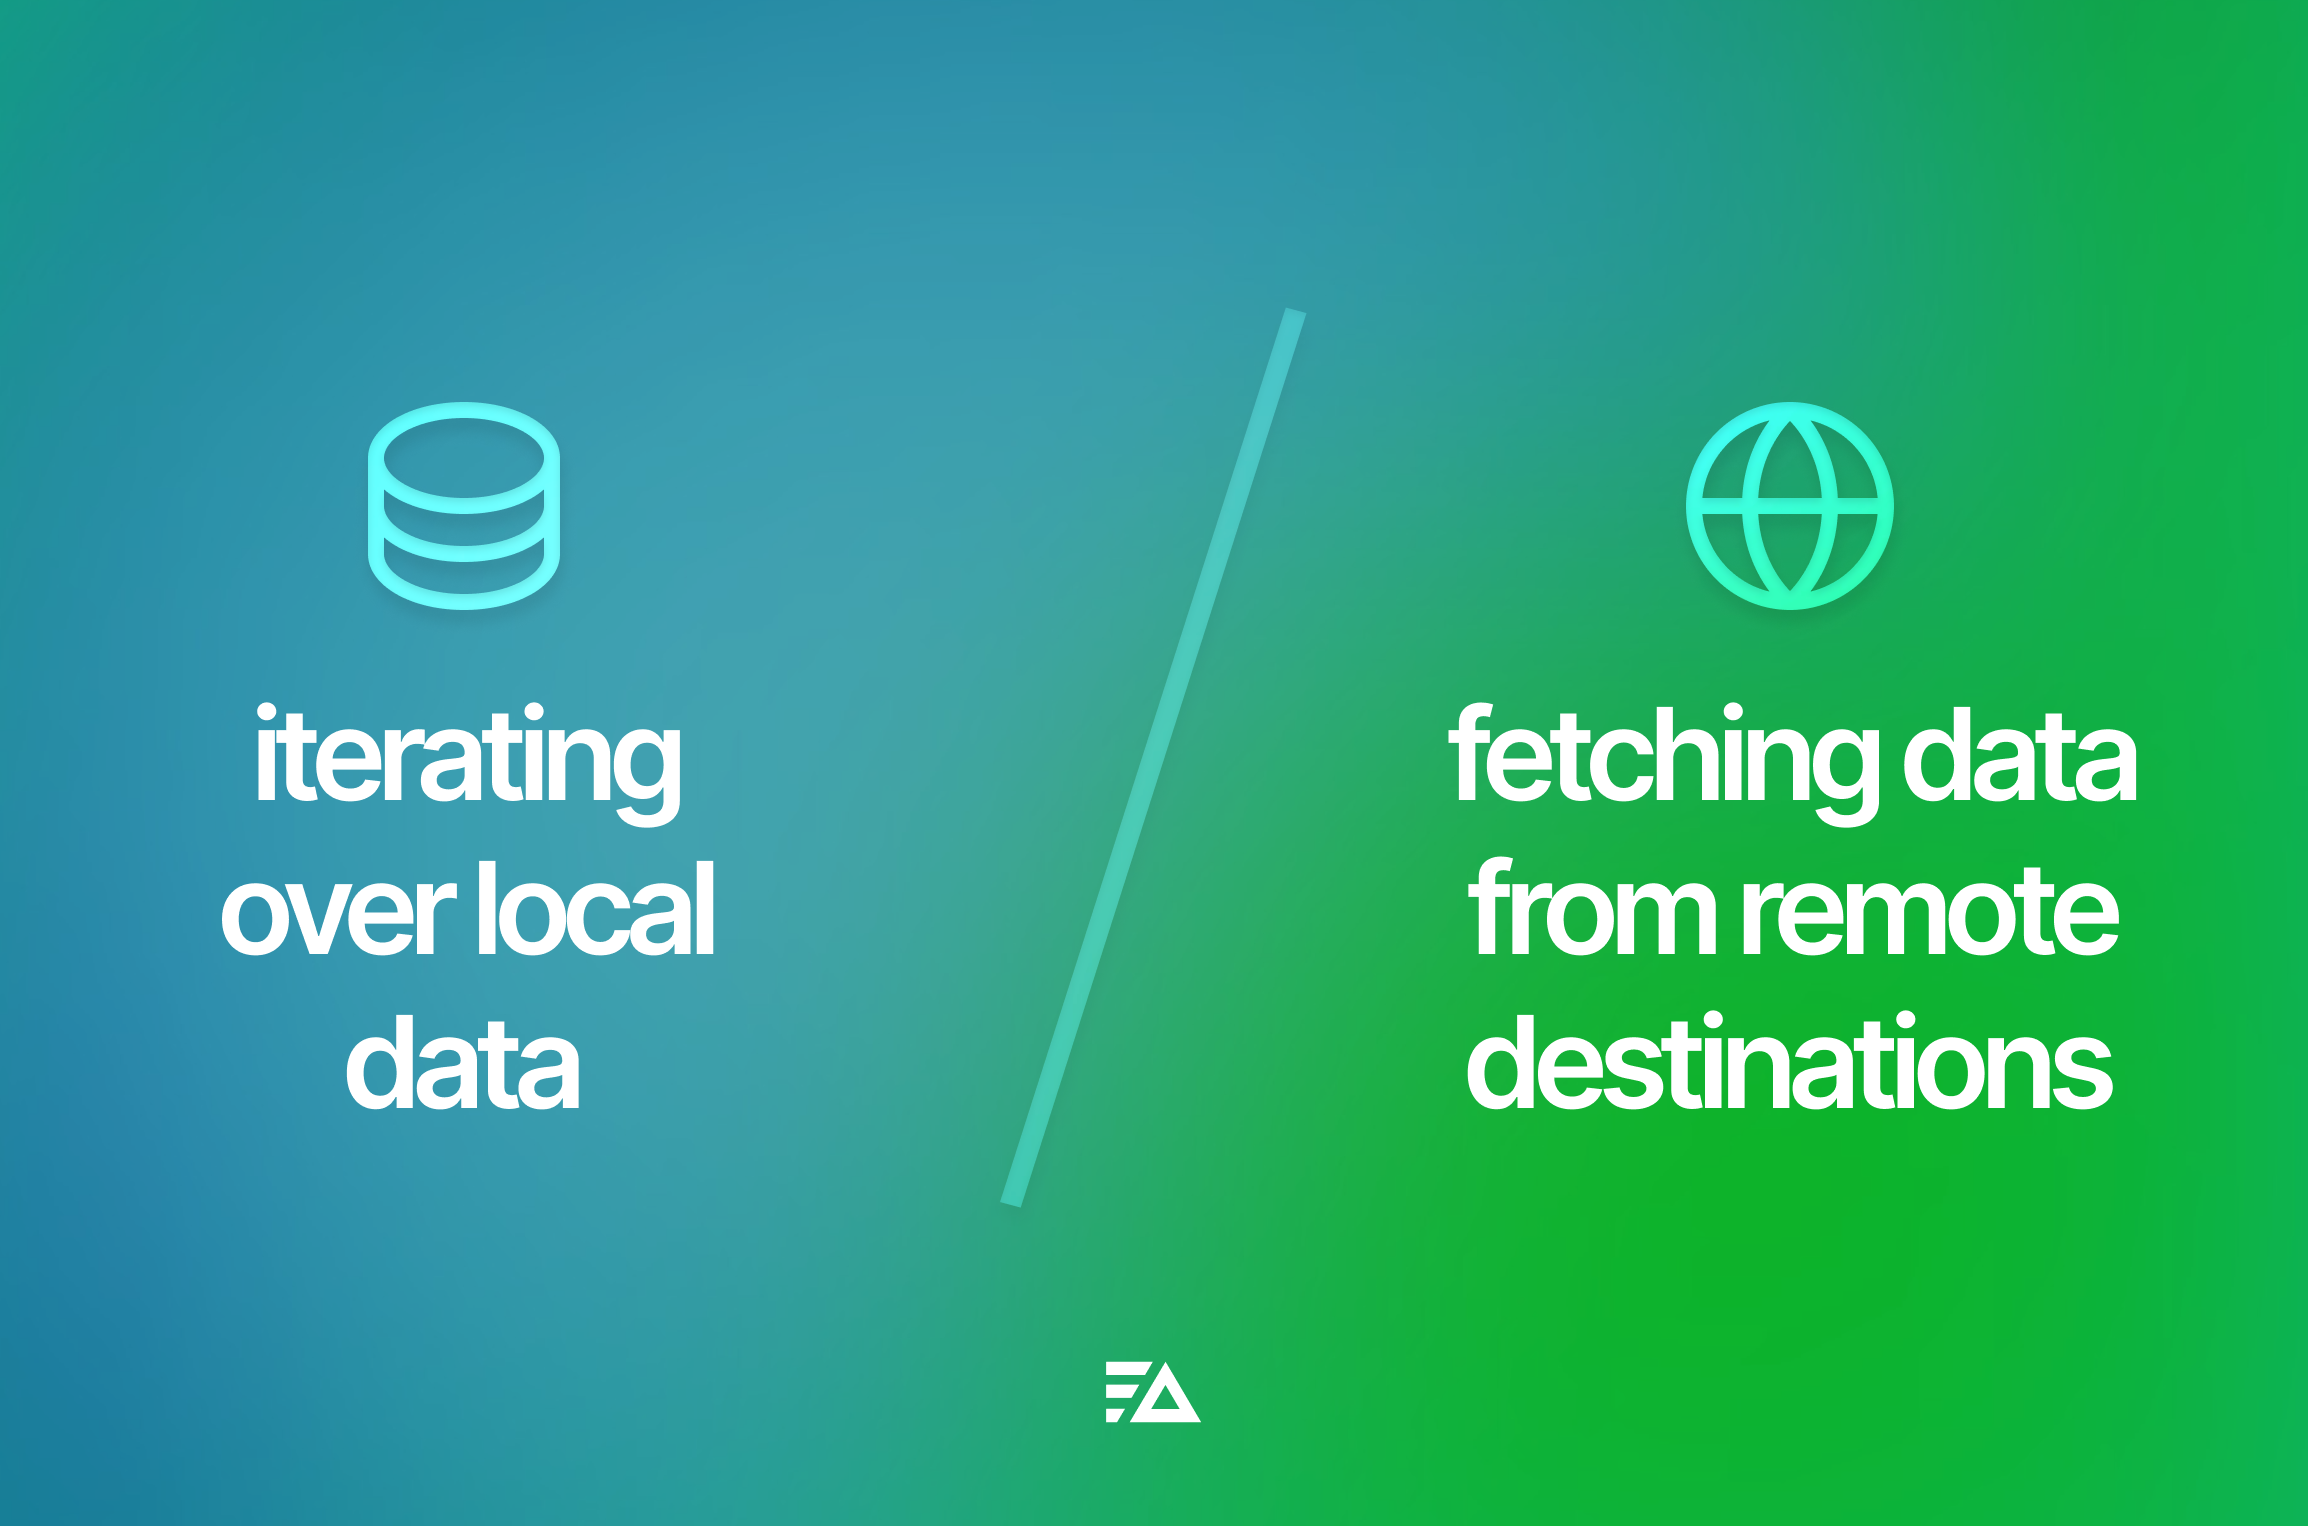
The team at Edge Delta recognized that there has to be a better way, which led to the first Edge Observability platform. Rather than an incremental improvement on the traditional centralized approach, Edge Delta uses distributed queries and machine learning to analyze data as it’s created, where it’s created. So, what’s the impact of decoupling where you analyze data from where it is stored? Let’s tie it back to the challenges discussed above.
Cost: Lower observability costs by up to 95%
Edge Delta uses stream processing to analyze 100% of your logs, metrics, and traces at the source as they’re created. Then, it identifies high-value data sets, integrates with your preferred observability platform, and streams only the aggregates and insights your team needs. (It also copies all the raw data to your low-cost storage if needed for future rehydration.) By optimizing your observability data in this manner, you can reduce TCO by up to 95% while gaining deeper visibility into mission-critical systems.
Ultimately, this means your teams no longer have to manually choose which data to centralize and which to discard.
Management: Stay on top of evolving datasets and unlock self-service observability
Edge Delta allows you to analyze data using more generic query terms. So, as your data structure changes or baselines grow, you can receive meaningful insights without constantly redefining schemas, regexes, parse statements, queries, and alerts.
Removing this layer of complexity also enables self-service observability. So, engineers can detect and prevent issues without relying on another team for specialized analysis.
Performance: Analyze millions of loglines per second
How is Edge Delta able to accomplish all of this? As implied above, your teams get the insights they need while optimizing and automating the data you centralize. On top of that, Edge Delta offers the most performant agent in the industry that scales to massive data volumes while maintaining true real-time alerting. This performance enables you to analyze millions of log lines per second. You can explore the impressive benchmarks here.
If there’s one takeaway from this article, it should be that observability needs begin at the source. By analyzing data as it’s created, you can overcome the cost, management, and performance limitations that centralized approaches place on today’s data volumes. This is all possible with Edge Observability.


