


A span in distributed tracing represents a single unit of work or operation within a trace. When an operation starts, the span captures the beginning timestamp and essential metadata, such as the operation’s name and status codes. It records the end time when the operation concludes, allowing for the calculation of the operation’s duration. This precise timing helps elucidate the sequence of events within the software.
Spans also include tags and details about the requests they represent, helping in understanding potentially complex correlations among them. Moreover, spans are organized hierarchically with parent-child relationships, facilitating the tracing of request flows across various services. This structure is beneficial for pinpointing delays and issues at specific points in the workflow.
Each span gathers comprehensive metadata that enriches the trace with detailed context for analysis. This metadata provides insights into the operation’s success, location, and any significant occurrences during its execution. Metadata includes the following:
- Operation names
- Status information
- Resource identifiers
- Custom annotations
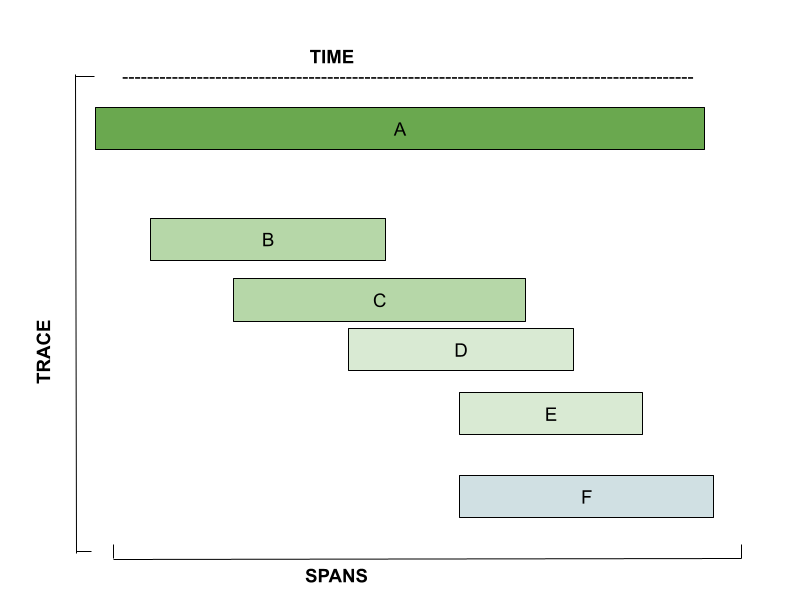
For instance, metadata can indicate whether an operation was successful, where it occurred, and any significant events during its execution, such as cache interactions. The image below depicts one trace, which is made up of multiple spans.
Analyzing the timing and metadata of spans helps pinpoint performance bottlenecks and operational failures. To fully understand what spans are in distributed tracing, this article will cover their types, compositions, and examples.
Key Takeaways:
- A span is essential to tracing a request as it moves across decentralized services.
- Spans record system operations like database queries, HTTP requests, and other work.
- A trace typically includes a single-parent span and multiple child spans to show a request’s performance over time.
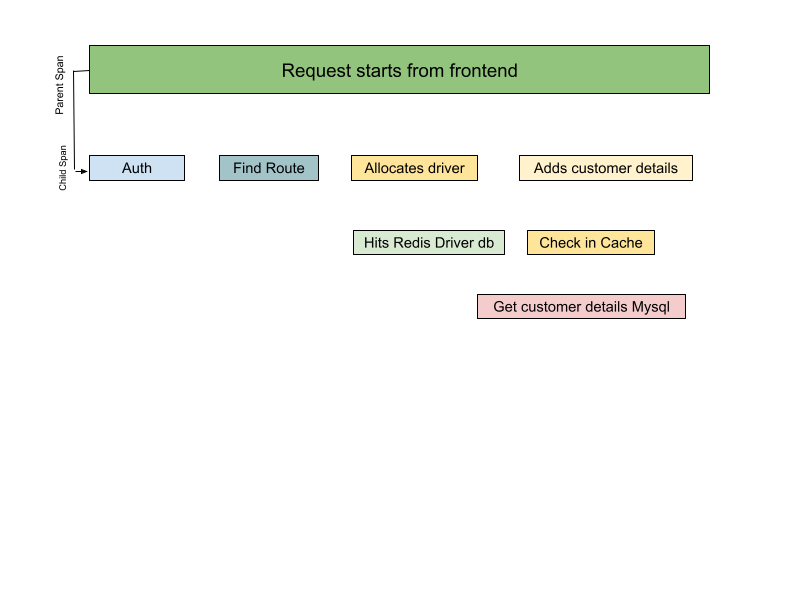
- A parent span, also called a root span, represents the entire request’s end-to-end latency.
- Child spans are used to represent function calls, calls to other microservices, requests to authentication APIs, and more.
- Understanding span composition helps interpret trace data and distributed architecture application behavior and health.
What Are Spans in Tracing?
Distributed tracing monitors data requests as they traverse through a distributed system. A span is a fundamental element in the tracing process. It captures the lifecycle of a request from start to finish as it moves across various decentralized services. This capability is essential for:
- Diagnosing issues within the system,
- Optimizing performance across services,
- Understanding the complex interactions between multiple services.
Each span records a specific operation or transaction within the system, such as:
- Database query
- An HTTP request
- Any other individual unit of work
Spans are rich with details that together provide a comprehensive view of the execution flow. They typically include information such as:
- Name
- Parent span ID (empty for root spans)
- Start and End Timestamps
- Span Context
- Attributes
- Span Events
- Span Links
- Span Status
On a Side Note:
For span collection in distributed tracing, many systems use sampling strategies due to the high data volume. This means not every span is recorded, but enough samples are collected to show the system’s behavior.
Here’s how spans look in distributed tracing:
The following sections give detailed information on types of spans, context, and some examples.
Types of Spans
Understanding the concept of spans and their types is vital to understanding the hierarchical structure within traces. Essentially, spans are categorized into two types: parent and child spans.
A trace typically comprises a single-parent span along with multiple child spans, collectively offering a comprehensive view of a request’s performance throughout its lifecycle. If a span fails during execution, it can potentially cause the entire trace to fail.
Tracing systems closely monitor these traces and their respective spans, assigning unique IDs to each trace and organizing them into spans. By examining all the spans within a trace, one can gain insights into the operational status and performance of the processes involved.
Read on to learn more about parent span and child span and their roles in tracing.
Parent Span
A parent span, also known as a root span, represents the entire request’s end-to-end latency. In a distributed system, a new span is typically created when a request or operation is initiated. This span becomes the parent span for subsequent spans created due to the same operation or request.
During the process, errors may occur, halting parent spans. These spans branch out to child spans, which can then divide into their child spans throughout the distributed system.
More specifically, in a distributed system that handles online shopping orders, the parent span represents the entire order process. When a customer places an order in an online bookstore, a parent span is initiated. This parent span is responsible for tracking the total time the customer clicks the “Place Order” button to complete the order process. This comprehensive measure captures all associated operations under one overarching timeline.
As part of the order process, the parent span spawns several child spans corresponding to different services involved in completing the order:
- Inventory: Check the availability of the requested books.
- Payment: Process the customer’s payment information.
- Shipping: Handle the logistics of preparing and sending out the order.
- Notification: Send an order confirmation to the customer.
Each of these services operates as a child span, and they may have their subsequent child spans depending on the complexity of tasks they perform. The parent span provides a unified view of the order’s progress and will terminate once all child spans are complete, signaling the end of the order processing.
Child Span
A child span is a sub-operation triggered by a parent span or another child. Child spans represent function calls, calls to other microservices, a call to an authentication API, and so on. It provides granular visibility into each part of the request. Spans can delegate processes to other spans.
It can be a function checking whether the item is available or not. Child spans provide visibility into each component of a request.
Child spans are crucial in distributed tracing as they capture individual operations that occur as part of a larger request. They enable developers and system administrators to monitor, debug, and optimize applications by providing a clear and detailed view of every operational aspect within a larger transaction.
Based on the scenario for an online bookstore, here’s an example of a child span corresponding to one of the services involved in completing the order. Let’s focus on the “Inventory” child span:
- Operation: Verify book availability during an online order.
- Trigger: Activated when “Place Order” is clicked.
- Outputs: Availability and quantity of requested books.
- Significance: Critical for ensuring that only in-stock items proceed to check out, handling stock discrepancies by notifying customers or adjusting orders.
- Potential Issues: Delays or errors can signal issues with the inventory database or its synchronization.
What are Spans Made Of?
Each span contains several elements that provide detailed information about the operation it represents. These elements include attributes, context, and events, which all contribute to an in-depth comprehension of the system’s behavior and performance.
Understanding span composition helps interpret trace data and understand application behavior and health in a distributed architecture. Here’s a closer look at each of these elements:
Did You Know?
Spans can be lightweight. Despite their detailed recording capability, spans are designed to be lightweight in terms of the data they store. Being lightweight minimizes the performance impact on the traced application, which is a critical consideration for high-performance applications.
Span Attributes
Span attributes are essentially metadata tags that enrich a span with additional context, clarifying what is occurring within a specific segment of a trace. Attributes allow you to create metadata that you can use to annotate a span and carry information about the operation it is tracking.
For example, if a span records an operation that adds an item to a user’s shopping cart in an eCommerce system, you can record the following:
- Customer ID
- The ID of the item to add to the cart
- Cart ID
The added information helps understand and analyze distributed applications’ performance and behavior better. You can use them to filter and search for specific orders based on their unique IDs and payment methods, or even check the availability of items in the inventory.
The table below contains examples of span attributes:
| Key | Value |
|---|---|
| http.request.method | “GET” |
| network.protocol.version | “1.1” |
| url.path | “/webshop/articles/4” |
| url.query | “?s=1” |
| server.address | “example.com” |
| server.port | 8080 |
| url.scheme | “https” |
| http.route | “/webshop/articles/:article_id” |
| http.response.status_code | 200 |
| client.address | “192.0.2.4” |
| client.socket.address | “192.0.2.5” (the client goes through a proxy) |
| user_agent.original | “Mozilla/5.0 (Windows NT 10.0; Win64; x64; rv:72.0) Gecko/20100101 Firefox/72.0” |
Source: OpenTelemetry
Span Context
A span context is a critical identifier for the request to which a span belongs. It is a repository of essential information that connects spans across different services and machines. The span context includes three main components:
- Trace ID: This is the same trace ID found in the trace context. It links spans to a larger trace, facilitating the association of individual spans with the overall process.
- Span ID: An identifier for each span in the trace, is needed to determine its role.
- Timestamps: These provide the exact timing details for when the span was initiated.
This context is inherited by child spans, ensuring that all related spans are interconnected and facilitating the compelling correlation of activities across distributed systems. Span contexts help build a complete and insightful workflow or request representation for troubleshooting distributed transactions and understanding system behaviors.
Span Events
A span event is a readable message attached to a span that indicates a specific occurrence during its duration. These events are timestamped, and a span may include zero or more events. Each is characterized by a timestamped event name and an optionally structured data payload.
One notable feature of these events is that their timestamps are presented as offsets from the span’s start. This setup makes it straightforward to track the time intervals between events. Additionally, events can possess their attributes.
For instance, should a function trigger an exception, this incident can be documented in a span event. Similar to its parent span, a span event is equipped with metadata such as a name and a timestamp, and it may include attributes that delineate the specifics of the event.
Example of Spans
Database Query Span
Operation: Retrieving data from a database.
Example: Suppose a user management service is querying a user database to authenticate a user.
Span Details:
-
Operation Name: SELECT FROM users
-
Start Time: The time when the query was initiated.
-
End Time: The time when the query results were returned.
-
Tags:
- db.type: sql
- db.instance: UserDB
- db.statement: SELECT * FROM users WHERE username = ?
- db.user: dbUser
- span.kind: client
This span shows the interaction with the database, the time to execute the query, and potential bottlenecks in data retrieval. It contributes to understanding how data access patterns affect overall performance and can help identify slow queries or database issues impacting the user experience
HTTP Request Span
Example Scenario: Making an HTTP GET request to an external API for payment processing in an e-commerce application.
Span Details:
-
Operation Name: “HTTP GET: Payment Processing”
-
Attributes:
- http.method: “GET”
- http.url: “https://api.paymentprocessor.com/process“
- http.status_code: 200
- http.response_time: “120ms”
This span provides insights into the external API call’s performance, which is crucial for transaction completion in e-commerce operations. Response time and status code show HTTP request efficiency and success, highlighting external dependencies’ impact on application performance.
Conclusion
Spans in distributed tracing are crucial in clarifying how different system components interact. They improve IT monitoring and diagnostics by giving specialists fine-grained control over data transferred between multiple end-users.
Spans capture precise timing and contextual data for each operation, enabling developers to identify and resolve performance issues and bottlenecks effectively. This enhancement in observability tracing significantly boosts the reliability and efficiency of applications.
FAQ for What are Spans in Distributed Tracing
What is the difference between logs and spans?
A span is an operation or ‘work’ taking place on a service. It tracks specific request operations to show what happened during that time. On the other hand, a log is a time-stamped message that services or other components generate. Logs are not necessarily associated with any particular user request or transaction.
What are the three components of observability?
Logs, metrics, and traces make up the three pillars of observability. These pillars provide complete visibility into the state of your systems, hybrid infrastructures, or applications. These three data outputs can help you determine how your system failed and locate the problem.
What is the difference between a trace vs. a span?
A trace is a collection of actions that show how an application and its related services process a single transaction. A span refers to an individual operation within that trace.
What is a span in OpenTracing?
In OpenTracing, a “span” stores data for a single unit of work. Spans are trace units of work that carry tags with request-related information. They carry around a set of tags containing information pertinent to the request.

