


Observability architecture is a structured approach to understanding system behavior and performance through comprehensive data collection, analysis, and visualization.
Effective observability architecture offers real-time insights into system behavior and facilitates prompt issue detection and resolution, making it essential for preserving system performance, security, and reliability.
This article will give you an in-depth discussion of observability architecture and how you can better leverage it.
Key Takeaways:- Observability architecture enhances system efficiency, stability, and user experience by methodically collecting and analyzing system data.
- Observability data includes traces (request pathways), events (significant occurrences), metrics (performance measurements), and logs (system activity).
- Key benefits of an observability structure include improved performance, proactive issue detection, effective troubleshooting, and security and compliance assurance.
Observability: An Overview
Observability is the ability to deduce a software system’s internal states from its exterior outputs. In short, it is a way to understand the system, including its functionality and state of health. And there are lots of platforms, including Edge Delta, that can help you better manage your observability. For the purposes of this article, however, we’re going to focus on observability architecture.
Components of Observability Architecture
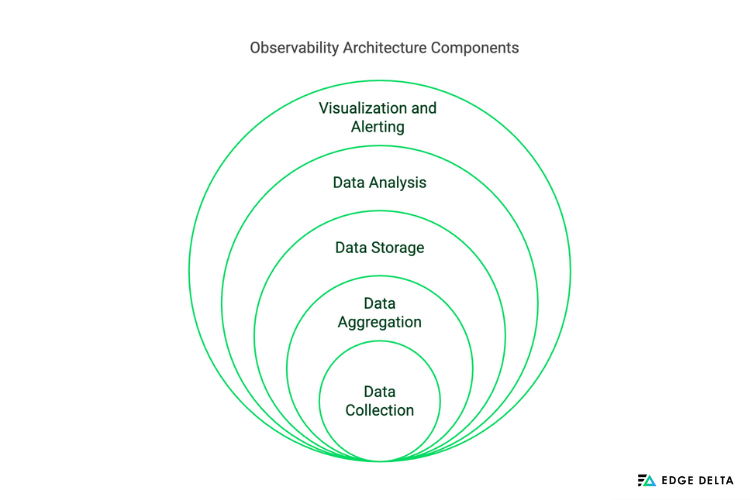
Observability architecture consists of data collection, aggregation, storage, analysis, and visualization. Each of these elements are vital to preserving the system’s security, performance, and dependability.
| COMPONENTS OF OBSERVABILITY ARCHITECTURE | ||
|---|---|---|
| Component | Description | Key Functions |
| Data Collection | Gathering data from various sources | Gathering user interactions, infrastructure metrics, and application logs ensures thorough monitoring. |
| Data Aggregation | Consolidating information for analysis | Combining traces, analytics, and logs from several sources presents a cohesive system view. |
| Data Storage | Processing the data collected | Employing file systems, databases, and cloud storage platforms to store substantial amounts of observability data safely. |
| Data Analysis | Data processing and analysis | Using techniques for trend analysis, anomaly identification, and extracting useful information from the data. |
| Visualization and Alerting | Presenting data and generating alerts | Establishing alert notifications for significant events, creating dashboards for real-time monitoring, and providing insights for prompt decision-making. |
Data Collection: Collect events, logs, traces, and metrics from various sources.
Data collection involves gathering data from various sources to analyze, store, and use in decision-making. Obtaining data includes methods such as logging, tracing, and monitoring.
The gathering of data is vital for an observability architecture, providing essential details for:
- Monitoring
- Real-time insights
- Anomaly identification
- Root cause analysis
- Continuous improvement
Organizations may build a solid dataset that offers insights into systems’ functionality and behavior by aggregating this data.
Data Aggregation: Integrate data sources for a comprehensive view and a deeper grasp.
Data aggregation involves consolidating and integrating data from various sources. Integrating data sources is crucial to obtaining a cohesive and holistic view of system performance. Through the integration of data from various sources, organizations can enhance their understanding of the interdependencies and relationships within their systems.
As a vital component of an observability architecture, data aggregation helps organizations in:
- Improving analysis
- Better decision-making
- Easier monitoring
- Effective visualization and alerting
Data Storage: Effectively store information to prevent data loss.
Data storage refers to the recording, preservation, and retrieval of digital data. It utilizes various methods and technologies to store data in different forms.
To support system monitoring, debugging, and performance optimization, data storage is crucial for an observability architecture. It must be scalable to handle growth, high-performance for real-time access, reliable to prevent data loss, and effective in data compression, indexing, and archiving.
Data Analysis: Enables the possibility of anomaly detection and performance optimization.
Data analysis includes inspecting, cleansing, transforming, and modeling data to discover useful information, draw decisions, and help in decision-making, The process involves various methods and techniques like data mining, statistical analysis, machine learning, and visualization.
Converting raw data into actionable insights through data analysis is a crucial component of the observability architecture. It helps with anomaly detection, root cause analysis, performance optimization, predictive maintenance, and capacity planning possible guarantees efficient system monitoring, maintenance, and optimization.
Visualization and Alerting: Minimize downtime and maintain high system reliability.
Visualization creates a graphical representation of data to make complex patterns and trends easier to understand. On the other hand, alerting enables automatic alerting to notify stakeholders through prompt issue detection and resolution, enabling automatic alerting to notify stakeholders.
As two vital components of an observability architecture, each has a distinct but complementary role in system management and monitoring. Real-time monitoring and historical analysis are made easier by visualization while alerting ensures timely responses to keep the system operating smoothly.
Continuous Improvement: Use feedback to continuously improve processes.
Continuous improvement is the ongoing effort to make breakthroughs and improvements to enhance system processes. It focuses on continuously finding methods to improve effectiveness, quality, and efficiency.
Observability architecture and continuous improvement go hand in hand. This integration ensures that systems are continuously refined and optimized to meet evolving demands and challenges. Organizations can successfully boost system performance, manage operations, and adjust to changing business needs by routinely analyzing and optimizing observability protocols.
Types of Observability Data
In observability architecture, integrating various forms of observability data is essential to understanding the behavior and performance of software and IT systems. Each type plays a distinct role, contributing uniquely to the overall architecture by improving system health, streamlining problem-solving, and increasing visibility.
Observability data includes events, traces, metrics, and logs; each has a specific purpose in helping to understand the behavior of IT and software systems.
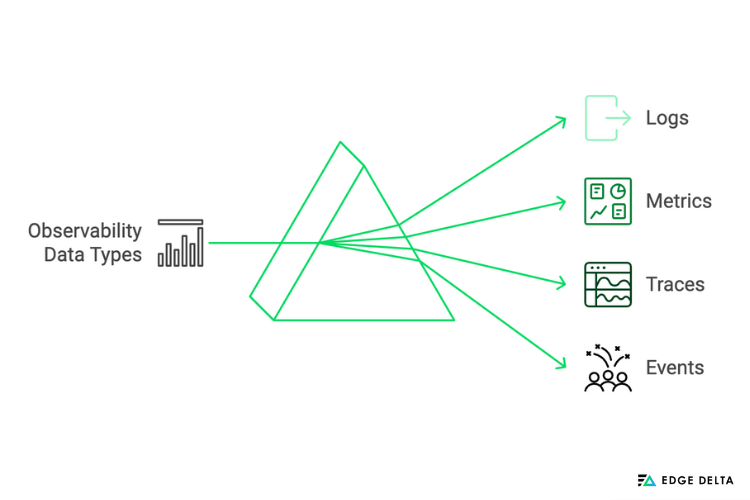
- Logs provide historically ordered records of system occurrences
- Metrics offer numerical metrics, such as CPU utilization and response times
- Traces are useful for debugging and performance analysis
- Events provide real-time monitoring and alerting by designating particular system actions or state changes.
The table below briefly overviews observability data types used to track and examine the system’s performance and behavior.
| TYPES OF OBSERVABILITY DATA | ||
|---|---|---|
| Data Type | Description | Example |
| Logs | A thorough log of all activities and events within a system. | Error, access, and transaction log |
| Metrics | Numerical data representing system performance metrics. | Response times, CPU, and memory usage |
| Traces | Monitor the flow of requests through a system. | Distributed traces, span details |
| Events | Symbolize important events that happen in a system. | System start, user login, and deployment events |
Logs
Logs are chronological records of events and actions that take place within a system and is crucial for observability in IT and software systems. Analysts and administrators use them to find patterns in system usage, diagnose problems, and ensure that operational standards are being followed. Organizations can implement proactive maintenance and optimization methods by gathering and evaluating log data to obtain insights into the functionality and health of their systems.
A real-life scenario is when an e-commerce website experiences intermittent slowdowns during peak shopping hours. Analysts examine these logs to identify patterns like repeated failed login attempts or specific product page requests. To improve overall efficiency, they optimize the database queries for that product page and implement caching mechanisms.
Metrics
Metrics are essential, quantifiable measurements that provide real-time insights into a system’s behavior and performance. These include the following:
- Response Times: Vital for optimizing the user experience.
- CPU: Shows processing load.
- Memory Consumption: Essential for effective resource allocation.
- Network Traffic Metrics: Measure the effectiveness of data transmission.
- Error Rates: Reveal system weaknesses.
To ensure a seamless user experience, a SaaS provider monitors the functionality of its cloud-based service. An alert is set off when the CPU usage measure continuously exceeds a predetermined threshold. The investigation reveals that a new feature’s algorithm is causing CPU spikes. They optimize the algorithm, reducing CPU load and preventing the system from experiencing potential downtime.
Traces
In terms of observability, traces are comprehensive records that follow a request’s path via several distributed system components. They show interactions with databases, external APIs, and microservices while offering insight into a request’s route. Traces comprise discrete spans, each representing a distinct action or occasion during the request’s path.
For instance, users report occasional delays in an organization’s transaction processes. By analyzing traces, the team identifies that the payment processing time has a higher latency during specific times. They discovered that there is a lag in the external payment gateway. To improve reliability, the team applies circuit breaker patterns, retries, and negotiates stronger Service Level Agreements (SLAs) with the payment source.
**What are SLAs?**SLA or Service Level Agreement is a formal document that outlines the expectations and relationship between a client and a service provider. It describes the specific services that must be provided, the performance requirements that the supplier must fulfill, and the metrics that are employed to assess the provider’s performance.
Events
Events are crucial to preserve observability and ensure the stability and dependability of software and IT systems. In contrast to logs, which usually document all activities, events are specific occurrences that are significant because they affect the system’s operation, security, or performance.
A real-life example is a mobile game developer who is looking to boost user engagement by better understanding user behavior. The developer discovers a significant drop-off rate at a certain game level by examining event data. The team makes use of this information to increase in-game prizes and modify the level of difficulty, which increases user pleasure and retention.
The next section will address the importance of observability architecture.
Importance of Observability Architecture
Observability architecture enables teams to enforce smooth user experiences, optimize system dependability, implement strict security measures, and improve visibility and troubleshooting. It helps organizations adapt and enhance operations while monitoring system health proactively.
By leveraging observability architecture, teams may ensure strong security protocols, enhance system reliability, and provide flawless user experiences.
1. Enhanced Visibility
When system visibility is limited, organizations face challenges like slow issue identification, prolonged downtimes, and trouble understanding system behavior. This can lead to customer dissatisfaction, higher operational costs, and security vulnerabilities.
Observability architecture significantly enhances insight into system behavior and performance by combining various components for data collection, analysis, and visualization. This visibility enables prompt identification of issues like errors, anomalies, or performance bottlenecks, reducing mean-time-to-resolution and optimizing system health.
For example, observability tools can instantly identify which service is slowing down in a complex microservices architecture, enabling teams to take swift action to fix the problem.
2. Proactive Issue Detection
Observability architecture offers a thorough insight into system activity by integrating metrics, logs, traces, and events. These data sources are constantly monitored and analyzed, allowing for the early identification of anomalies and performance.
For instance, the system can detect resource constraints such as high CPU usage, sudden spikes in latency, and high error rates before they impact consumers. To ensure improved reliability and user experience, operations teams can then take proactive measures like increasing resources or removing any bottlenecks. In a cloud infrastructure, automated alerts can notify the team of high CPU usage, prompting immediate scaling actions.
3. Improved Troubleshooting and Debugging
The observability architecture provides a holistic view of system health by collecting and analyzing logs, traces, and metrics. This facilitates faster issue detection and resolution while maintaining optimal reliability and performance. For example, when an e-commerce platform experiences slow checkout times, traces can identify the exact service causing the delay, allowing for targeted adjustments.
4. Optimization of System Performance
Observability architecture supports compliance and security by identifying bottlenecks and inefficiencies through data analysis from logs, metrics, and traces. Metrics such as CPU usage and response times identify resource limitations, and request flows are tracked via traces to identify latency problems across distributed systems.
Observability architecture enhances security and compliance by using data analysis from logs, metrics, and traces to find bottlenecks and inefficiencies. This holistic approach enables the following:
- Proactive optimization
- System operation
- Enhanced user experience
For example, a team may find through tracing that a certain database query is causing the entire program to lag. In this case, optimizing the query to increase overall performance is required.
5. Compliance and Security
Observability architecture supports compliance and security by providing thorough logs and traces that facilitate audits and incident investigations. It ensures:
- Comprehensive monitoring
- Real-time alerts
- Secured data storage
- Regulation compliance
- Promp security events
A thorough understanding of how the systems operate helps identify vulnerabilities, and maintain accountability and transparency. Financial organizations, for instance, can monitor and track all transactions using observability tools to ensure they comply with regulations and promptly identify any suspicious activity.
The following section will cover the best practices for creating an observability architecture:
Best Practices for Building Observability Architecture
Effective observability architecture is essential to understanding and enhancing system performance. Its components and practices ensure that the observability architecture enables proactive monitoring, prompt issue resolution, and continuous system performance and reliability improvements.
The table below shows the components and best practices for creating a robust observability architecture.
| BEST PRACTICES FOR BUILDING OBSERVABILITY STRUCTURE | |
|---|---|
| Best Practice | Description |
| Consistent Data Collection | Ensure thorough data collection across all system components. |
| Scalable Storage Solutions | Select storage options that are capable of handling large volumes of data. |
| Effective Data Aggregation and Correlation | For unified insights, combine and correlate data from various sources. |
| Real-Time Analysis and Alerting | Implement mechanisms that enable real-time alerting and data analysis. |
| User-Friendly Visualization | Use intuitive visualization tools for easy data interpretation. |
| Continuous Improvement | For enhanced results, evaluate and improve observability practices regularly. |
Consistent Data Collection
Ensuring complete observability of software and IT systems requires uniform data collection across all services and components. Standardizing instrumentation allows organizations to collect metrics, logs, traces, and events consistently, making correlation and analysis easier.
Scalable Storage Solutions
In terms of observability, selecting scalable storage solutions capable of handling large data volumes is crucial for the effective analysis and monitoring of software and IT systems. Here are the guidelines for selecting scalable storage solutions to handle large volumes of observability data:
- Select horizontally scalable storage solutions.
- Ensure that data models are flexible enough to handle various data types.
- Prioritize reliability and durability with features like integrity checks and data replication.
- Optimize workflows by assessing compatibility and integration with current observability tools.
- Strike a balance between cost efficiency and the total cost of ownership by taking upkeep and operating costs into account.
- Select tools that provide encryption and access controls to help emphasize security and compliance.
- Choose solutions for troubleshooting and best practices with strong community support.
Effective Data Aggregation and Correlation
The best data aggregation and correlation practices are crucial to ensuring that data from various sources is successfully evaluated together and offers coherent insights into system performance and behavior. Here are the key guidelines for these best practices:
- Standardized Formats: Using standardized data formats and schemas from various sources to enable smooth aggregation. This involves using standard data formats for logs, metrics, and traces, such as JSON, CSV, or protocol buffers. Consistent data structures make aggregation and correlation procedures easier.
- Unique Identifiers: Implement unique identifiers for various data kinds (logs, metrics, traces) and services, such as request or transaction IDs. By enabling the correlation of related actions and occurrences across dispersed systems, these IDs make it possible to combine data from many sources according to shared characteristics.
- Timestamp Synchronization: To accurately order events and actions within the system, ensure that timestamps are synced across data sources. Timestamped alignment enables the creation of a logical timeline of system behavior, which helps in efficient troubleshooting and performance enhancement. Network Time Protocol (NTP) can be used to accomplish synchronization, which guarantees accuracy and consistency in data collection and analysis.
Real-Time Analysis and Alerting
Observability’s real-time analysis and alerting elements enable enterprises to sustain proactive, adaptable, and resilient IT operations. Organizations may minimize risks, maximize resource usage, and provide seamless user experiences by utilizing real-time insights into system performance and behavior in the dynamic digital landscape.
User-Friendly Visualization
Observability depends critically on the availability of visualization technologies to turn complex data into meaningful insights. User-friendly visualization tools such as Grafana, Kibana, Tableau, and Splunk are crucial for the effective understanding of observability data.
These tools facilitate a quick understanding of system performance and easy anomaly detection by presenting data in user-friendly dashboards, charts, and graphs. By effectively interpreting data and decision-making, they facilitate troubleshooting, enhance collaboration, and maximize team performance and reliability.
Continuous Improvement
Regular evaluations are necessary for the observability architecture to continuously develop by finding gaps and inefficiencies. Establishing feedback loops is essential for obtaining user and stakeholder insights and facilitating the adoption of new technologies that enhance data collection and analysis.
The deployment of automated monitoring systems ensures the timely detection and settlement of issues. Cross-team collaboration ensures that observability goals are in line with business objectives, and data-driven insights fuel continuous architectural improvement and iterative enhancements.
Conclusion
Observability architecture is crucial for modern IT systems, providing thorough insights through metrics, logs, and traces. By implementing an effective observability architecture, organizations can ensure extensive monitoring, prompt troubleshooting, and optimum system performance, ultimately resulting in a more reliable and efficient infrastructure.
FAQs on What is Observability Architecture
What is the concept of observability?
Observability is the capacity to gauge a system’s internal conditions by looking at its outputs.
What are the three components of observability?
The three components of observability are logs, metrics, and traces.
What is an example of observability in real life?
A retailer operating online encountered difficulties with slow page loads that affected their customers’ experience. To track application performance in real-time, the business deployed an observability solution. This strategy helped them locate bottlenecks and swiftly implement solutions.
Sources:

