

Full stack observability thoroughly monitors and understands system components, including frontend, backend, and infrastructure. This visibility ensures seamless performance, swift problem-solving, and an enhanced user experience.
In modern applications, full stack observability is crucial to understanding the entire technology stack. It facilitates immediate issue detection and resolution through the frontend, backend, and infrastructure layers, ensuring optimal performance, reliability, and security throughout the application lifecycle.
Want Faster, Safer, More Actionable Root Cause Analysis?
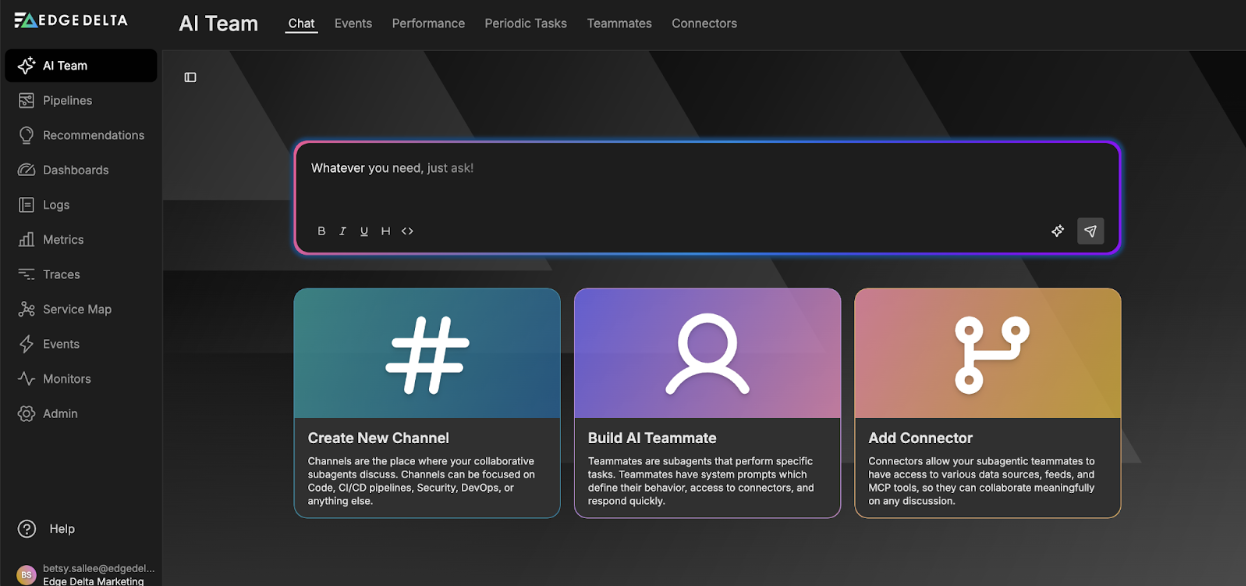
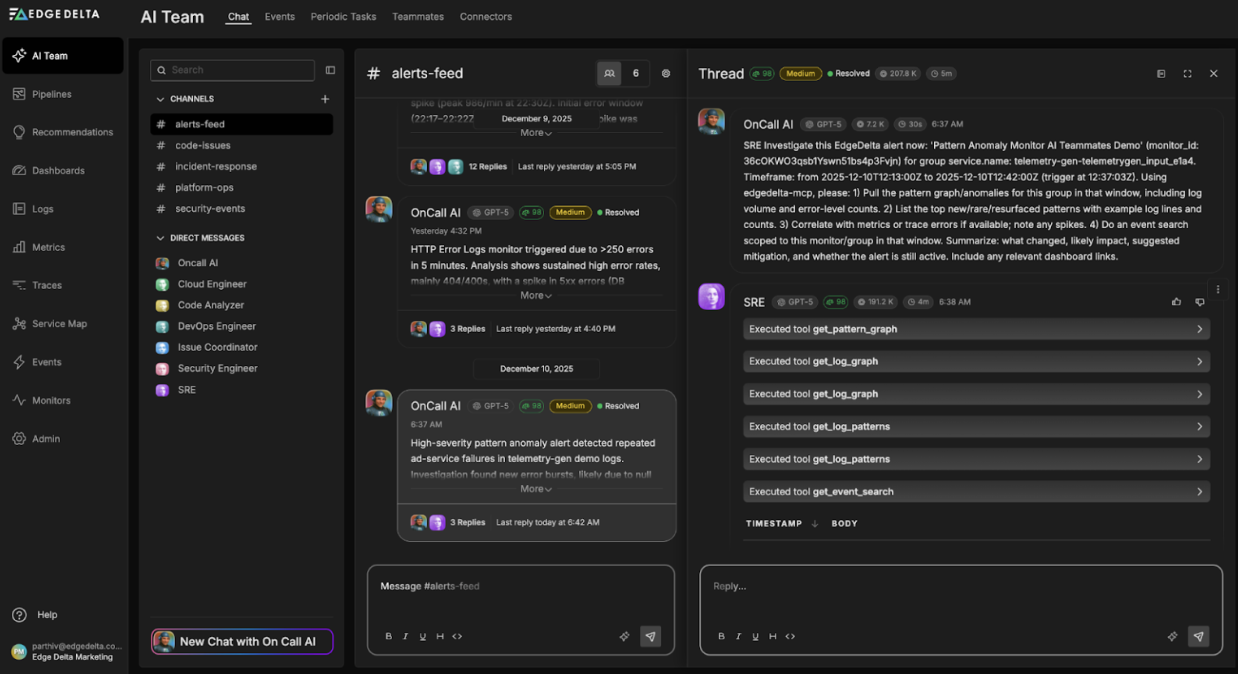
With Edge Delta’s out-of-the-box AI agent for SRE, teams get clearer context on the alerts that matter and more confidence in the overall health and performance of their apps.
Learn MoreThis article will explore what is full stack observability along with its methods, resources, and practical applications.
|
Key Takeaways:
|
What is Full Stack Observability?
Full stack observability refers to the thorough analysis and observation of the front-end, back-end, and infrastructure levels of a technology stack. This type of observability offers an in-depth view of the system by integrating analytics and monitoring technologies across these layers. With this visibility, teams can proactively manage and optimize performance, promptly identify issues, and improve overall system reliability and user experience.
Here is a brief description of the core components of full stack observability:
- Frontend: This includes monitoring user behavior, tracking online and mobile interface performance data, and recording client-side issues and errors that impact user experience.
- Backend: This includes server-side performance metrics, databases, microservices, APIs, and application logic, along with monitoring requests through several services to find faults and bottlenecks that affect the application’s functionality.
- Infrastructure: Infrastructure component monitoring helps in resource optimization, anomaly detection, and proactive failure prevention. This ensures the servers, cloud services, networks, and underlying hardware operate effectively and safely.
Traditional observability focuses on specific components in isolation, while full stack observability provides a comprehensive, integrated view of the entire technology stack. This distinction enhances the effectiveness of troubleshooting, data correlation, and general system understanding, rendering full stack observability a more resilient method for overseeing complex IT settings.
Here’s a brief comparison table highlighting the distinctions between full stack and traditional observability:
|
Aspect |
Traditional Observability |
Full Stack Observability |
|
Scope |
Focuses on specific components. |
Correlates data across the entire stack. |
|
Data Sources |
Limited to specific data such as logs or metrics. |
Includes logs, metrics, traces, and user sessions. |
|
Insight Level |
Isolated insight for each component. |
Comprehensive insights across all components. |
|
Troubleshooting Efficiency |
Moderate since it focuses on isolated components. |
High due to thorough visibility and correlation. |
|
Tools Integration |
Siloed tools with limited integration. |
Unified interface with seamless integration. |
Examples of Full Stack Observability in Action
Full stack observability integrates monitoring across the technology stack, from backend services and infrastructure to front-end interactions. It offers a unified view of the system’s health and performance, facilitating effective operations, problem-solving, and user experience optimization.
Below are some of the real-life examples of full-stack observability:
E-commerce Platform Application
Scenario: An e-commerce platform experiencing a spike in checkout failures and slow page loads implements full-stack observability to fix issues and enhance the user experience swiftly.
IT teams use Google Analytics to monitor user interactions, page load times, and JavaScript errors. This frontend monitoring detects checkout issues, while backend analysis is used to identify payment and infrastructure issues. Both components contribute to prompt issue detection, enhancing user satisfaction.
To handle resource limitations, Prometheus and Grafana track server metrics, including CPU, memory use, and database performance. Elastic Stack collects logs and uses them to correlate backend performance with frontend issues. This allows for resource scaling, script optimization, and service modifications.
Benefits:
- Reduced Downtime: Minimize checkout failures by promptly resolving issues
- Enhanced User Experience: Reduced errors and improved page load times
- Operational Efficiency: Proactively handle performance during high-traffic
- Strategic Insights: Make data-driven decisions on scalability and product development
SaaS Application
Scenario: A SaaS company has been experiencing frequent performance degradation and service interruptions, affecting user satisfaction and retention.
Full stack observability identifies and resolves problems through data correlation and optimization, ensuring continuous improvements in performance and reliability. Organizations can detect and address issues by integrating full-stack observability through data correlation and optimization.
Here are some of the tools that IT teams use to address potential issues:
- Prometheus and Grafana: Monitor infrastructure restrictions
- Dynatrace and AppDynamics: Handle bottlenecks in the backend
- Datadog RUM and Google Analytics: Address frontend performance concerns
The SaaS company integrated full-stack observability by evaluating existing tools, enhancing user satisfaction and reliability. Prometheus, Grafana, Dynatrace, AppDynamics, Datadog RUM, and Google Analytics were selected and set up to monitor the frontend, backend, and infrastructure layers.
Benefits:
- Prompt Issue Resolution: Minimize interruptions and downtime
- Enhanced Performance: Improve user satisfaction and application speed
- Operational Efficiency: Manage issues proactively and optimize performance
- Improved User Experience: Maintain responsiveness and reliability to boost client retention
Tools for Full Stack Observability
Various tools offer extensive frontend, backend, and infrastructure layer monitoring and analysis capabilities in the field of full stack observability. These tools are crucial for advanced apps and SaaS platforms, providing insights into system performance, reliability, and user experience.
|
Feature |
Datadog |
Dynatrace |
New Relic |
Splunk |
Elastic Stack |
|
Frontend Monitoring |
Yes |
Yes |
Yes |
No |
No |
|
Backend Monitoring |
Yes |
Yes |
Yes |
Yes |
Yes |
|
Infrastructure Monitoring |
Yes |
Yes |
Yes |
Yes |
Yes |
|
Real-Time Analytics |
Yes |
Yes |
Yes |
Yes |
Yes |
|
User Session Tracking |
Yes |
Yes |
No |
No |
No |
Here are the top five full-stack observability tools popular for their extensive frontend, backend, and infrastructure layer monitoring and analysis capabilities:
- Datadog: Best for Serverless Architecture
Datadog’s real-time monitoring and optimization of infrastructure and apps helps enterprises achieve user goals by ensuring seamless operation. It is an ideal option for businesses requiring reliable and integrated observability across dynamic, distributed systems.
Features:
- Provides extensive infrastructure and application monitoring
- Offers real-time insights and analytics
- Support growth and agility through scalability
- Dynatrace: Best for AI-Driven Observability
Dynatrace is the best option for AI-driven observability, making it ideal for businesses using DevOps methodologies. By automatically identifying and addressing problems, Dynatrace’s AI-driven observability improves operational efficiency. This auto-detection guarantees the optimum performance and dependability of cloud-native applications.
Features:
- AI-driven observability that features autonomous discovery and baselining
- Offers user experience management, infrastructure monitoring, and APM
- Ideal for DevOps and cloud-native apps
- New Relic: Best for Monitoring in the Cloud, On-Premises, and Hybrid Systems
New Relic is the ideal option for monitoring complex architectures. It is most effective at providing end-to-end APM, real-time analytics, and infrastructure monitoring in advanced architectures. New Relic enables organizations to optimize performance in various IT environments, enhance user experience, and meet operational objectives.
Features:
- Offers real-time analytics, infrastructure, and end-to-end APM
- Provides user interactions, infrastructure health, and app performance insights
- Ideal for cloud, on-premises, and hybrid systems
- Splunk: Best for Large-Scale Data Analysis and Security Monitoring
Splunk is best for large-scale data analysis, security monitoring, and IT operations management. It offers a thorough platform for monitoring, analyzing, and tracking machine data. With effective monitoring and analytics, Splunk helps organizations enhance security posture and streamline IT operations.
Features:
- Provides real-time tracking and evaluation of machine data.
- Supports business intelligence, security analytics, and IT operations.
- Ideal for managing IT operations, large-scale data analysis, and security monitoring.
- Kibana: Best for Elasticsearch and Elastic Stack Integration
Kibana excels at providing real-time, scalable data analytics and visualization across cloud environments and distributed systems. It is perfect for businesses that need robust, open-source tools for data analysis and visualization. By integrating with Elasticsearch, Kibana simplifies data exploration, visualization, and operational insights.
Features:
- Offers strong anomaly detection, visualization, and search features.
- Uses Elasticsearch for real-time data searching, analysis, and visualization.
- Offers flexibility and customization with Elastic Stack integration.
Best Practices for Full Stack Observability
Achieving effective full-stack observability involves implementing best practices for thorough monitoring and analysis across all technology stack layers. These practices guarantee proactive issue detection and system performance optimization, maintaining user satisfaction and operational efficiency.
Integration of Monitoring Tools
Integrating monitoring tools across the stack is crucial for extensive monitoring, ensuring seamless data correlation and holistic performance insights. When integrating these tools, consider the following factors:
- Defined data formats like Prometheus metrics for interoperability
- Centralized dashboards like Kibana for uniform display and analysis
- API interfaces for seamless data aggregation
These monitoring tools enable data correlation from logs, metrics, traces, and user sessions, ensuring unified monitoring of the frontend, backend, and infrastructure levels.
Regular Reviews and Updates
Observability practices must be reviewed and updated regularly to maintain effectiveness and relevance. Constant updates ensure that observability tools and techniques align with evolving business requirements and system architectures.
These assessments include:
- Evaluating the effectiveness of existing tools
- Identifying new requirements based on changing operational environments
- Implementing necessary adjustments to optimize observability
Collaboration Across Teams
Cross-team collaboration is significant because it can ensure thorough monitoring coverage, prompt issue resolution, and proactive detection of potential risks. Team collaboration fosters a culture of shared responsibility, conducts cross-functional training sessions or workshops, and uses collaborative platforms such as Slack to facilitate communication and knowledge sharing.
Scalability and Performance Optimization
Maintaining operational efficiency ensures observability and solutions scale with system growth and performance optimization. One of the best practices for obtaining effective performance is to create scalable architectures for processing and gathering data. This technique can be done by using cloud-native observability tools such as Azure Monitor and AWS CloudWatch and applying horizontal scalability to infrastructure for monitoring.
Conclusion
Full stack observability provides a holistic view of the entire technology stack’s frontend, backend, and infrastructure. This approach ensures an enhanced user experience, prompt problem-solving, and seamless performance.
Organizations may proactively manage advanced software by using various monitoring tools and techniques. Full-stack observability tools help decrease downtime, increase operational effectiveness, and provide strategic insights for long-term success.
FAQs on Full Stack Observability
Why do we need full stack observability?
Full stack observability provides a holistic view of system activity, facilitating prompt issue detection and resolution, increased reliability, and enhanced user experience.
What is Cisco full stack observability?
Cisco Full-Stack Observability integrates data from your business and technology stack, providing insights and optimal application experiences.
What does full stack monitoring mean?
Full-stack monitoring integrates all resource types and monitoring techniques into a single process.
Sources: