

A major piece of observability involves understanding the internal state of a system, application, or infrastructure. To do this, you must use data from every system component, which can be complicated, as each component provides different data types. And this roadblock shows the importance of context and correlation in observability.
Since modern IT and software development processes have grown more complex, most teams fail to correlate data from several components. As a result, they get insufficient context for a complete system view. With accurate context and correlation, teams can enhance incident response, improve root cause analysis, and boost system performance.
This article discusses the importance of context and correlation in observability, including implementation, challenges, solutions, and best practices.
Key Takeaways
- Without correlation and context, observability data creates noise and is less meaningful. It becomes difficult to locate the root causes of issues during or before an incident.* Data correlation connects individual data points for a more comprehensive understanding. Meanwhile, context gives rich insights into system or application behavior.* When teams correlate data properly, they gain accurate context. These two benefits result in a better understanding of system data for comprehensive analysis and interpretation.* Context and correlation implementation involves data gathering, forming correlations, visualization, and arranging alerts.* Some challenges in context and correlation are complex IT infrastructures and skill issues. A few ways to overcome them are through scalable storage and educational seminars.
Understanding Context and Correlation in Observability
In observability, data correlation identifies associations between variables across multiple sources after data collection. For instance, load time tells something about the user experience on your website or app.
To correlate data, instrument your code and configure your observability tools. They capture and propagate relevant tags of common attributes across your system. The following are some of the typical identifiers:
- Service name
- Version
- User
Correlating the data from these identifiers can help teams gain context. It also provides background and situational details for a broader understanding.
For instance, large organizations handle enormous amounts of raw data. These raw telemetries must be collected, correlated, and observed for humans to understand the context.
Importance of Context and Correlation
Complete observability is gaining comprehensive visibility into a system’s various components. Context and correlation help teams achieve true observability by painting a more detailed picture of system behavior.
Helpful ArticleObservability, especially with complex systems, requires effort and complete understanding. One way to understand this process is to be aware of the common observability mistakes, which include the lack of context.
Context and correlation reveal the interconnectedness of network elements for a sufficient and deep understanding of observability data. Through them, teams are generally able to do the following:
- Understand how different elements or variables interact
- Identify patterns and trends
- Predict future outcomes
- Conduct root cause analysis when issues arise
- Facilitate clear communication within teams
- Do better decision-making
- Optimize system performance
- Foster a culture of learning and adaptation
Take a closer look at the benefits of context and correlation in observability below.
Enhancing Incident Response
Unauthorized access, insider threats, phishing attacks, and malware infections are common incidents within IT systems. Fortunately, teams can act fast on these issues and derive actionable insights using context and correlation.
Here’s how context and correlation help with incident response:
- Rank incidents by importance: Teams learn to prioritize incidents based on their potential impact on business operations for a more focused response.
- Improved decision-making: Detailed context enables teams to evaluate their options, make informed decisions, and achieve better outcomes.
- Pattern recognition: Observability data correlation reveals patterns that speed up issue detection and response.
- Automated Responses: Correlation software on observability data can be manipulated to trigger automated responses to threats, significantly reducing response time.
Leveraging context and correlation speeds up incident response times, making for efficient operations.
Improving Root Cause Analysis
Identifying the reasons behind issues is crucial for prevention and resolution. It also allows any IT business to improve continuously. If you want to up your game on root-cause analysis, leverage context and correlation.
Root cause analysis involves tracing problems back to their origin. Through context and correlation, teams can identify and justify relationships between various factors and trace problems more effectively.
Here are the context and correlation benefits related to identifying the root cause of issues:
| Benefit | Description |
|---|---|
| Faster Diagnosis | Proactively identifying the root cause of issues to come up with appropriate and effective solutions quickly |
| Reduced Downtime | Preventing or fixing unplanned disruptions to increase productivity and prevent user inconvenience |
| Comprehensive Understanding | Providing context and detailed insights into system behavior and environment |
Context and correlation can help with root cause analysis by providing a comprehensive system environment view.
The implementation also provides teams with in-depth knowledge of previous system incidents. Learning from incidents, including their root causes, makes future root-cause analysis easier.
Boosting System Performance
Boosting system performance has many benefits. It allows teams to handle more tasks in less time, improves scalability, and helps you stay competitive.
An effective way to boost your overall system performance and reliability is through context and correlation. Here is how context and correlation contribute to system performance improvement:
- Allocate resources more effectively: By leveraging context and correlation, teams can determine when their application receives massive traffic. This practice enables them to allocate additional resources strategically.
- Identify issues before they escalate: Correlating performance metrics with factors like network conditions and user behavior helps teams proactively address bottlenecks or anomalies.
- Improve capacity planning: Teams deserve assurance that their system can handle increasing workloads. Contextual insights (such as system usage history and workload trends) enable accurate resource scaling.
- Adaptive systems: Systems with contextual awareness and data correlation adapt to changing conditions quicker than those without. For instance, learning contexts like real-time traffic patterns can adjust resource allocation, ensuring optimal system performance.
- Enhance user experience: Contextual insights and correlation allow proactive adaptation to user needs and behaviors to improve user satisfaction. This benefit is achievable through fast response times and consistent performance overall.
How to Implement Context and Correlation in Observability
Observability context and correlation can help you make more significant inferences about your system. This benefit is accomplished via the core analysis loop or the continuous cycle of the following:
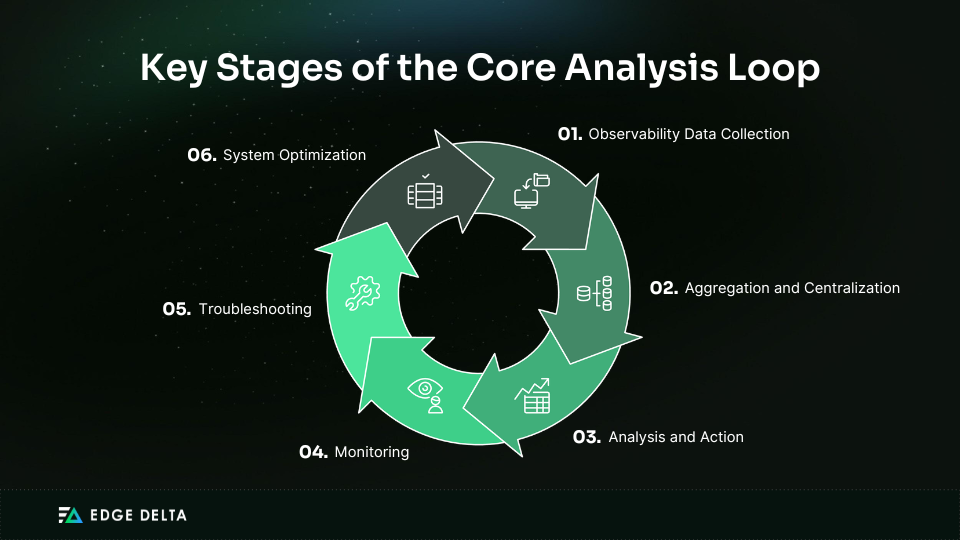
It starts by collecting observability data from multiple sources and aggregating it into a central repository. This feature enables a holistic view of system behavior.
Data centralization enables you to do the following:
- Minimize information silos
- Simplify data management process
- Enhance data quality and security
- Foster collaboration
- Achieve operational efficiency
- Quickly identify root causes of anomalies and resolve them
Next, leverage visualization tools to gain a comprehensive system view. These tools create interactive elements like graphs and charts to provide real-time insights into your system or application, including its performance, issues, and user interactions.
Explore more about correlation and context implementation below.
Gathering Contextual Data
As IT businesses become increasingly complex, diverse sources emit more raw data in varying formats and characteristics. These sources can work as containers, services, applications, hosts, and other system components.
An effective contextual data collection involves three data types which are also known as the three pillars of observability: logs, metrics, and traces.
| Data Type | Examples | Data Gathering Methods and Tools | Description |
|---|---|---|---|
| Logs | System Logs, Application Logs, Security Logs, Audit Logs, and Event Logs | Log Shipper | A tool that takes logs and sends them to the log management platform |
| Data Normalization | A process to format data for easy parsing | ||
| Indexing | A process of breaking log data blocks into segments and organizing it for easy searching | ||
| Compression | A means of reducing the amount of storage space needed without alteration | ||
| Curation | The process of selecting which logs to include in the collection process | ||
| Metrics | Counters, Gauges, and Histograms | Instrumentation Libraries | Tools that collect metrics directly from the application code |
| API Endpoints | Requested endpoints to fetch metrics for the monitoring tools | ||
| Agents and Proxies | Tools that extract data directly from the application memory, runtime, or network interface and send it to the central monitoring system | ||
| Traces | Duration of Operations, Sequences of Services, and Path of Requests | Instrumentation | Sensors that gather data on how an application is running |
| Tracing Library/Agent | Agents from tools that measure applications and collect trace data | ||
| Distributed Tracing Systems | Software components integrated into applications to gather trace data |
NoteA trace consists of multiple spans. Context propagation facilitates the correlation of spans across multiple microservices. It ensures each request carries trace context in the distributed tracing process.
Raw data alone cannot provide a comprehensive view of a system or application behavior. They need to undergo correlation, which helps create a context for teams to understand its meaning.
Establishing Correlations
Correlation is a measure of the association between two data points. Since there are many aggregated data types to process for correlation, you can use techniques to establish them properly.
| Technique | Description |
|---|---|
| Temporal Correlation | The relationship between events over time |
| Causal Correlation | Explores cause-effect relationships |
| Entity Correlation | Associating data with specific entities (components, services, users) within a system |
Temporal correlation helps monitor performance, detect patterns, and alert teams in case of incidents. Causal correlation helps determine whether changes directly affect changes in another. Meanwhile, the entity correlation shows how interactions or dependencies influence observability metrics.
There are observability solutions for applying these data correlation techniques. Some can execute actions, such as alerts that trigger when an application fails. Learn more about such tools below.
Using Observability Tools
Observability tools are individual software that helps you know the state of your system. They enable the collection and analysis of the following:
- Data
- User experience
- Infrastructure
- Network telemetry
Pro TipYou can leverage open-source tools like OpenTelemetry when collecting telemetry data. It is an open standard framework that captures and exports telemetry data from cloud-native applications and infrastructure.
Observability tools automate data collection and correlation by aggregating and analyzing data from multiple sources. This process helps teams do the following:
- Create easily understood visual reports and dashboards.
- Report on links between system elements involved in an issue.
- Identify interdependencies that should be examined to help resolve an issue.
These are the most common observability tools today:
| Observability Tool | Description |
|---|---|
| Prometheus | Prometheus collects and stores metrics as time series data so users understand them at a particular time. |
| Grafana | Grafana is an interactive web application with dashboards that visualize data queried from data sources. |
| Splunk | Splunk makes big data searchable by indexing and correlating them in a container. |
| Jaeger | Jaeger maps the flow of requests and data moving in distributed systems to see complex interactions between microservices. |
Helpful ArticleSome monitoring and observability tools like Grafana, Kibana, and Prometheus offer varying capabilities despite having some similarities.
Creating Context-Rich Dashboards
Observability tools like Grafana provide relevant insights through dashboards. Teams can group charts and examine multiple metrics for a given host or service. This practice enables immediate issue spotting to understand its impacts and resolve them.
Some of the essential capabilities of an observability dashboard are the following:
- Various customization options, such as adding or removing charts
- Compatibility with platforms and tools like AWS, Google Cloud, and Prometheus
- Flexibility in collecting and analyzing data; not limited to predefined metrics and logs
Most tools offer flexibility to customize dashboards. This step allows teams to focus on the most relevant metrics and enrich them with contextual information for deeper insights.
ReminderGetting the most valuable insights can be time-consuming. You may need a deep understanding of the query language of your observability platform.
An ideal dashboard effectively displays contextual and correlated data. Consider the following for tailored data visualization:
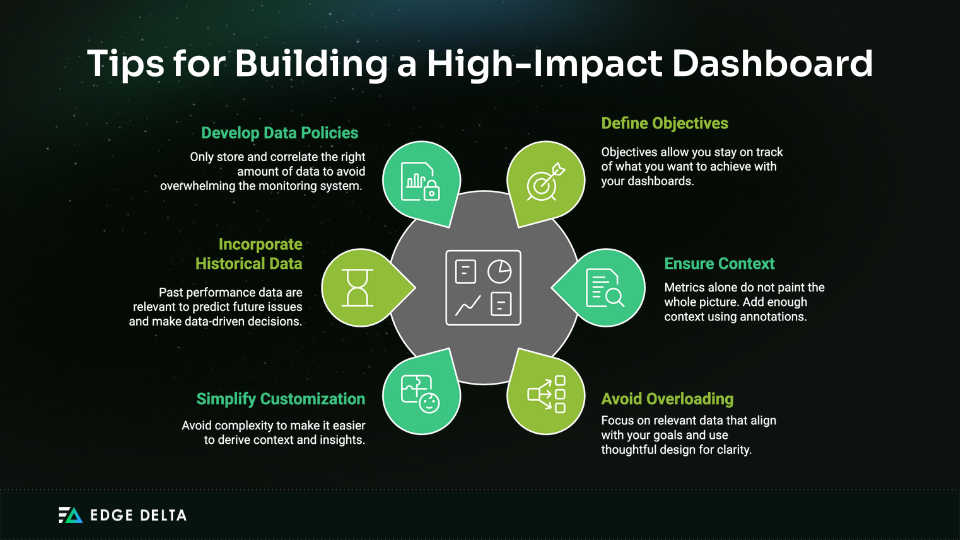
Dashboards do not just reflect data; they help you make sense of it. Here are some dashboard design-specific tips:
- Identify your audience and know what they want to know.
- Position key metrics for quick assessment.
- Use consistent color schemes to maintain visual coherence.
- Work beyond basic graphs and charts or develop your own, yet prioritize clarity.
- Include annotations for significant events.
- Enable drill-down capabilities for detailed analysis.
- Adopt a GitOps approach and manage dashboards through code to enable easy updating, control, and sharing.
- Choose appropriate visualizations for various data types, whichever effectively communicates insights.
- Gather inputs from developers, operations, and stakeholders to improve dashboards.
It is also crucial to conduct maintenance and updates. As your data sources and objectives may change, your dashboards should adapt. This step ensures that your dashboards remain relevant and practical.
Implementing Automated Alerts
Automated alerts are crucial in data monitoring. Your dashboard alerts you to spikes, dips, outliers, or level shifts so you can take immediate action. You can create custom alerts based on specific thresholds and conditions.
Pro TipYou can leverage observability platforms like Edge Delta to detect anomalies and receive immediate alerts automatically. This tool lets you get insights upstream and recommended actions for immediate but effective responses.
Here are the importance of implementing automated alerts based on correlated data:
- Allows early detection of issues
- Can automatically detect correlations in data
- You can set correlation rules to reduce false positives
- Minimizes downtime or disruptions to services or operations
- You can set thresholds for critical metrics
- Shifts monitoring from reactive to proactive
- Promotes timely response
- Help identify areas for optimization
- Contributes to continuous improvement efforts
When anomalies go undetected for long, they impact system stability, customer experience, and business productivity. Automated alerts empower you to identify threats proactively, which is an essential advantage in your observability efforts.
Best Practices for Context and Correlation
Correlation in observability means identifying the association of data from multiple datasets and types for insights into their relationship.
Understanding correlation helps derive accurate context. It allows one to make the correct predictions, discover trends, and properly uncover hidden relationships with data.
Here are some tips to execute proper implementation for context and correlation.
Regularly Update Contextual Data
Data collection, analysis, and action to derive context are continuous cycles. Since systems and applications constantly evolve, ensure the context remains relevant.
Some ways to update contextual data are the following:
- Schedule regular data refresh intervals
- Implement automated data collection pipelines
- Update monitoring threshold based on changing performance expectations
- Implement advanced analytics techniques
- Integrate additional data sources for new insights
- Modify visualizations to reflect current operational priorities
- Conduct feedback loops and performance testing
- Monitor industry trends that may necessitate adjustments
Outdated context leads to misunderstood data. You must review and update contextual data to adapt to changing needs, expectations, and environments.
Continuously Refine Correlation Rules
Correlation rules are templates for relating multiple logs. They specify several event series that constitute a more significant incident, the time frame between events, and any necessary conditions.
These rules need refinement because systems and applications are not static; your rules must adapt to changing environments. This feature promotes accuracy in issue detection and resource optimization utilization.
Here’s how to do it:
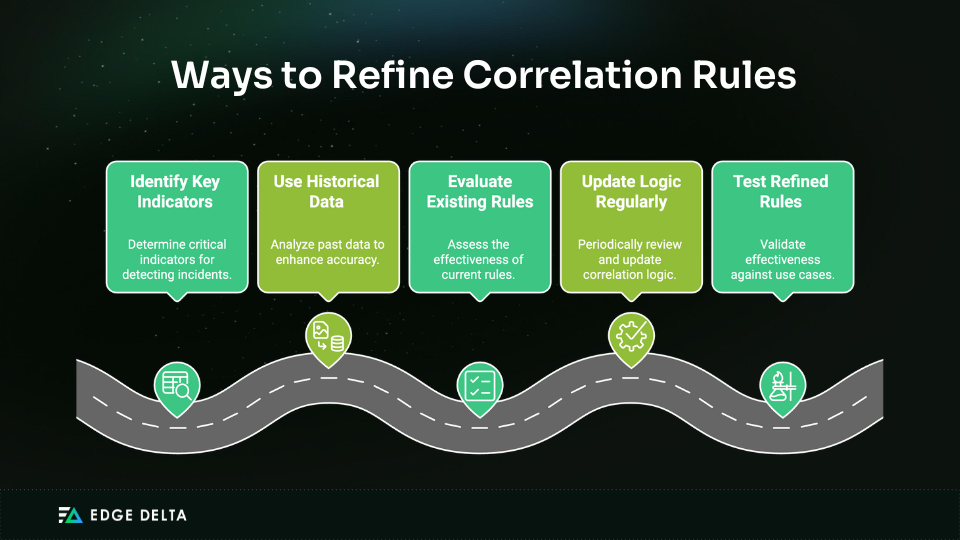
Remember to record your refined correlation rules, including their purpose, criteria, and expected outcomes. This practice is for documentation purposes and to communicate these to relevant teams for awareness and alignment.
Training and Documentation
Accurate context and correlation procedures may require training and education among teams. The level of expertise varies from person to person. Be patient and ensure they understand the value of context and correlation in their daily tasks to achieve observability.
Here are some ways to execute this:
- Workshops on using observability tools
- Documentation of best practices
- Interpretation of use cases
- Knowledge sharing across teams
- Strategic hires, partnerships, or observability services
Training and upskilling your teams ensures they leverage tools and execute practices effectively. Conduct these regularly to constantly improve the context and correlation processes and harness the full potential of observability.
Challenges in Implementing Context and Correlation
Context and correlation may sound simple but challenging due to the complexity of multi-layered environments. For instance, your system’s log formats differ from others, making it difficult to compare them directly and get context.
Here are some challenges you’ll likely face with context and correlation:
Common Challenges
Big or small organizations face drawbacks when implementing context and correlation. For instance, metrics from varying clouds are generated at different intervals. This problem means data points available for correlation are not synchronized, hampering one-to-one comparisons.
Here’s a non-exhaustive list:
- Data stored in multiple locations, owned by different teams
- Different data formats and schemas
- Time synchronizations
- Data silos
- Integration issues
- High data volume
- Highly complex IT infrastructures
- Complex patterns in incidents
- Configuring and tuning correlation rules
- Team skills and expertise
- Budget constraint risks
Overcoming Challenges
You may not get in control of everything in context and correlation. Fortunately, the hacks to get around them are accessible at hand. Here are the corresponding answers to the list of challenges above.
- Centralization
- Standardized logging and monitoring
- Distributed tracing tools that provide synchronized timestamps
- A unified data architecture approach
- Data integration platforms or middleware
- Observability tools that provide unified visibility across heterogeneous environments
- Utilize scalable storage solutions
- Advanced correlation algorithms using machine learning
- Observability platforms with built-in rule libraries
- Train teams, development programs, and engage with external experts
- Prioritize initiatives that offer significant operational efficiencies and long-term benefits
Conclusion
Without context and correlation, there would be no observability. Context is the framework within which data points acquire meaning, which is possible after correlating relevant data. They enable teams to detect threats in real time, find the root cause of issues, boost system performance, and make thoughtful decisions.
To implement context and correlation, you must collect data and establish relationships between them. Next, visualize insights and set up alert mechanisms.
It is wise to use observability tools to automate context and correlation processes. One great tool is Edge Delta: it processes data as it is created for quicker detection of trends and potential problems.
FAQs on Observability
What is observability and why is it important?
Observability is when you can measure your system’s internal state using the data it emits. This process allows you to gain insights into the whole infrastructure, which is essential for operations.
What are the three components of observability?
Observability has three critical types of telemetry data: logs, metrics, and traces.
What are the techniques of observability?
Observability techniques include logging, distributed tracing, metrics monitoring, anomaly detection, and tool utilization.
How do you implement monitoring and observability?
Monitoring involves collecting and analyzing aggregate data from systems using a predefined set of metrics and logs. Meanwhile, experts like DevOps may need to correlate gathered telemetry, see system/application performance, and achieve observability.

