


AWS Lambda cold starts are one of the most talked-about serverless performance issues, but for many applications, they are largely inconsequential. AWS has stated that fewer than 1% of Lambda invocations experience a cold start, which means most workloads never feel a meaningful impact.
That calculus changed in August 2025, when AWS began billing for the Lambda INIT phase. For functions with heavy startup logic, this shift can increase Lambda spend by 10–50%, turning an occasional performance issue into a recurring budget line item.
Many teams overspend on fixes. It is not uncommon to see organizations spend $500 per month on provisioned concurrency to solve what is effectively a $50 problem.
This guide breaks down when AWS Lambda cold starts actually matter, how the new billing model changes the equation, and how to choose cost-effective performance optimization strategies without overspending.
Key Takeaways:
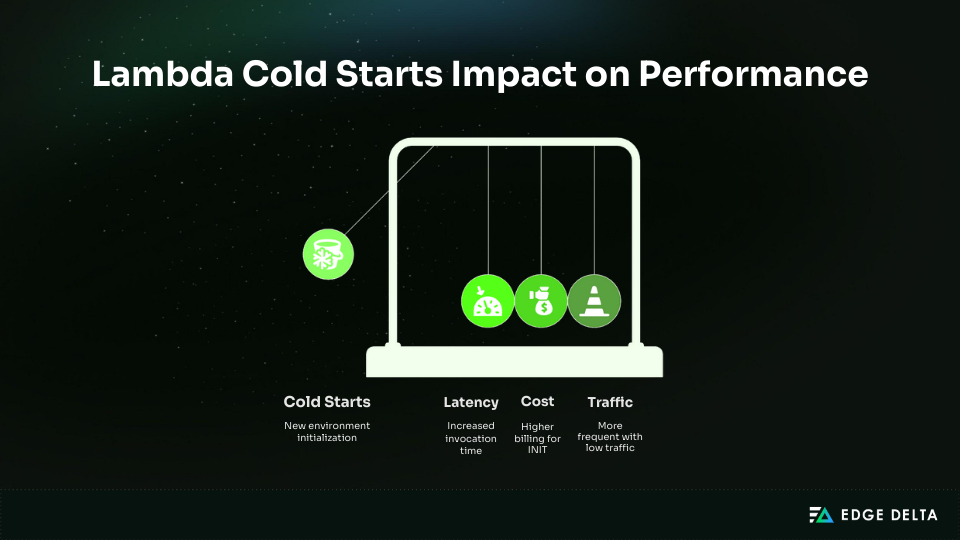
• Cold starts occur when AWS Lambda creates a new execution environment and typically add 100 ms to 5 seconds of initialization time, depending on the runtime and dependency size.
• For most applications, cold starts are uncommon. AWS reports that fewer than 1% of invocations experience a cold start, though rates increase with bursty or unpredictable traffic.
• In August 2025, AWS began billing for the Lambda INIT phase, turning cold starts into a direct cost concern, especially for Java and C# functions.
• Runtime choice has a significant impact on startup time. Python and Node.js functions usually initialize in 200–400 ms, while Java and C# often take 500–2,000 ms or longer without optimization.
• Cold starts matter most for strict latency requirements, such as user-facing APIs with sub-100 ms SLAs, real-time systems, or long synchronous Lambda chains.
• Most workloads do not require cold start mitigation. Asynchronous processing, batch jobs, scheduled tasks, and low-traffic APIs typically perform well without optimization.
What Are Lambda Cold Starts?
Cold starts are the initialization overhead that occurs when AWS Lambda prepares a new execution environment. Understanding what happens during this setup phase helps identify where Lambda cold start optimization efforts matter most.
Cold Start vs Warm Start
Lambda reuses environments whenever possible, resulting in warm starts that add <10 ms.
A cold start occurs when Lambda creates a new environment, usually on the first invocation or after 5–45 minutes of idle time. Cold starts also happen during scaling events, code updates, and environment recycling.
The Lambda Execution Lifecycle
Every invocation moves through three phases:
-
INIT
-
This phase creates a new execution environment. All cold start latency happens here.
-
During INIT, AWS performs several steps before your handler runs:
- Allocate resources (50–100 ms)
- Download and extract code (50–500 ms)
- Initialize the runtime (50–1,000 ms)
- Run initialization code (0–5,000 ms)
-
-
INVOKE
- The handler runs. Warm invocations skip INIT and typically add less than 10 ms of overhead.
-
SHUTDOWN
- The environment is frozen or recycled.
Example: INIT vs INVOKE in Practice
# Runs during INIT
`import boto3 import pandas as pd import tensorflow as tf
dynamodb = boto3.client(‘dynamodb’) model = tf.keras.models.load_model(‘my_model.h5’) # 2–3 seconds`
# Runs during INVOKE
def lambda_handler(event, context): return model.predict(event['data'])
Heavy initialization can push cold start latency into the multi-second range, which is noticeable for sensitive workloads.
Why Cold Starts Happen More With Certain Traffic Patterns
Cold starts are far more common when Lambda traffic is irregular. Functions with steady request volume tend to stay warm, while idle functions are more likely to start from a fresh execution environment.
In practice, cold start rates often follow this pattern:
- High traffic (≈100 req/min): <0.5% cold starts
- Bursty traffic (≈10 req/hour): 30–50% cold starts
- Very low traffic (≈5 req/day): more than 90% cold starts
Before August 2025, cold starts were primarily a latency concern. For ZIP-based managed runtimes, AWS did not bill for the INIT phase, so the cost impact was typically negligible.
That changed on August 1, 2025. AWS now bills the INIT phase the same way it bills invocation duration, making cold start frequency a cost factor in addition to a performance one.
Example (512 MB, 2-second INIT):
- Before: ~$0.80 per 1M cold starts
- After: ~$17.80 per 1M cold starts
This change affects Java and C# most due to longer initialization times, and it matters most for workloads with low or unpredictable traffic.
Cold Start Performance by Runtime: Real Benchmarks
Runtime choice has a significant impact on cold start performance. Compiled runtimes such as Java and C# incur higher initialization overhead, which makes cold starts harder to mitigate without techniques like SnapStart or targeted code optimization.
Runtime Comparison Table
Benchmarks use a minimal Hello World function, 512MB memory, and no VPC.
| Runtime | Cold Start p50 | Cold Start p99 | Warm Start | Best For | Avoid For |
|---|---|---|---|---|---|
| Python 3.12 | 200–300ms | 400–600ms | <10ms | Data, APIs, ML | None |
| Node.js 20 | 200–400ms | 500–700ms | <10ms | APIs, webhooks | Compute-heavy |
| Go | 250–400ms | 500–800ms | <5ms | High-performance APIs | Prototypes |
| Java 17 | 800–2,000ms | 2,000–5,000ms | <10ms | Enterprise apps (SnapStart) | User-facing APIs |
| C# .NET 8 | 500–1,500ms | 1,500–3,000ms | <10ms | Enterprise apps (SnapStart) | Real-time APIs |
| Ruby | 300–500ms | 600–900ms | <10ms | Automation | High-frequency |
| Rust | 150–300ms | 300–500ms | <5ms | Performance-critical | Rapid prototyping |
| Custom Runtime (LLRT) | 100–200ms | 200–400ms | <5ms | Node.js replacement | Legacy |
What Actually Drives Cold Start Time
Cold start duration is mainly determined by runtime behavior, with memory and package size acting as multipliers. VPC configuration is no longer a major factor.
- Runtime model: Compiled runtimes such as Java and C# perform additional work during startup. These steps often add 1.2–5+ seconds. Interpreted runtimes mostly handle imports and typically finish in 200–500 ms.
- Memory allocation: More memory provides more CPU during initialization. Doubling memory usually reduces cold start time by about 30%, though cost also doubles. Most functions balance cost and performance best at 512–1024 MB.
- Package size: Larger deployment packages take longer to download and extract. Reducing a package from 45 MB to 8 MB can cut cold start time by roughly 70%.
- VPC configuration (current): Pre-2019 VPC cold starts were 10–15 seconds, but Hyperplane removed ENI creation delays. Today, VPC adds under 50 ms and rarely affects cold starts unless heavy networking runs during INIT.
When Should You Actually Worry About Cold Starts?
Cold starts only matter for certain workloads. Their impact depends on frequency, latency requirements, and whether users wait for responses. Many applications see so few cold starts that they are never noticeable in production.
Decision Framework: Do Cold Starts Matter?
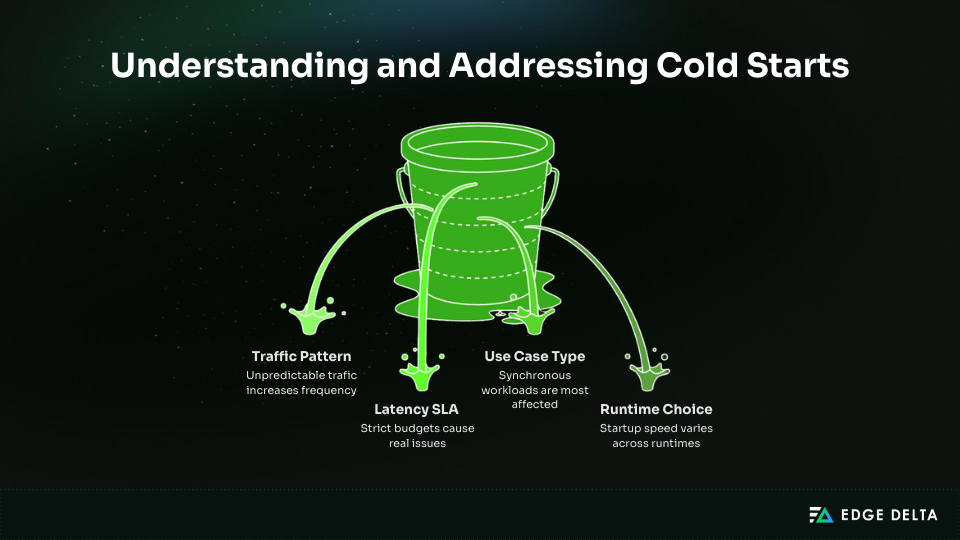
Cold start relevance depends on four main factors:
- Traffic Pattern: Cold start frequency increases as traffic becomes less predictable. Functions with steady traffic remain warm, while idle functions often start from scratch. Workloads that jump from zero to high volume usually see cold starts clustered at the start of each burst.
- Latency SLA: Sensitivity depends on how tight your latency budget is. APIs targeting sub-100 ms p99 are affected, while workloads with p99 around 2 seconds usually are not. If your SLA allows visible variance, cold starts rarely become a bottleneck.
- Use Case: Synchronous workloads are the most affected because users wait for the response. Asynchronous pipelines, batch jobs, and scheduled tasks operate without user-facing latency, so occasional delays have minimal impact.
- Runtime Choice: Startup speed varies by runtime. Python and Node.js are usually fast enough. Java and C# often need mitigation like SnapStart. Go and Rust have consistently low startup times and work well for real-time systems.
Where Cold Starts Do Not Matter
Cold starts rarely matter for asynchronous or non-interactive workloads, such as batch jobs, scheduled tasks, background processing, internal tools, and low-frequency webhooks, where users are not waiting for an immediate response.
They become a concern for user-facing APIs with strict latency requirements. Authentication flows, checkout paths, mobile experiences, real-time interactions, and multi-step synchronous workflows all surface delays that users can see and feel, and those delays can quickly compound.
The 1% Rule
AWS data indicates that cold starts impact fewer than 1% of invocations. For 10,000 daily requests, that translates to roughly 100 cold starts.
With a 500 ms delay per cold start, the effect on average latency is only about 5 ms per request, making optimization unnecessary in most cases unless SLAs are strict or each transaction is critical.
The Cost of Cold Starts
The August 2025 INIT billing change shifts how teams approach cold starts. INIT time is now billed the same way as invocation duration, so every cold start carries a direct cost.
Understanding this cost helps teams avoid unnecessary optimization and prevents spending more on fixes than the problem actually warrants.
How INIT Billing Works
Cold starts follow the standard Lambda duration formula:
Cost per cold start = Memory in GB × INIT duration (seconds) × Price per GB second
Cold Start Cost Comparison
INIT billing affects runtimes differently. The table below compares cold start costs under identical settings (512 MB, US East 1).
| Runtime | INIT Duration | Cost per Cold Start | Cost per 1M | Percent of Invoke Cost |
|---|---|---|---|---|
| Python 3.12 | 250 ms | 0.0000021 | 2.08 | 20–30% |
| Node.js 20 | 300 ms | 0.0000025 | 2.50 | 25–35% |
| Go | 350 ms | 0.0000029 | 2.92 | 30–40% |
| Java 17 (no SnapStart) | 2000 ms | 0.0000167 | 16.67 | 200–400% |
| C# .NET 8 | 1500 ms | 0.0000125 | 12.50 | 150–300% |
| Java 17 (SnapStart) | 200 ms | 0.0000017 | 1.67 | 15–20% |
Real Cost Scenarios
Raw numbers can mislead. These scenarios show when INIT billing is noise, when it drives cost, and when it looks bad but does not matter.
High-volume Python API* (Cold starts are noise)*
- 10M invocations, 5% cold starts
- INIT cost: $1.05
- Invoke cost: $8.00
INIT is only 12% of the bill. Optimization adds little value.
High-volume Java API without SnapStart (INIT dominates)
- Same traffic profile
- INIT cost: $8.35
- Total cost: $16.35
INIT becomes 51% of spend. This is where optimization matters.
Low-traffic Lambda (Cold starts are frequent but cheap)
- 100K invocations, 80% cold starts
- Total monthly cost: $0.25
INIT is proportionally high but economically irrelevant.
INIT billing becomes relevant when monthly Lambda spend exceeds roughly $50 and cold start duration makes up a meaningful share of execution time. This most often affects Java or .NET functions without SnapStart and high-volume workloads with long initialization phases.
Cold Start Mitigation Strategies: Costs and Trade-Offs
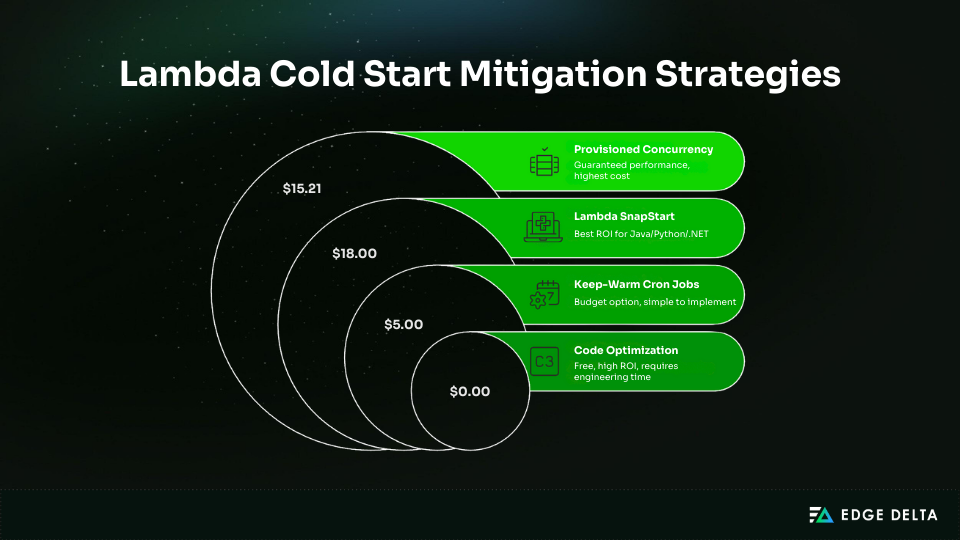
Cold start mitigation options vary in cost, complexity, and performance impact. Each strategy offers different benefits, so teams should evaluate ROI before adopting any solution. The four approaches below represent the most common techniques used in production.
Strategy 1: Provisioned Concurrency (Guaranteed Performance, Highest Cost)
Provisioned concurrency keeps Lambda environments pre-warmed so they start instantly. It removes cold starts for the configured concurrency, making it the most reliable but also the most expensive option.
Pricing formula: Memory (GB) × Concurrency × Hours × 0.0000041667
A 512 MB function with 10 provisioned environments for 730 hours costs $15.21/month, often ending at $20–30/month with invoke charges.
Monthly Cost Examples
| Concurrency | 512MB | 1024MB | 2048MB |
|---|---|---|---|
| 1 | $1.52 | $3.04 | $6.08 |
| 10 | $15.21 | $30.42 | $60.83 |
| 50 | $76.04 | $152.08 | $304.17 |
Provisioned concurrency should be sized based on steady-state load. A simple estimate is requests per second multiplied by average execution time. For example, 50 rps with a 200 ms duration requires about 10 concurrent environments.
Strategy 2: Lambda SnapStart (Best ROI for Java/Python/.NET)
SnapStart captures a snapshot of your function after initialization and restores it during cold starts, reducing startup latency significantly.
Pricing:
- Cache: 0.0000015046 per GB-second
- Restore: 0.0001397998 per GB
A 1 GB function with 100,000 cold starts costs roughly $18/month.
Performance Improvements
| Runtime | Typical Cold Start | With SnapStart |
|---|---|---|
| Java | ~2,000 ms | ~200 ms |
| Python | ~500 ms | ~200 ms |
| .NET | ~1,500 ms | ~400 ms |
Alt tag: Runtime cold start reduction with Lambda SnapStart
SnapStart supports Java 11, 17, and 21, Python 3.12+, and .NET 8. It delivers large cold start reductions at low cost with minimal code changes, but requires snapshot-safe initialization, snapshots expire after 14 days, and runtime support is limited.
Strategy 3: Keep-Warm Cron Jobs (Budget Option)
A scheduled EventBridge rule triggers the function every 5 minutes to keep the environment warm. This prevents most cold starts for steady traffic.
EventBridge provides 1M free events, so compute costs are often under $0.001/month, with the real cost coming from execution time. Most teams spend $5–20/month to keep several functions warm.
Keep-warm schedules are simple and inexpensive and work across all runtimes, but they do not handle burst scaling well and introduce extra invocations. They are best suited for staging environments, low-traffic services, and budget-sensitive workloads.
Strategy 4: Code Optimization (Free, High ROI)
Reducing the Lambda INIT phase is the most cost-effective strategy. Smaller packages, fewer imports, and efficient initialization consistently reduce cold start time.
Shrinking a deployment package from 45 MB to 1 MB can drop cold starts from 800 ms to ~200 ms. Lazy loading defers heavy work until the handler runs.
Key Techniques:
- Use Lambda Layers to cache large dependencies
- Prefer arm64 (10–15% faster cold starts, ~20% cheaper)
- Increase memory to 512–1024 MB for more CPU during INIT
These improvements require only engineering time and provide the strongest free ROI.
Decision Framework: Should You Optimize Cold Starts?
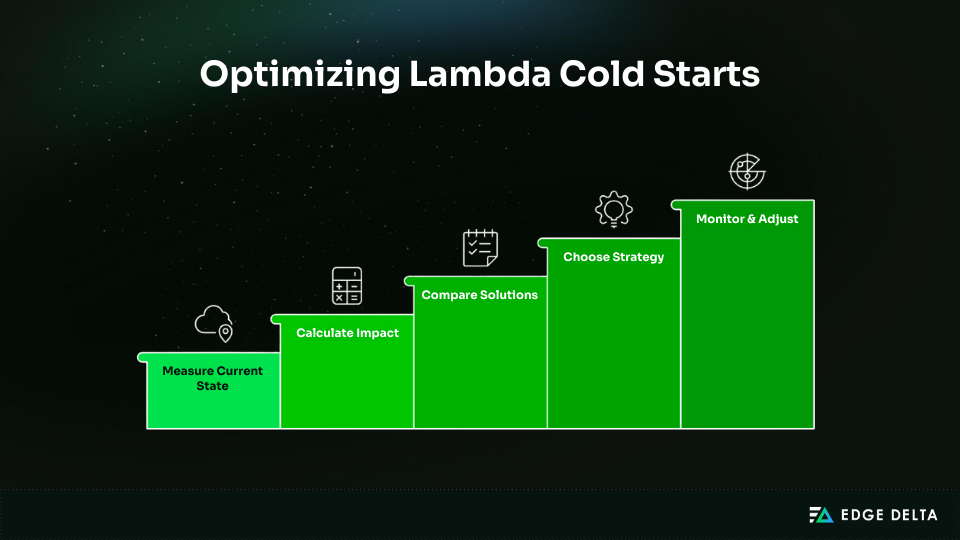
Optimizing cold starts only makes sense when the impact is measurable. This framework helps you evaluate your current state, calculate cost, and select a strategy with confidence.
Step 1: Measure Current State
Start with accurate baseline data. Measure how often cold starts occur and how much latency they add to user-facing operations.
Required metrics:
- Cold start frequency using the Init Duration metric
- Cold start duration from CloudWatch Logs
- P50, P95, P99 latency with and without cold starts
- User or revenue impact during slow responses
How to measure:
fields @timestamp, @duration, @initDuration
| filter @type = "REPORT"
| stats
     count() as invocations,
    sum(@initDuration > 0) as cold_starts,
    avg(@duration) as avg_duration,
    pct(@duration, 95) as p95,
    pct(@duration, 99) as p99
Step 2: Calculate Impact
Estimate financial or user-experience impact:
Impact = Cold start frequency × Cold start penalty × User sensitivity
For example, let’s say we have 5% cold starts, a 500 ms penalty, and 10,000 daily requests. If each slow request costs $0.50, the impact is about $250 per day, or $7,500 per month.
Step 3: Compare Solutions
| Solution | Monthly Cost | Reduction | Net Benefit | ROI |
|---|---|---|---|---|
| Do Nothing | $0 | 0% | –$7,500 | N/A |
| Code Optimization | $0 | 40–60% | –$3,000 to –$4,500 | Infinite |
| Keep-Warm Cron | $15 | 70–90% | –$750 to –$2,250 | 150–500× |
| SnapStart | $18 | 80–90% | –$750 to –$1,500 | 100–400× |
| Provisioned Concurrency (10) | $150 | 100% | $0 | 50× |
| Provisioned Concurrency (25) | $380 | 100%+ | –$130 | 20× |
Alt tag: Cold start optimization cost and ROI comparison table
Step 4: Choose Strategy
Once you have a baseline and an estimated impact, the remaining decision is how much to spend to reduce it.
- Cost < $10/month: Do nothing
- $10–$50: Apply code optimizations
- $50–$500: Use SnapStart or keep-warm
- $500–$5,000: Add provisioned concurrency
- $5,000: Full optimization and tuning
Step 5: Monitor and Adjust
Track cold start frequency, p99 latency, and Lambda costs to ensure the strategy remains effective. Review quarterly, adjusting provisioned concurrency for load changes and adopting improvements AWS releases.
Monitoring Cold Starts
Cold start issues cannot be solved without visibility. Proper monitoring helps determine whether cold starts meaningfully affect latency or cost, and whether mitigation is necessary.
This often requires forwarding Lambda logs with a lightweight extension so INIT metrics and outliers can be analyzed before logs ever reach CloudWatch. The key is to track INIT behavior, latency distribution, and how often cold starts occur during real traffic.
Essential Metrics to Track
Before optimizing cold starts you need to understand how often they occur and how much time they add.
1. INIT Duration: Identifies when a cold start happens and how long initialization takes.
CloudWatch Logs Insights query:
fields @timestamp, @initDuration, @duration
| filter @type = "REPORT" and @initDuration > 0
| stats
     count() as cold_starts,
    avg(@initDuration) as avg_init,
    max(@initDuration) as max_init,
    pct(@initDuration, 95) as p95_init
2. Cold Start Percentage: Useful for understanding how often functions start cold.
fields @timestamp
| filter @type = "REPORT"
| stats
     count() as total,
    sum(@initDuration > 0) as cold,
    (sum(@initDuration > 0) / count() * 100) as cold_pct
3. X-Ray Trace Analysis: Shows where cold starts affect end-to-end latency in a multi-step workflow.
Capturing these metrics consistently requires structure at ingestion time. Many teams rely on structured analysis of Lambda logs using pipeline packs to normalize INIT duration, cold start flags, and latency percentiles across functions.
CloudWatch Alarms to Configure
Once cold start behavior is understood, alerts help catch regressions caused by traffic changes, dependency growth, or runtime updates. Recommended alarms include:
- Cold start percentage above 5% for five minutes
- p99 latency more than twice the baseline
- INIT duration exceeding three seconds
Cost-Effective Monitoring
CloudWatch Logs can become expensive at scale. Many teams use a telemetry pipeline solution such as Edge Delta to filter logs, retain cold start outliers, and aggregate metrics before sending data to CloudWatch, often reducing volume by 60–80%.
For example, reducing monthly logs from 500 GB to 100 GB can lower CloudWatch charges from about $250 to $50 while preserving essential performance data.
At higher scale, observability itself becomes a scaling problem. Using telemetry pipelines and cloud fleets for serverless workloads allows teams to process Lambda data close to the source, reducing downstream cost and noise.
Common Cold Start Mistakes
Many teams waste money by applying the wrong cold start fixes. Most issues come from over-provisioning, unnecessary provisioned concurrency, ignoring SnapStart, or poor code optimization. These mistakes create avoidable costs and rarely solve the real problem.
Mistake 1: Enabling Provisioned Concurrency Everywhere
Teams often enable provisioned concurrency everywhere, which can wildly inflate costs. For example, 50 functions with 5 provisioned concurrency each cost about $19,000 per year, even when cold starts only cost around $50 a month. Use it only for strict latency APIs.
This is a common outcome when teams optimize Lambda performance without first applying basic cost-reduction techniques across memory sizing, execution duration, and log volume.
Mistake 2: Over-Provisioning Concurrency
Provisioning 100 concurrency when peak demand requires just 3 increases cost from $4 to $152/month, wasting over $1,700 annually. Monitor ProvisionedConcurrencySpilloverInvocations and scale based on data.
Mistake 3: Not Using SnapStart for Java
Java cold starts can reach 2 seconds without SnapStart. Some teams offset this with provisioned concurrency costing $150/month. SnapStart typically reduces cold starts to ~200 ms for about $18/month. Test SnapStart first for Java, Python, and .NET.
Mistake 4: Warming Functions 24/7 for Irregular Traffic
Keeping functions warm for workloads with only ~20 daily requests is rarely worth it. Cold start impact is around 10 seconds/day, while keep-warm methods can cost $120/year. Accept cold starts for workloads under 100 daily requests.
Mistake 5: Ignoring Code Optimization
Heavy frameworks create long cold starts. Spring Boot may produce 4-second cold starts, while Micronaut can reduce them to ~400 ms. Without optimization, teams may spend $150/month on provisioned concurrency unnecessarily. Optimize code first.
Mistake 6: Not Monitoring After Optimization
SnapStart snapshots expire after 14 days of inactivity, and dependency or runtime changes can break restores. These issues reintroduce cold start latency. Monitor cold start metrics continuously and alert when percentages rise. Edge Delta’s SRE Teammate can automate this monitoring — tracking cold start trends and triggering investigations when latency spikes without requiring manual setup.
As Lambda usage grows and execution models change, teams must consider cost, performance, and observability together. Broader data growth trends that stress observability systems help explain why even small issues like unnecessary cold start logging add up over time.
Frequently Asked Questions
Are cold starts still a problem in 2025?
Cold starts still happen but are usually minor. Python and Node.js start in about 200 to 400 ms, while Java and C# improve a lot with SnapStart. AWS says under 1% of invocations see cold starts, mainly impacting strict latency APIs and chained synchronous workflows.
How much does provisioned concurrency actually cost?
Provisioned concurrency costs $0.0000041667 per GB-second and is billed even when the function is idle. For a 512 MB function, 10 instances cost roughly $15 per month, 50 instances around $76, and 100 instances about $152. Most workloads only require 3 to 10 instances.
Is SnapStart better than provisioned concurrency?
SnapStart is a good choice when cold starts are infrequent and 200–400 ms delays are acceptable. It costs roughly $4–$20 per month and can reduce Java cold-start times by about 10×. Provisioned concurrency eliminates cold starts entirely but comes at a much higher cost. Note that SnapStart does not support Node.js or Go.
Do I need to optimize cold starts for async processing?
Cold starts have little impact on asynchronous tasks since users are not waiting for immediate responses. INIT times of 500–2,000 ms are usually acceptable. To save costs, avoid using provisioned concurrency for async workloads. Only multi-step asynchronous pipelines may benefit from optimization.
Will increasing memory reduce cold starts?
Yes. Allocating more memory provides more CPU, which can reduce cold-start times by roughly 30%. For example, increasing a function from 256 MB to 512 MB can cut a 400 ms cold start to about 280 ms, with diminishing returns beyond that. Most workloads perform well with 512 to 1,024 MB of memory.
References
- aws.amazon.com
- docs.aws.amazon.com
- aws.amazon.com
- aws.amazon.com
- lumigo.io
- docs.aws.amazon.com
- docs.aws.amazon.com
- aws.plainenglish.io
- docs.aws.amazon.com
- aws.amazon.com
- docs.aws.amazon.com
- aws.amazon.com
- docs.aws.amazon.com
- docs.aws.amazon.com
- docs.aws.amazon.com
- aws.amazon.com
- aws.amazon.com
- lumigo.io
- docs.aws.amazon.com
- Zircon.tech
- dev.to/aws-heroes

