


Digital data has rapidly been increasing in the market, accounting for $100 billion in 2023. Whether from smart applications or social media posts, the data are a valuable asset to businesses.
Data might be too large or too complex to process. With data analytics, it turns raw data into invaluable information. It has become a main driver in the competitive business world that can boost businesses’ sales and operations.
This article will help you understand why businesses incorporate data in their sales and operations. Read further as we deep dive into data analytics trends and growth.
Editor’s Choice
- The global data analytics was worth $49.03 billion in 2022.
- Data has been an invaluable asset to businesses.
- More companies prefer data-driven decision-making, increasing their operation’s productivity rate to 63%.
- Data governance is the overall management of the data, and 60% of data leaders are prioritizing it.
- With more companies adopting big data and technology, the employment rate will increase to 58%.
- Incorporating business intelligence into analytics has increased operational efficiency by up to 80%.
- 95% of businesses acknowledge the challenge of using unstructured data.
- Organizations employing AI and big data analytics in their businesses have an adoption rate of 60%.
Data Analytics Research: Market Size, Growth, and Predictions
Data analytics have impacted the business landscape, accelerating their decision-making by five times. More companies up to 81% think data should be the heart of business decision-making.
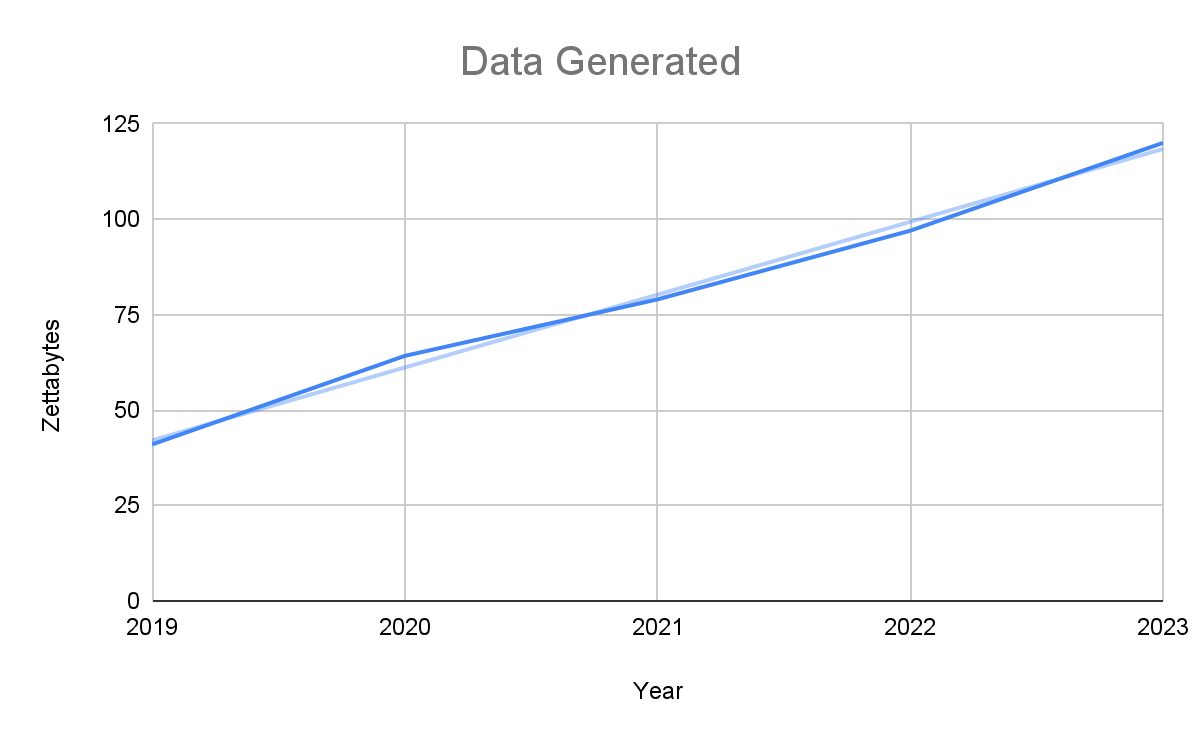
From 2019 to 2023, data creation and consumption had a surged growth of 192.68%. The demand for data started increasing rapidly when 57% of businesses increased their decision-making effectiveness.
Keep reading to learn more about data analytics’ growth and improvement over the years. The statistics listed below will give you insights into data utilization and optimization.
Data Analytics Industry: A Rapid Market Growth
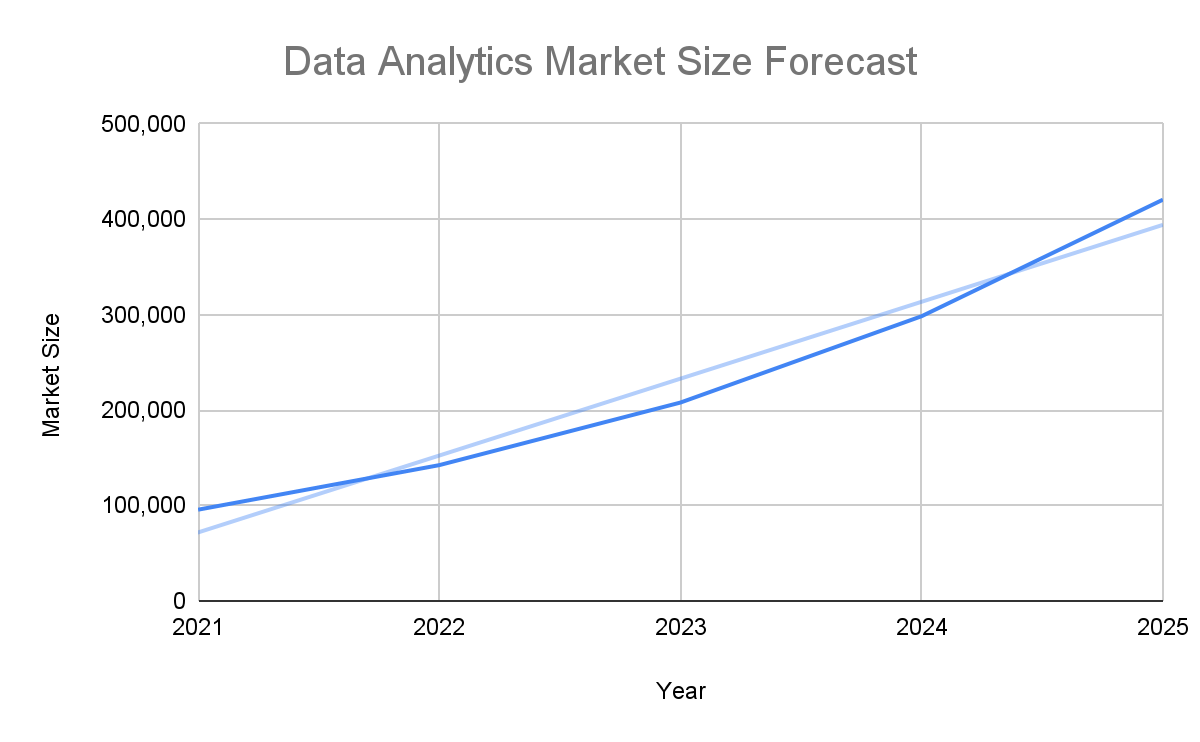
The digitalization and development of mobile technology present significant growth in the data analytics industry. In 2022, the data analytics market was valued at over $49 billion, with manufacturing holding the highest market share.
With data analytics, businesses adapt and respond quickly to market changes and customer demands, increasing the productivity rate to 63%. As a result, more companies prefer data-driven decision-making than intuition-based.
Did You Know?
Netflix uses data analysis. Each year, Netflix uses big data, achieving savings of $1 billion.
Read more as we go through data analytics facts and figures. The following sections show the various statistics, showcasing the market growth and impact.
1. North America dominated the data analytics market with a revenue share of 34.7% in 2022.
(Grand View Research)
In 2022, the global data analytics market was valued at $49.03 billion, with the Asia Pacific as the leading region. The increasing adoption rate is due to the enormous volume of data produced by social media platforms and smart applications.
North America dominates the data analytics market, amounting to 34.7%. Software and social media are some of the contributors. China follows it with 34.2%, and Western Europe with 17%.
2. In 2022, global big data analytics had a market value of $271.83 billion.
(Investopedia, Fortune Business Insights, Datafloq)
Definition:
Big data is a large, diverse information set growing exponentially. They are analyzed computationally to reveal patterns or market trends.
These large datasets are sourced and scaled down into three types:
- Structured Data
- Semi-Structured Data
- Unstructured Data
In 2022, the big data analytics market was valued at $271.83 billion. Many companies have been utilizing and implementing big data in their operations. The main market players are:
Here are the top five sectors where big data utilization is significantly impactful to the business:
- Finance and Banking
- Healthcare
- Retail and E-commerce
- Manufacturing and Supply Chain
- Transportation and Logistics
3. Managing unstructured data poses a big challenge to 95% of businesses.
(Congruity360, Rivery)
Around 1,000 petabytes of digital data are produced daily. To sort these enormous data, they are sourced and scaled down into three types:
- Unstructured Data: 80%-90% of the total volume of data generated.
- Structured Data: 20% of total data generated.
- Semi-Structured Data: 5%-10% of the total data volume.
Among the three data types, organizations utilize and invest more in structured data. This data is easier to read, interpret, and analyze. However, this data type occupies 20% of the total data volume.
The majority of the data falls under the unstructured data type. They are difficult to analyze with their unorganized schema, wherein 95% of businesses acknowledge the challenge of using them.
While unstructured data requires much analysis compared to structured and semi-structured, this data type provides invaluable insights for operations. These insights include but are not limited to, market trends and consumer behaviors.
4. There’s an increase of 58% in job creation related to data analysis.
(World Economic Forum)
One of the expected impacts of big data and technology adoption is the increase in the employment rate to 58%. Companies have started integrating big data analytics into their operations, accounting for 80% of the participation rate.
Listed below are the top five industries that will adopt big data analytics and technologies:
- Media, Entertainment, and Sports: 95%
- Financial Services: 91%
- Health and Healthcare: 89%
- Automotive and Aerospace: 89%
- Professional Services: 88%
The above-mentioned industries have the highest adoption rate, yet their employment rates differ. For the big analytics adoption on jobs, the following list will boost their employment to keep up with the trend:
- Automotive and Aerospace: 78%
- Care, Personal Services and Wellbeing: 71%
- Professional Services: 71%
- Government and Public Sector: 69%
- Agriculture and Natural Resources: 68%
5. 68% of Chief Data Officers want to improve the use of insights and analytics.
(Deloitte)
A Chief Data Officer manages an organization’s data operations and quality management. CDO drives business value through data analytics and ensures data governance and security.
Here are the percentage of CDOs and their focus area:
| Field of Expertise | Percentage |
|---|---|
| Data Management | 73% |
| Data Strategy and Governance | 47% |
| Data Engineering | 47% |
| Insights and Analytics | 40% |
| Data Science | 40% |
Organizations are keeping up with digital and data trends. However, the organization should invest in human resources to maximize utilization and have the best ROI.
In a survey, 71% of chief data officers expressed concern with their organization’s limited data skills. Another challenge known by 54% of CDOs is data literacy. Data literacy is also an acknowledged challenge to 54% of CDOs.
CDOs focus on embedding analytics, improving data strategy, and changing organizational data culture to counter these known challenges.
Data Analytics Trends and Predictions
Data analytics has become more pervasive and composable. More businesses at around 65% will transition from intuition-based to data-driven decision-making by 2026.
Businesses will invest in tools and technologies closely aligned with their sales and operations. It will aid the experts in providing a richer and more detailed view of the bulk of data.
Look at the latest trends that help shape and boost the data analytics market.
6. AI and ML: 60% of organizations employ AI and ML in their operations.
(World Economic Forum, Statista)
The Artificial Intelligence market covers a wide range of industries, amounting to around $200 billion in 2023. Different AI use cases have been developed and improved to cater to the needs.
Businesses have been employing AI and big data analytics trends, with a total adoption rate of 60%. By embedding AI and ML with data analytics tools, organizations can boost the extraction and analysis of unstructured data.
AI Teammates apply this same capability to operational data — using AI agents to analyze logs, metrics, and traces and surface actionable insights for engineering teams.
AI market size has grown from 2021 to 2023. See the table below for the projected market size from 2024 to 2025.
7. Business intelligence: Improves 80% operational efficiency of organizations.
(Coursera, Marketsplash, Finances Online)
Business Intelligence refers to the data analysis process in gaining insights from internal and external sources. It consists of strategies and technologies to help businesses make better data-driven decisions.
Extracting actionable insights from vast datasets poses a significant challenge to businesses. However, BI allows businesses to make decisions five times more efficiently and effectively.
Every business uses an average of four BI tools. Incorporating BI into analytics has improved the following areas of the companies:
- Operational efficiency: 80%
- Revenue growth: 12%
- Cost reduction: 23%
8. Cloud-computing: 54% of companies considered using cloud and BI in data analytics.
(IBM, Microsoft, Humans of Data)
Cloud computing gives more flexibility to the business. It offers computing services, including servers, databases, and networking over the Internet (the cloud).
Twenty-one percent of companies store large amounts of data in internal physical data centers. However, 54% have started investing in cloud computing to store, access, and analyze large volumes of data.
- Cloud repositories: 498 terabytes
- Third-party data center: 407 terabytes
- Edge and remote locations: 390 terabytes
9. Data governance: Top priority for 60% of data leaders.
(Mordor Intelligence, Marketsplash)
Data governance is the overall management of the data’s availability, security, and usability. Managing a large volume of data has become the top priority as data grows exponentially.
Due to the data growth, the data governance market was valued at $3.02 billion in 2022. Around 68% of businesses spend 30% on improving their governance framework.
Did You Know?
LinkedIn, a professional networking giant, experienced a data breach in June 2021. Around 700 million users were posted on a dark web forum, impacting over 90% of its user base.
Even with the improvements, 66% of organizations still experienced data breaches. Since data is a valuable asset, 60% of data leaders want to advance the data governance of the organization.
10. Smart Applications: Internet of Things devices will produce 79.4 zettabytes in 2025.
(Transforma Insights)
The Internet of Things (IoT) is a network of interrelated devices embedded with sensors, software, and other technologies. These devices transmit and receive data and store it in a cloud.
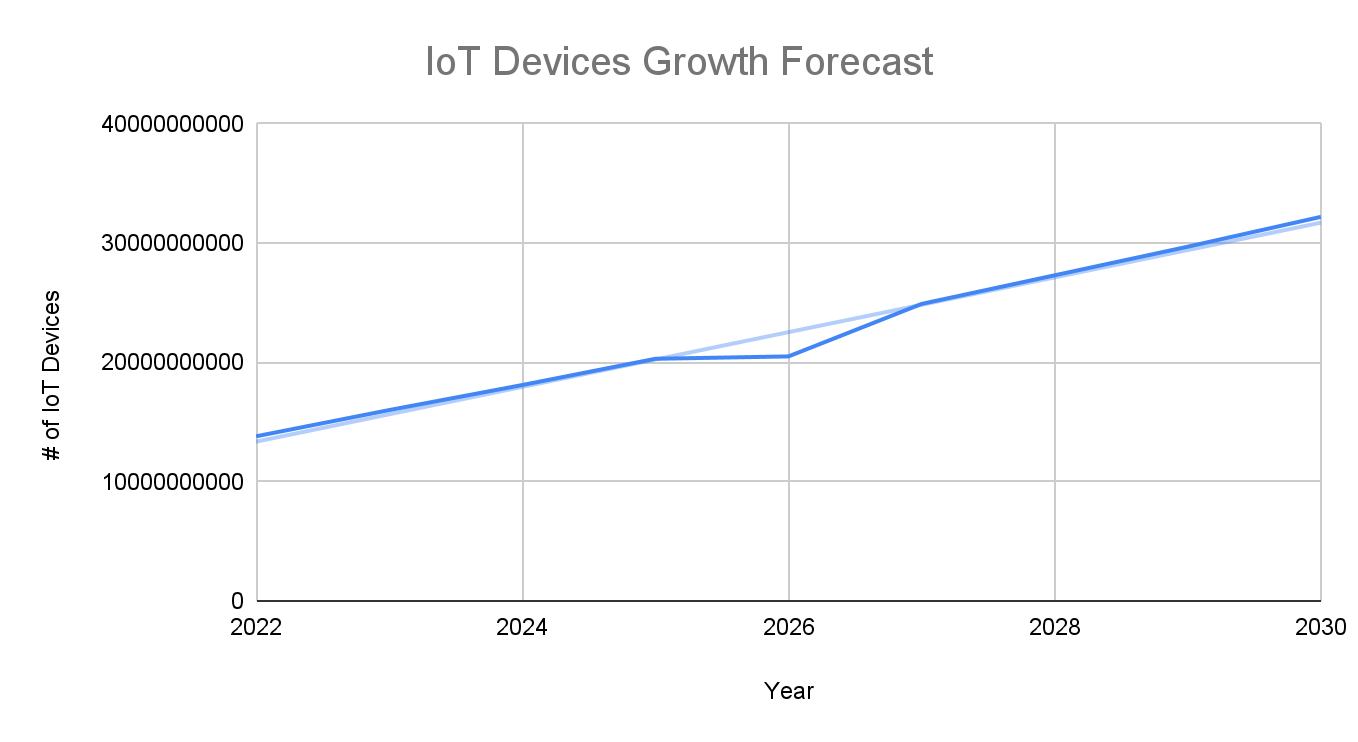
Phones are not the only smart devices. More smart homes, cities, and vehicles are available in the market. In 2023, there were 16 billion connected IoT devices. By 2025, the number of IoT connections will grow to 20.3 billion, with data produced of 79.4 zettabytes.
IoT solutions have been useful in industries and individuals. Whether it is used in enterprises or not, the more data produced in a specified interval, IoT devices store their data in a cloud.
Final Thoughts
High volume, fast velocity, and wide variation describe the overall data. The ocean of data is valuable yet can be complex and overwhelming.
With the right tools and technologies, companies can stay on track with the rapid development of the data market while also being competitive in the business world. AI Teammates are one example — purpose-built AI agents that handle the operational side of data and engineering work, from monitoring pipeline health to automating incident response.
Frequently Asked Questions
What are the 4 types of data analytics?
There are four distinct types of data analytics: descriptive, diagnostics, predictive, and prescriptive.
Does data analytics require statistics?
Yes, statistics is the backbone of data analytics.
How do you analyze data in statistics?
Analyzing data in statistics consists of hypotheses > data collection > descriptive statistics > testing > interpretation.
How to learn statistics for data analytics?
You need to learn the basic statistics for data analysis. If you are a beginner, you can take online courses for data science.

