

Alarms should protect your infrastructure, not drown your team in noise. But if you’ve ever tried managing Amazon CloudWatch alarms manually, you know how chaotic it gets, especially across multiple environments.
One forgotten threshold, or one copy-paste error, and suddenly your alerts stay silent while incidents are occurring. Without real-time alerting, critical infrastructure — including databases — will consistently struggle with a wide range of performance and health issues. That’s where AWS Cloud Development Kit (CDK) steps in.
With the Amazon CDK, you can take an infrastructure-as-code approach to creating and managing your AWS environment — including defining database alarms as cleanly and consistently as you define your Amazon Relational Database Service (RDS) instances. And if you’re ready to go beyond static thresholds, tools like Edge Delta bring anomaly detection, smarter alert grouping, and real-time context to the mix.
In this guide, we’ll walk through the simple steps of creating database alarms with AWS CDK and how to supercharge them with observability enhancements that actually scale with your system.
Let’s dive in.
Key Takeaways
• Database alarms are critical for preventing silent failures. They catch issues like storage limits, CPU overload, and connection spikes before they impact users.
• Managing alarms manually is prone to mistakes, but the Amazon CDK lets you codify them for repeatable, error-free infrastructure.
• Edge Delta turns noisy logs into meaningful signals through its Telemetry Pipelines, anomaly detection, and OnCall AI.
• Focus alarms on business-critical metrics, not just raw data.
Why Database Alarms Matter in Modern Cloud Environments
When things break, it’s usually not the flashy parts of your system. It’s the silent killers: a database running out of storage, a spike in connections, or a slow-burning CPU overload that nobody noticed until latency tanked. And by then? The damage is done.
Here’s the kicker: over 50% of outages in cloud-native environments are tied to misconfigured or missing alerts, according to AWS’s internal reliability reports.
Worse, Gartner predicts that 70% of digital transformations will fail by 2025 due to poor observability practices. If your alarms aren’t giving you real-time, actionable insight into your database layer, you’re flying blind.
Let’s not forget fatigue.
“Alert fatigue is real. It’s one of the fastest ways to burn out your engineering team.”
— Charity Majors, CTO, Honeycomb
That’s why smart, scalable database alarms matter. And that’s exactly what you’re about to build, starting with a solid CDK foundation.
Prerequisites and Setup
Before we dive into code, let’s make sure your environment’s ready to go. You don’t need a complex setup, but skipping the basics will come back to bite you.
What do you need?
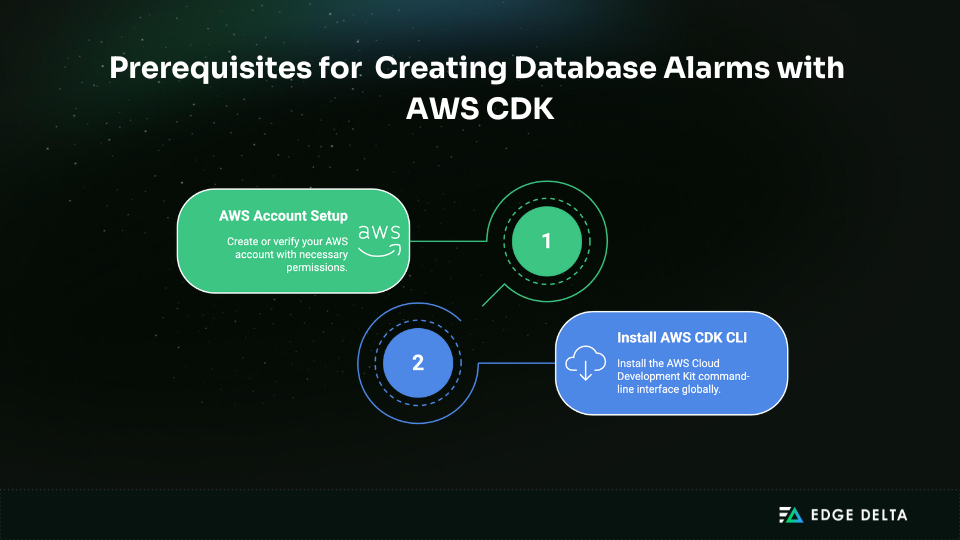
First, you’ll need an AWS account with the right permissions: RDS, CloudWatch, and IAM. If you’re managing infrastructure with least-privilege policies, ensure those services are greenlit.
Next: install the AWS CDK CLI globally. If you haven’t already:
npm install -g aws-cdkThis guide uses TypeScript, but you can adapt the code for Python if that’s your flavor. Just make sure you’re comfortable with CDK concepts like Stack, Construct, and Props.
If you want to apply telemetry pipelines, anomaly detection, or OnCall AI to your new alarms, create an Edge Delta account and have the Edge Delta agent installed in your environment.
Creating an RDS Database with AWS CDK
Time to get your database up and running. We’ll use AWS CDK to spin up a PostgreSQL RDS instance inside an existing VPC. Why CDK? Because infrastructure-as-code means no more manual clicks, no mismatched configs, and no “it works on dev but not on prod” surprises.
Here’s a clean TypeScript example to drop into your CDK stack:
import * as cdk from 'aws-cdk-lib';
import { Construct } from 'constructs';
import { DatabaseInstance, DatabaseInstanceEngine, PostgresEngineVersion } from 'aws-cdk-lib/aws-rds';
import { InstanceType, InstanceClass, InstanceSize, Vpc } from 'aws-cdk-lib/aws-ec2';

export class DatabaseStack extends cdk.Stack {
  constructor(scope: Construct, id: string, props?: cdk.StackProps) {
    super(scope, id, props);

    const vpc = Vpc.fromLookup(this, 'MyExistingVpc', {
      vpcName: 'my-existing-vpc',
    });

    const dbInstance = new DatabaseInstance(this, 'MyPostgresInstance', {
      engine: DatabaseInstanceEngine.postgres({
        version: PostgresEngineVersion.VER_13_4,
      }),
      vpc,
      instanceType: InstanceType.of(InstanceClass.T3, InstanceSize.MICRO),
      allocatedStorage: 20,
      maxAllocatedStorage: 100,
      multiAz: false,
      deletionProtection: false,
      databaseName: 'mydb',
    });
  }
}
What’s happening here?
- We pull an existing VPC for seamless integration.
- We use t3.micro for demo purposes, but you can size up in production.
- multiAz is off here to save cost; flip it on when uptime matters.
This gives you a working PostgreSQL instance with minimal setup. But right now, it’s blind. No alarms. No protection. That’s what we’ll fix next.
Adding Database Alarms with AWS CDK
With AWS CDK, you can define CloudWatch alarms as code, right next to your database definition. This gives you full control, consistency across environments, and zero guesswork. For instance, you might want to monitor:
- Free Storage Space – avoid running out of disk space
- CPU Utilization – catch spikes or unusual loads
- Freeable Memory – watch for memory constraints
- Database Connections – ensure you don’t exceed connection limits
Here’s how you can define an alarm for free storage space:
import { Alarm, ComparisonOperator } from 'aws-cdk-lib/aws-cloudwatch';

const freeStorageMetric = dbInstance.metricFreeStorageSpace();

new Alarm(this, 'FreeStorageAlarm', {
  metric: freeStorageMetric,
  threshold: 2 * 1024 * 1024 * 1024, // 2GB in bytes
  evaluationPeriods: 1,
  comparisonOperator: ComparisonOperator.LESS_THAN_THRESHOLD,
  alarmDescription: 'Alarm if free storage is less than 2GB',
});
You can also create additional alarms in a similar fashion, specifying thresholds and evaluation periods. Want to catch CPU overloads? Here’s how:
const cpuMetric = dbInstance.metricCPUUtilization();

new Alarm(this, 'CpuHighAlarm', {
  metric: cpuMetric,
  threshold: 80,
  evaluationPeriods: 2,
  comparisonOperator: ComparisonOperator.GREATER_THAN_THRESHOLD,
  alarmDescription: 'Alarm if CPU usage exceeds 80% for 10 minutes',
});
The key is matching each alarm to a real risk, to monitor the most critical metrics that serve as a proxy for database health.
Best Practices for Cost Optimization and Reliability
Having alarms is good. Having smart, cost-effective, low-noise alarms? That keeps your ops team sane and your AWS bill in check. Let’s sharpen your setup with a few hard-earned best practices:
1. Use Granular Metrics and Filtered Logs
AWS charges based on the volume of ingested logs and custom metrics. As of 2024, the cost of custom metrics in CloudWatch starts at $0.30 per metric per month, and log ingestion runs around $0.50 per GB (AWS Pricing).
If you’re pushing raw, high-volume RDS logs into CloudWatch without filtering, you’re probably paying for data you don’t even look at. This includes connection events, query executions, or debug noise.
What to do:
- Use Edge Delta pipelines to discard low-signal logs at the edge.
- Only forward high-priority events: query failures, replication lag, slow queries, and IOPS errors.
- Aggregate similar logs into metrics (e.g., “slow queries per minute”) instead of tracking each one.
Filtering early reduces cost downstream, making your dashboards easier to read.
2. Make CDK Your Source of Truth
Hardcoding alarms in the AWS console may feel quick but fragile. There’s no audit trail, and recreating the config across environments is tedious and error-prone.
Why CDK matters:
- All alarm logic lives in code: easily versioned, reviewed, and rolled back.
- You can reuse constructs across multiple stacks (dev, test, prod).
- It scales: one update to your CDK alarm construct updates every environment.
According to the AWS Well-Architected Framework, codifying your infrastructure (including monitoring) is critical for maintaining operational excellence.
Pro Tip
Use constructs or helper functions to standardize alarm thresholds across microservices.
3. Audit Alarm Noise Monthly
Over time, alarms can pile up, and not all stay relevant. A database alarm that fired 20 times in the past month, but never led to an incident? That’s an alert noise.
How to audit effectively:
- Review CloudWatch metrics like AlarmHistory or integrate with Edge Delta to see which alarms triggered and why.
- Check which alarms were acknowledged or ignored in PagerDuty or Slack.
- Look for false positives or overlapping alerts firing at the same time.
Then ask: did this help anyone respond faster? Was it actionable? Could it have been consolidated?
A study by Moogsoft found that up to 83% of IT alerts are either redundant or irrelevant. Prune aggressively.
4. Align Monitoring with Business Impact
Not every performance issue deserves a pager. If your alarm doesn’t tie to customer experience, system stability, or critical SLAs, it might be better as a dashboard widget than an active alert.
Prioritize alarms that:
- Indicate potential data loss (e.g., replication lag, storage pressure)
- Affect performance or availability (e.g., DB connections maxing out)
- Signal cost-impacting behavior (e.g., unoptimized queries causing CPU drain)
Adopting a risk-based monitoring model improves MTTR by 25%, according to findings from Datadog’s State of Observability report (2023).
Conclusion
Modern monitoring demands more than just setting alarms and hoping for the best. In dynamic cloud environments, your database can be the first thing to choke under pressure, and the last thing to send a clear signal if your observability isn’t dialed in.
By using AWS CDK, you eliminate manual drift and create consistent, codified alarm strategies across every environment. And by integrating Edge Delta, you go beyond basic metrics of filtering noise, detecting anomalies, and surfacing real issues before they impact your users.
This isn’t just smarter infrastructure. It’s a shift from reactive monitoring to proactive resilience, and it’s built to scale with you.
If you care about uptime, it’s time to rethink how you monitor your databases. Start by turning your alarms into a strategy.
FAQs
How to lower CloudWatch costs?
Reduce log volume by filtering at the source with tools like Edge Delta. Aggregate metrics instead of tracking every detail, and only use metric filters when needed. Archive logs to S3 to avoid pricey CloudWatch retention. For easier scaling, forward them using Edge Delta’s lightweight Lambda extension.
Why use CDK instead of CloudFormation?
AWS CDK provides a high-level, code-first way to define infrastructure using languages like TypeScript or Python. Unlike YAML-based CloudFormation, CDK enables abstraction, reuse, and logic, making infrastructure easier to manage and scale.
What are the datapoints to alarm?
“Datapoints to alarm” defines how many evaluation periods must breach the threshold to trigger an alarm. Example: If you’re evaluating over 5 periods and need 3 to breach, that’s 3 datapoints to alarm out of 5.

