AWS Lambda is one of the most popular cloud services on the market, used by millions of monthly active customers who generate more than 10 trillion invocations each month. Lambda’s serverless and event-driven architecture allows it to scale quickly and efficiently as usage grows, and users can easily spin up new functions by clicking a few buttons and pasting code into the Lambda UI.
By default, all Lambda log data is sent to Amazon CloudWatch for monitoring and analysis, including Lambda event logs, control logs, and custom logs generated by the executed code. This is a good starting place for monitoring Lambda functions, but the resulting CloudWatch costs can quickly spiral out of control.
By deploying Edge Delta’s lightweight Lambda Extension into your Lambda environment, you can easily forward Lambda logs — as well as their associated tags — into an Edge Delta Telemetry Pipeline. Once the data is ingested, you can optimize and enrich it pre-index — and route it to more cost-effective monitoring platforms like Edge Delta.
In this post, we’ll show you how to set up an Edge Delta Cloud Fleet, deploy the Edge Delta Lambda Extension, and configure it to forward logs into your pipeline.
Step 1: Create an Edge Delta Cloud Fleet
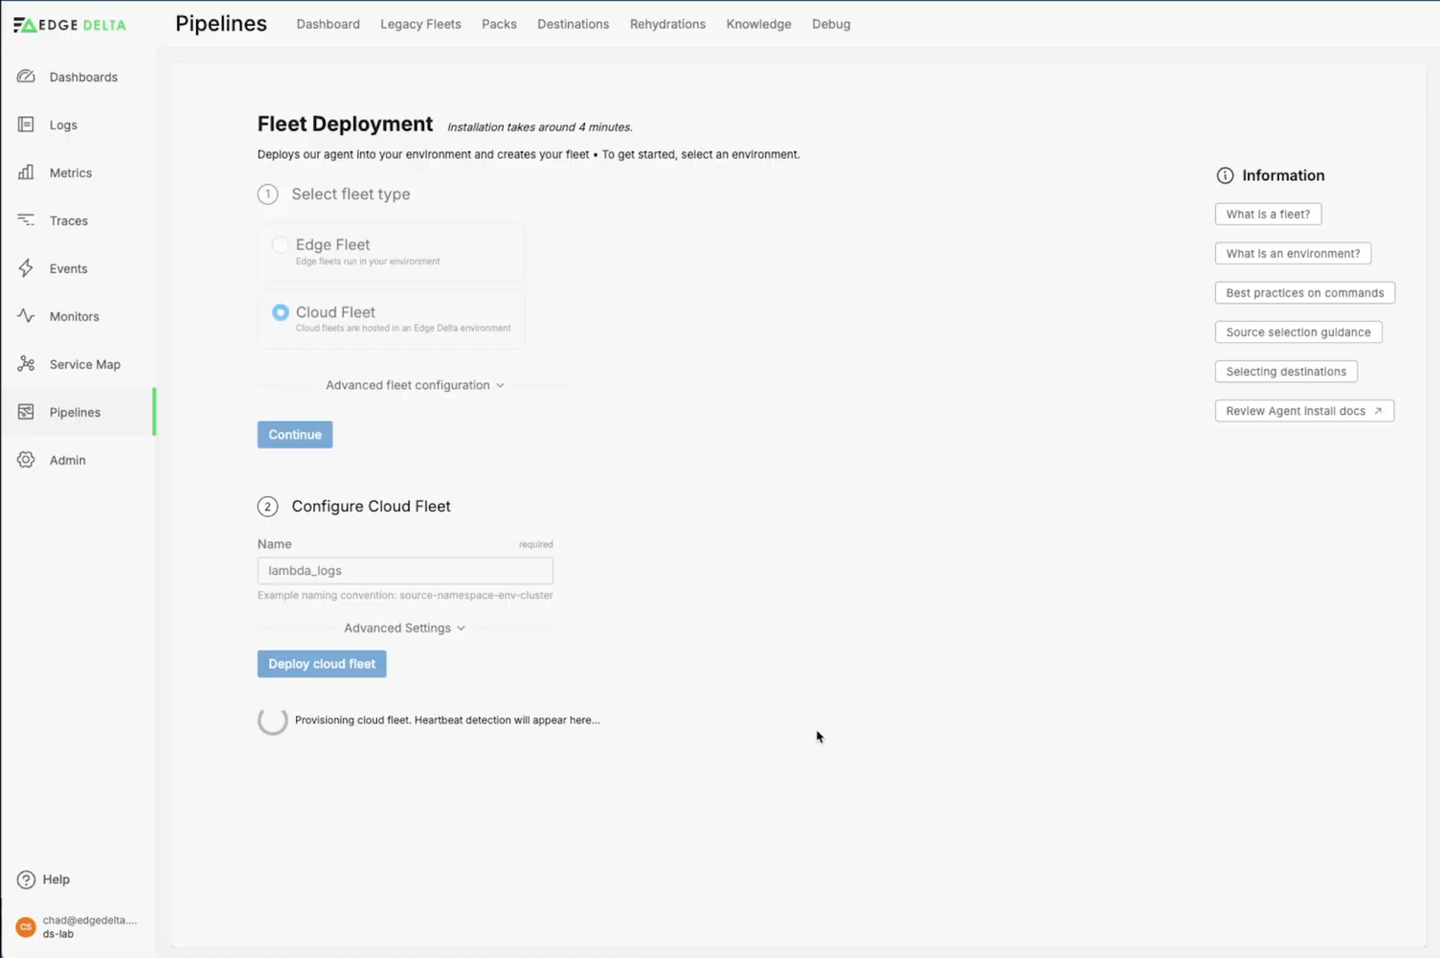
An Edge Delta Cloud Fleet is a fully cloud-hosted Edge Delta Fleet that requires no user maintenance or infrastructure configuration. It exposes HTTP/HTTPS/gRPC endpoints, which you can use to forward logs to it. To create a Cloud Fleet:
- Log into Edge Delta
- Click Pipelines, followed by New Fleet.
- Select Cloud Fleet and then click Continue.
- Give your fleet a name, and then click Deploy Cloud Fleet.
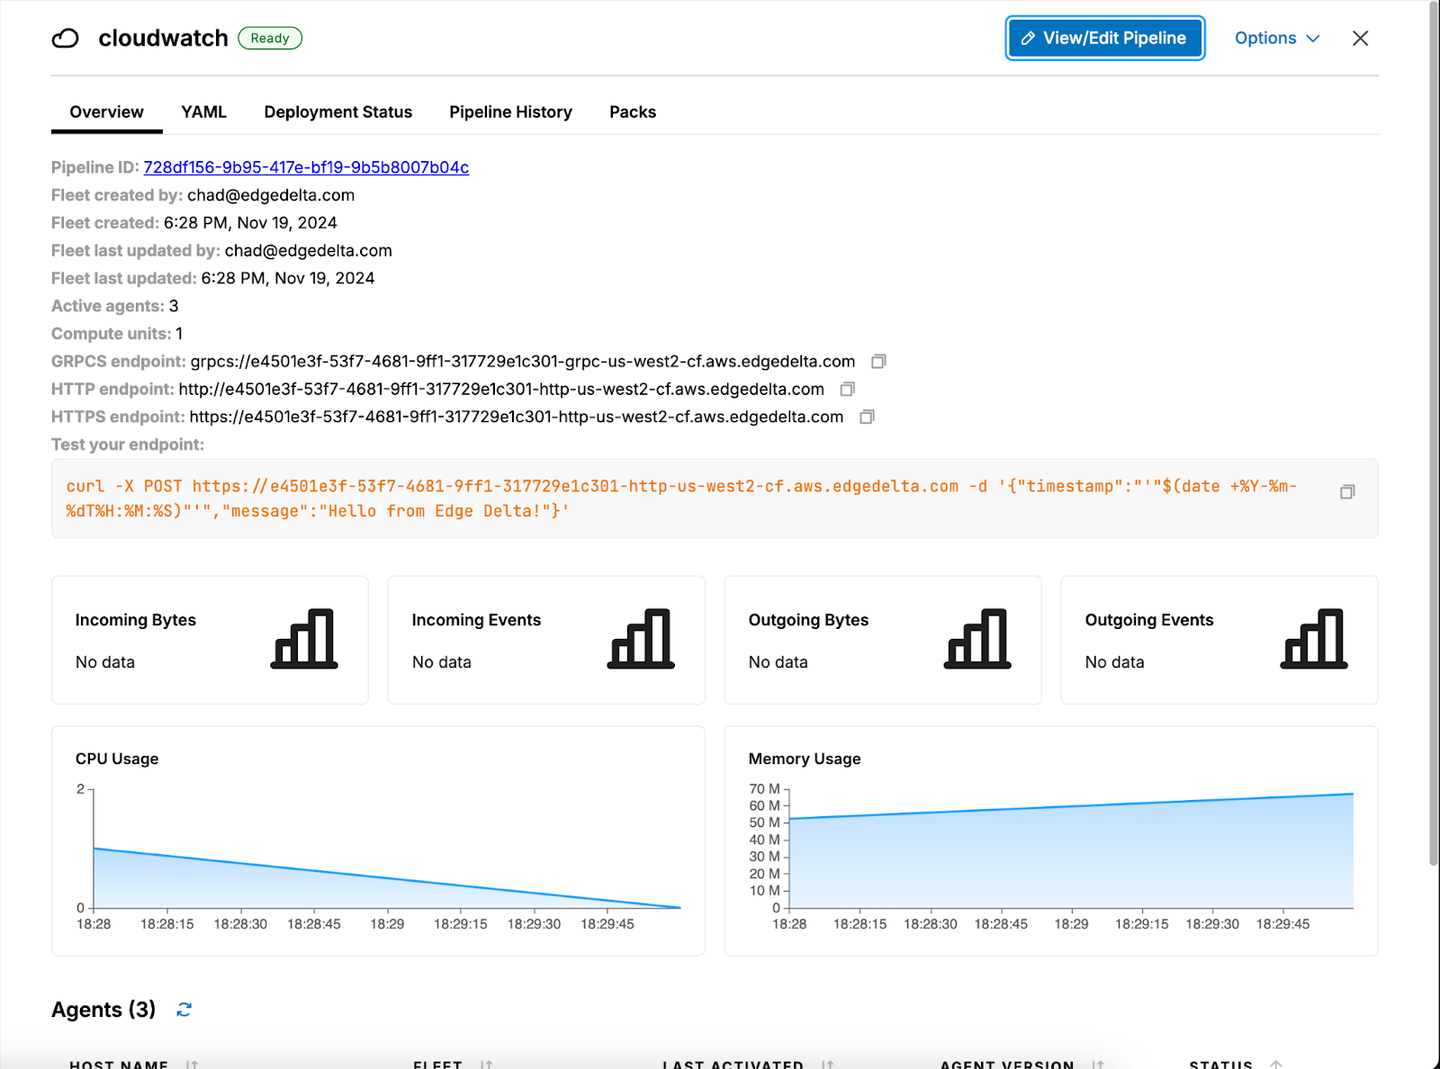
Once the Fleet is created, you can click View Dashboard and see its HTTPS endpoint, which you’ll need to share with your Lambda Extension.
Step 2: Configure Your Pipeline
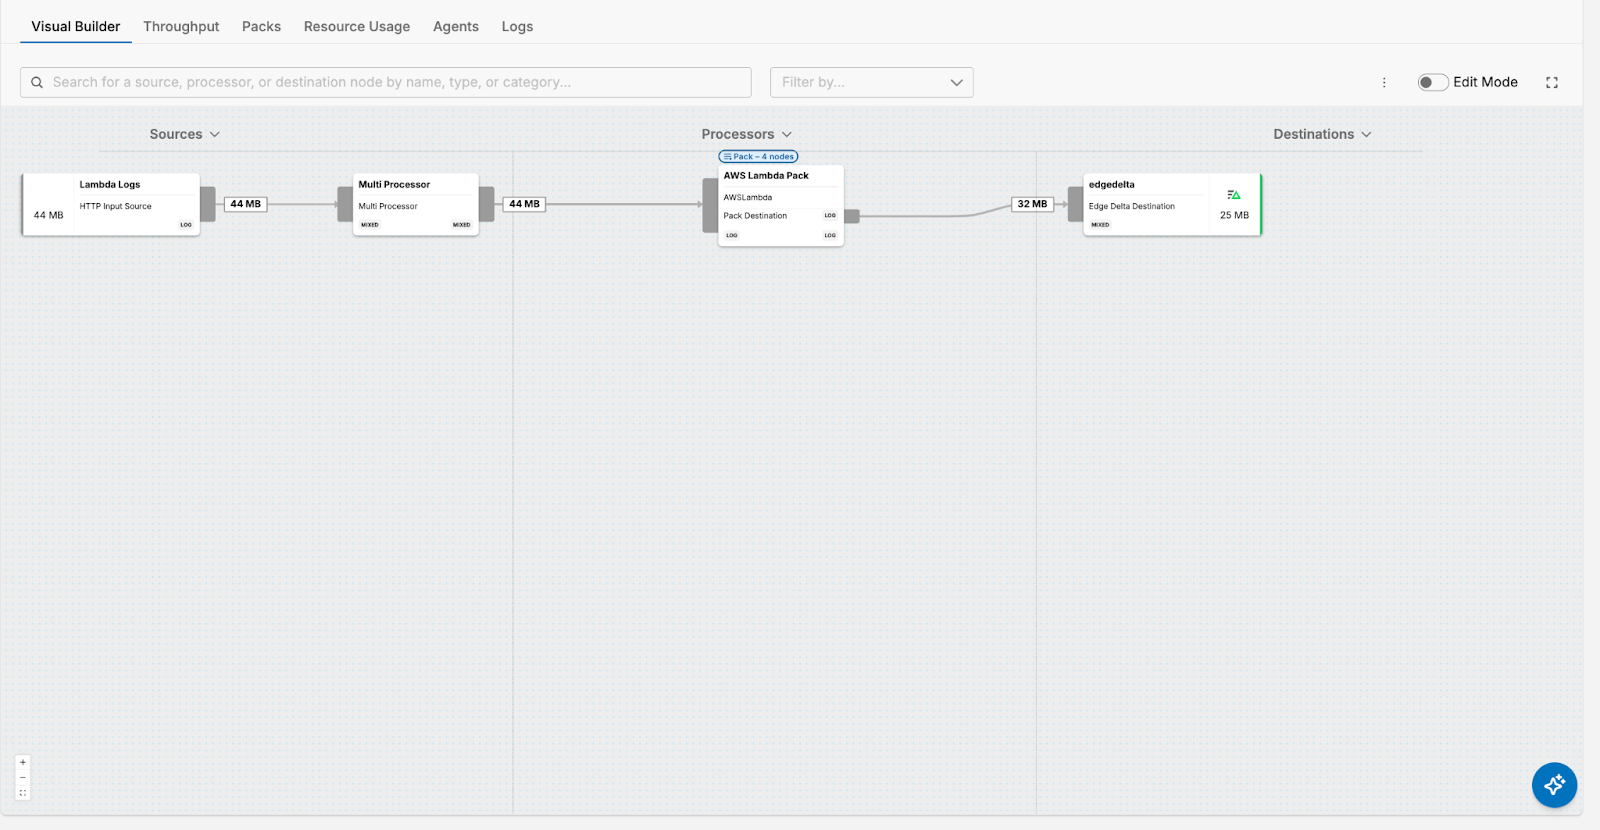
Your new Edge Delta Pipeline is listening for logs on HTTPS (which is how we’re going to be transporting the Lambda logs) and gRPC, and is currently configured to route them directly into Edge Delta’s backend. But before you begin ingesting logs, you should first configure your pipeline to structure and enrich them. Edge Delta’s AWS Lambda Pack automatically unrolls and optimizes Lambda log data, and it can be easily added to any running pipeline by following these steps:
- Log into the Edge Delta Console.
- Click Pipelines, then click into Knowledge, and select the Packs tab.
- Locate the AWS Lambda Pack and click Add to pipeline.
- Choose the newly created pipeline and click Save Changes.
- Delete the link from http_input to ed_archive and connect http_input to the AWS Lambda Pack.
- Route the AWS Lambda Pack output to ed_archive.

Step 3: Create a Test AWS Lambda
Now that your pipeline is configured, follow these steps to create a simple test Lambda function that will generate logs:
- Log into the AWS Console and navigate to the AWS Lambda functions view.
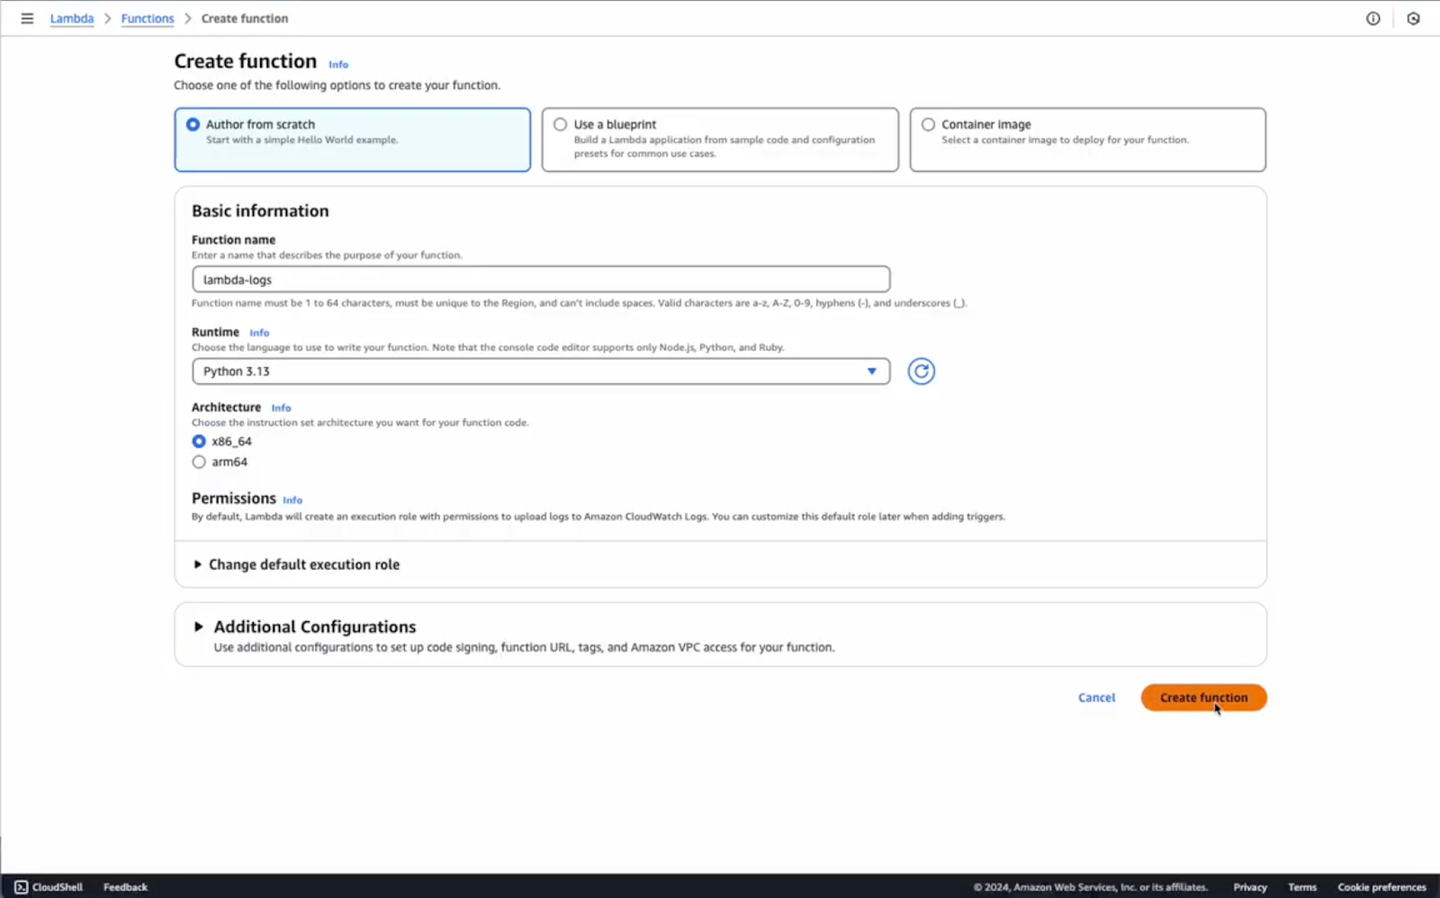
- Click Create function, select Author from scratch, and populate Function name.
- Select the Python 3.xx Runtime and the x86_64 Architecture.
- Click Create function.
For this example, we’ll run a simple Python script. To add it, select the Code tab and paste the example code below:
import time
import string
import random
import json
def lambda_handler(event, context):
   letters = string.ascii_letters
   x = "".join(random.sample(letters,10))
   print ('lambda-logs-'+x)
   n = 10
   for i in range(0, n):
       ticks = str(time.time_ns())
       print ('lambda-logs-'+x+'-'+ticks)
   return {
       'statusCode': 200,
       'body': json.dumps('lambda-logs-'+x+'-'+ticks+'-response')
   }
Note: this is a simple test Lambda function used for demonstration purposes. Any AWS resource that writes to CloudWatch can be used to demonstrate and validate the functionality.
Step 4: Add the Edge Delta Lambda Extension
Once the test function is created, you’ll need to grab the Edge Delta Lambda Extension from the AWS serverless applications list. Once the extension is added to an AWS account, it can be reused in any Lambda function within it. To add the Edge Delta Lambda Extension:
- Log into the AWS Console and navigate to the AWS Lambda Applications page.
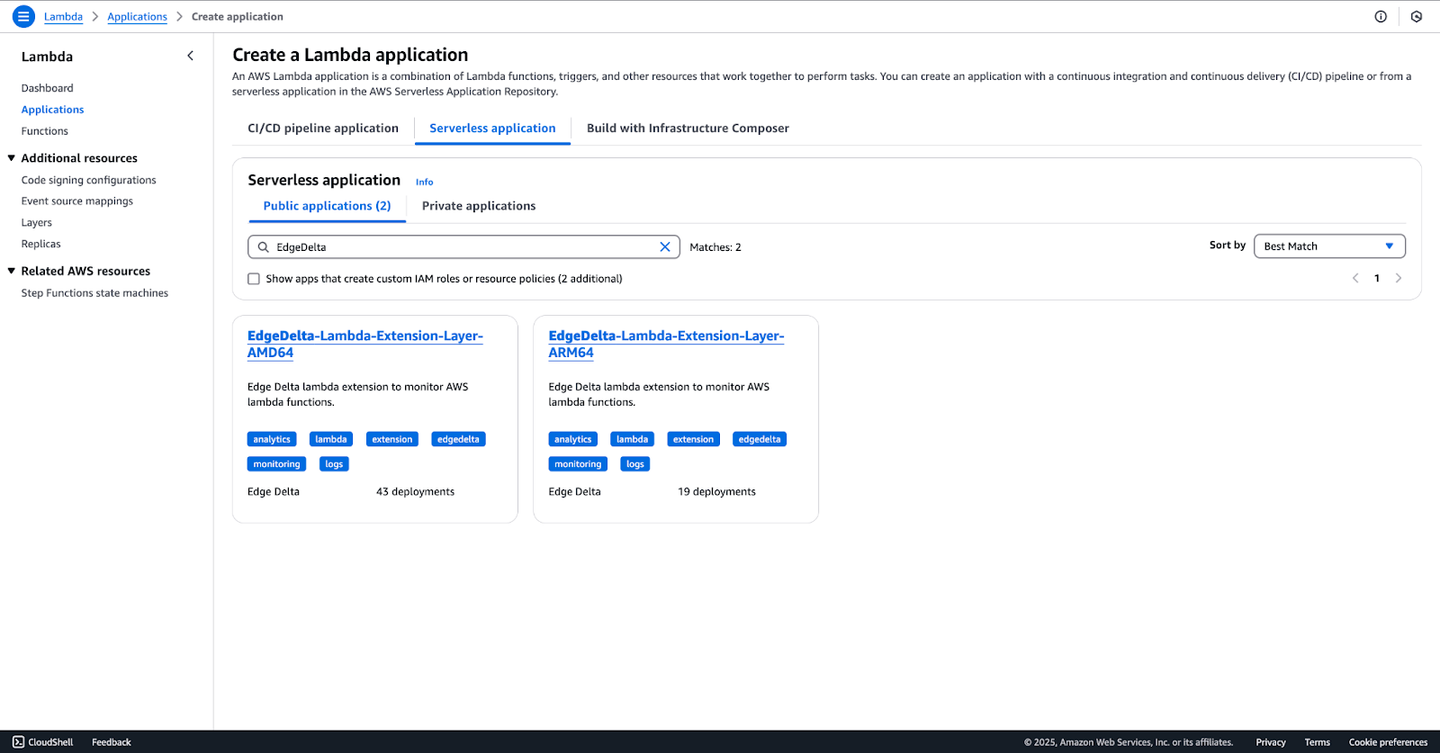
- Click Applications, then click Create application, and choose Serverless application.
- Under Public applications enter Edge Delta, and click “EdgeDelta-Lambda-Extension-Layer-AMD64” (Update the name if needed under Application settings).
- Take note of the ARN under the Physical ID column, and navigate to the AWS Lambda Functions page.
- Click Functions, then select the example function.
- Click Layers, then click Add a layer, and then click Specify an ARN.
- Paste in ARN from the previous step, then click Verify.
- Finally, click Add to officially add the extension.

Step 5: Add Environment Variables to Edge Delta Lambda Extension
To add the appropriate environment variables, follow these steps:
- Navigate back to the AWS Lambda Functions page and click Functions.
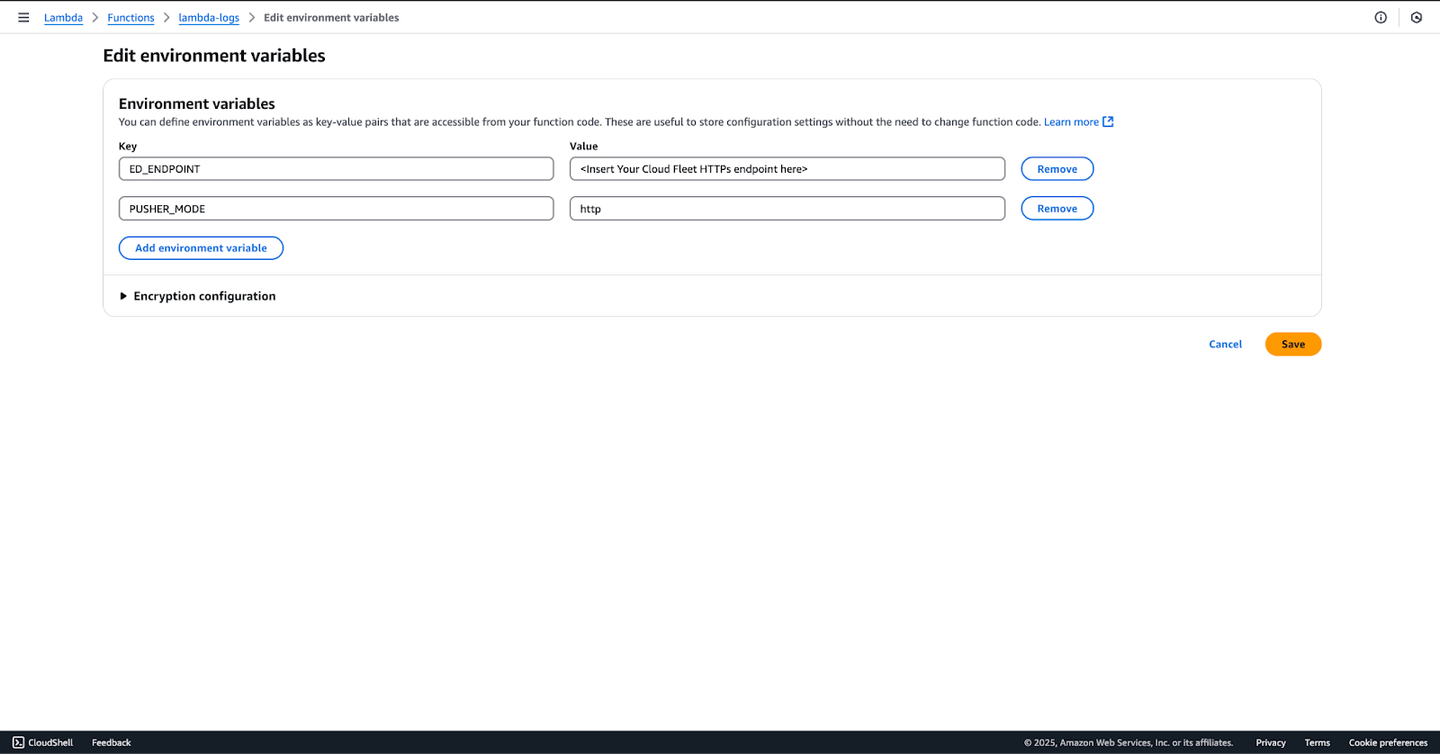
- Select the example function, click Configuration, and click Environment Variables.
- Create the required variables — add a PUSHER_MODE and ED_ENDPOINT variable, and assign to them “http” and <Your Edge Delta Cloud Fleet HTTPS Endpoint> respectively. If you need to add optional variables, further information can be found in our docs.
Step 6: Generate Logs
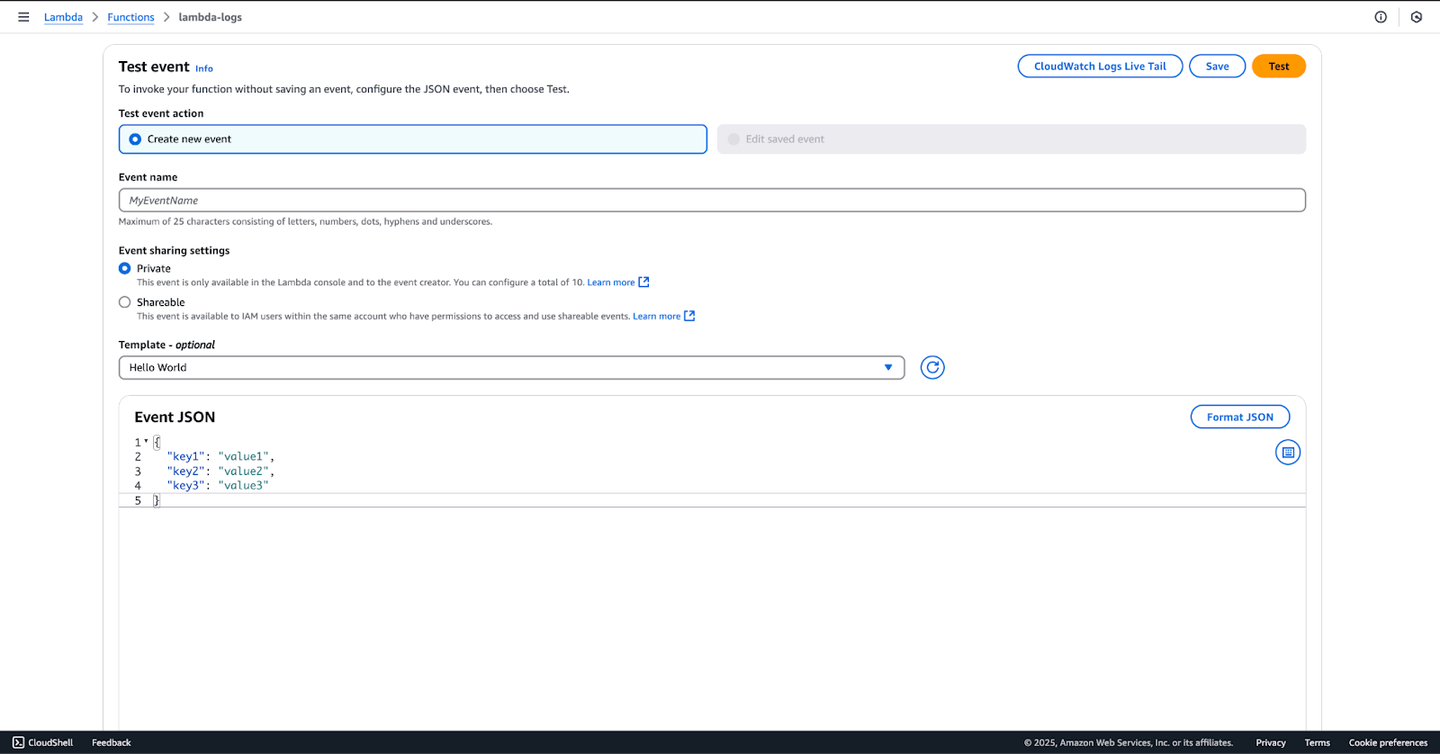
AWS CloudWatch Log Groups are created the first time logs are generated, but in order to generate logs, the function must execute. AWS Lambdas only run when triggered, but they do have a manual trigger option. To manually trigger the Lambda, navigate to the example function we created and click on the Test tab. Then, wait until you see the following message: “Executing function: succeeded.”
Step 7: View Lambda Logs in Edge Delta
Once the test function is running and the Edge Delta Lambda Extension is deployed, logs should be flowing into Edge Delta’s backend.
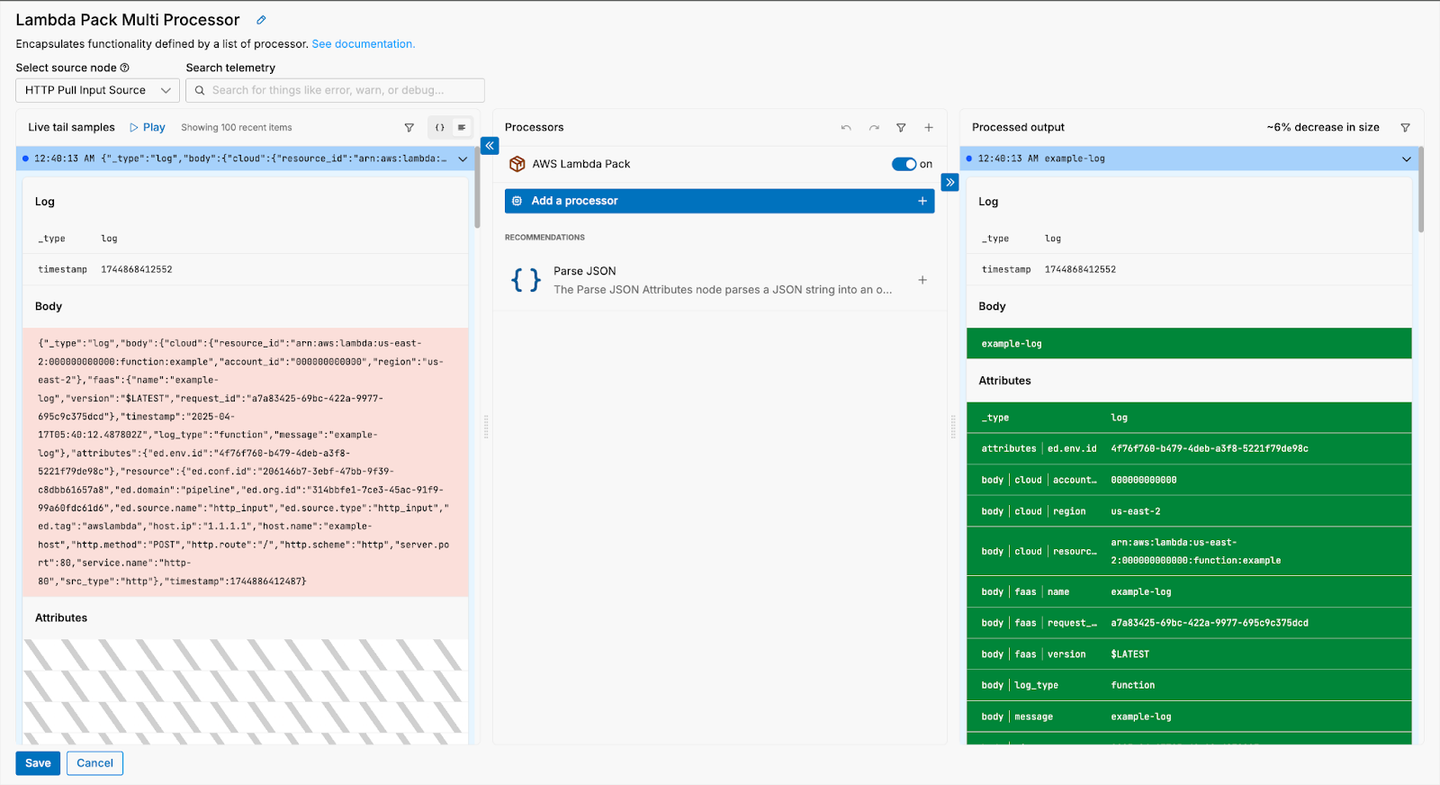
Once the Lambda logs are flowing, you can use Edge Delta’s Live Capture feature to visualize the data as it’s moving through the pipeline in real time:
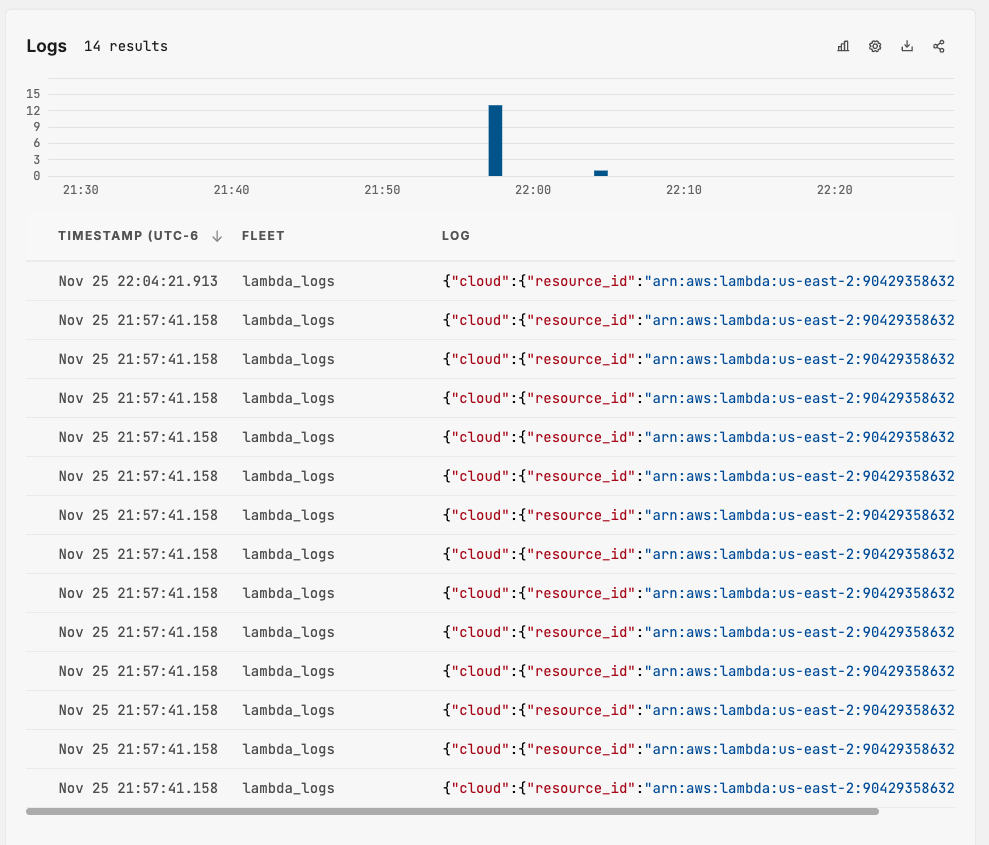
You can confirm the logs are entering Edge Delta’s backend by clicking on the Logs tab on the left-hand side of the screen in your Edge Delta account. If you see logs, that means the setup process was successful:
Once there, you can filter through logs by attribute, or create custom dashboards and monitors to help visualize and maintain the health of your Lambda environment.
Get started with the Edge Delta Lambda Extension
Amazon CloudWatch is a straightforward solution for monitoring your Lambda functions, but logging to CloudWatch is very expensive — particularly at scale. Our lightweight Lambda Extension lets you save on downstream ingestion costs by sending Lambda logs into an Edge Delta Telemetry Pipeline and optimizing your data in-flight. From there, you can send your logs to more cost-effective monitoring destinations like Edge Delta.
If you want to learn more about how our end-to-end Telemetry Pipelines can help you manage your CloudWatch costs, check out our free playground or start a free trial.