


Debugging a production issue without a proper NGINX logging configuration can feel like flying blind. You know something’s wrong; users are seeing errors, and response times are slow, but the logs you’re relying on are incomplete, cluttered, or missing entirely. That’s a situation no team wants to face.
Web server logs are vital for diagnosing errors, tracing requests, and monitoring system health. Yet many teams rely on default or incomplete setups, creating blind spots that slow down incident response. With NGINX powering 33% of websites, poor logging is a serious risk. Properly configured logs can cut troubleshooting time, helping teams resolve issues faster.
NGINX offers two main types of logs: access logs and error logs. Each serves a different purpose and is highly customizable. You can define what data gets captured, how it’s structured, and where it’s stored, whether you’re debugging latency issues or analyzing traffic spikes.
If you’re responsible for keeping systems running smoothly, getting NGINX logging right isn’t optional; it’s essential. This guide explains how to use NGINX logs effectively. You’ll learn about log types, setup, optimization, and best practices for visibility and performance. Let’s dive in and build a setup that works when you need it most.
Key Takeaways
• NGINX logs are essential for diagnosing issues, monitoring performance, and improving visibility across web server environments.
• Access and error logs serve distinct roles, with customizable formats that support detailed traffic analysis, debugging, and compliance.
• Conditional logging, buffered writes, and log rotation help optimize performance while minimizing unnecessary I/O and log volume.
• Custom formats like JSON and specialized fields such as upstream response time and request ID enable better integration with modern observability tools.
• A well-structured NGINX logging strategy reduces mean time to resolution, strengthens security monitoring, and supports scalable operations in production systems.
Understanding NGINX Logging Fundamentals
Effective log management in NGINX begins with understanding what it logs by default, how those logs are structured, and where they’re stored. Out of the box, NGINX generates two primary log types: access logs, which track client requests, and error logs, which record server-side issues. These logs operate at configurable verbosity levels and support various formatting options for different use cases.
NGINX’s logging system revolves around a few key components:
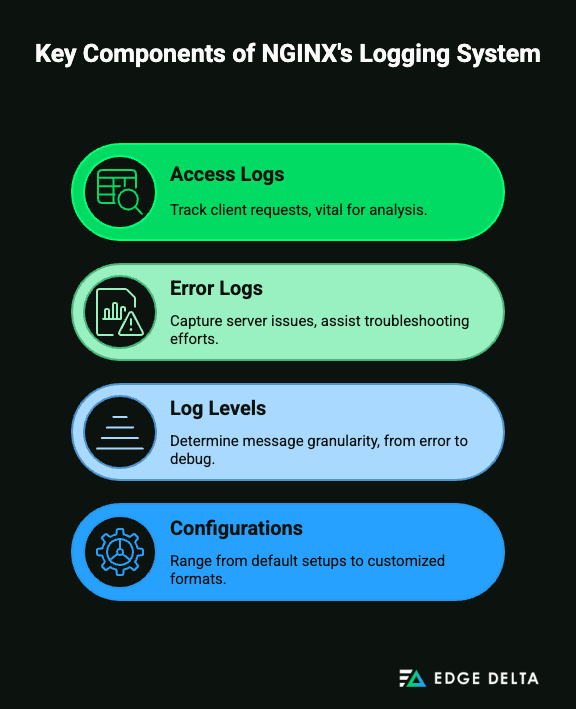
- Access logs track every client request and are vital for traffic analysis and performance monitoring.
- Error logs capture internal server issues and help with troubleshooting.
- Log levels determine the granularity of logged messages, from error to debug.
- Configurations can range from default setups to fully customized formats and pipelines.
Understanding how these components interact provides a solid foundation for managing and extending your logging strategy.
Default Logging Behavior in NGINX
NGINX automatically creates both access and error logs. These logs provide a continuous view of server activity and issues without requiring manual setup.
By default:
- Access logs are written to /
var/log/nginx/access.log - Error logs are written to
/var/log/nginx/error.log
These files are created during installation on most Linux distributions and are automatically populated unless explicitly disabled in the configuration.
Access Logs vs. Error Logs
Access logs contain information about every incoming request to the NGINX server. This includes:
- Client IP address
- Timestamp
- HTTP method and URI
- Response status code
- Bytes sent
- Referrer and user-agent
Error logs, on the other hand, focus on server-side issues. They provide diagnostic messages that help identify:
- File permission problems
- Configuration syntax errors
- Unavailable upstream servers
- SSL/TLS handshake failures
Access logs support performance monitoring and analytics, while error logs are your first stop when diagnosing issues or failed deployments.
Log File Locations and Conventions
The default logging directory for NGINX is /var/log/nginx/, where you’ll find:
access.logerror.log
In custom builds or containerized environments, log paths may vary, often redirected to STDOUT or /var/log/nginx-custom/. Log rotation is usually handled by external utilities like logrotate or cron jobs to avoid uncontrolled file growth.
Understanding Log Formats
NGINX uses named log formats that define how data is written in the access log. Three common formats are:
- combined – Includes request line, status, referrer, and user agent (most comprehensive)
- common – Omits referrer and user agent fields
- main – Default on many Linux systems, customizable via log_format
Example configuration:
log_format combined '$remote_addr - $remote_user [$time_local] "$request" '
                    '$status $body_bytes_sent "$http_referer" "$http_user_agent"';
access_log /var/log/nginx/access.log combined;
You can define custom formats (e.g., JSON or line-delimited key-values) to match ingestion pipelines for tools like Fluent Bit, Datadog, or Elasticsearch.
Log Levels and Verbosity Explained
NGINX supports eight log levels, from the least to most verbose:
emerg– System is unusablealert– Immediate action requiredcrit– Critical conditionserror– General error conditionswarn– Warnings about potential issuesnotice– Normal but significant eventsinfo– Informational messagesdebug– Detailed debugging information
Example:
error_log /var/log/nginx/error.log warn;In production, error or warn are most commonly used to balance visibility and noise. debug should only be enabled during troubleshooting due to its verbosity.
Default vs. Custom Logging Configurations
The default configuration is usually sufficient for basic monitoring. However, you can customize:
- File paths
- Log formats
- Conditional logging (e.g., exclude health checks or static assets)
- Output destinations (e.g., syslog, STDOUT for containers)
Example – Disable logging for health checks:
location /healthz {
access_log off;
return 200 'OK';
}
These tweaks allow you to tailor logging behavior to your infrastructure’s needs while improving clarity and reducing noise in your logs.
NGINX Log Types and Configuration Options
NGINX offers two primary types of logs (access logs and error logs), each serving a distinct purpose in server monitoring and troubleshooting. These logs are highly configurable through built-in directives, allowing administrators to tailor what data is captured, how it’s formatted, and where it’s stored. Whether you’re analyzing traffic trends, debugging server errors, or meeting compliance requirements, understanding how to configure and optimize NGINX logging is essential for maintaining visibility and performance in any environment.
NGINX Access Logs
NGINX access logs record every client request the server handles, providing valuable insight into site usage, user behavior, and potential security threats. These logs are generated after a request is processed and are typically used for performance analysis, traffic monitoring, and anomaly detection.
Purpose and What They Capture
Access logs detail each request’s metadata, including:
- Client IP address (
$remote_addr) - Requested resource (URI and method via
$request) - HTTP status code (
$status) - User-agent (
$http_user_agent) - Referrer (
$http_referer) - Bytes sent (
$body_bytes_sent) - Optional request/response timings (
$request_time,$upstream_response_time)
This data helps administrators identify traffic patterns, high-traffic endpoints, and suspicious behavior, like repeated access to vulnerable paths (e.g., /admin, /wp-login.php).
Default Format and Common Variables
By default, NGINX uses the combined log format:
log_format combined '$remote_addr - $remote_user [$time_local] "$request" '
'$status $body_bytes_sent "$http_referer" "$http_user_agent"';
access_log /var/log/nginx/access.log combined;
This format captures the essential fields needed for most traffic analysis and troubleshooting tasks.
Custom Log Format Creation
Custom log formats can be defined with the log_format directive and applied via access_log. For example, to log compression performance:
log_format compression ‘$remote_addr – $remote_user [$time_local] ‘ ‘”$request” $status $body_bytes_sent ‘ ‘”$http_referer” “$http_user_agent” “$gzip_ratio”‘;
access_log /var/log/nginx/access.log compression;
To diagnose latency, log upstream timing values:
log_format upstream_time '$remote_addr - $remote_user [$time_local] ' '"$request" $status $body_bytes_sent ' '"$http_referer" "$http_user_agent" ' 'rt="$request_time" uct="$upstream_connect_time" ' 'uht="$upstream_header_time" urt="$upstream_response_time"'; access_log /var/log/nginx/access.log upstream_time;
Multiple Access Log Configurations
NGINX supports multiple access_log directives in different contexts (e.g., per server block, location block). This allows you to:
- Log admin panel or API traffic separately
- Apply unique formats per endpoint
- Disable access logs for low-priority routes like health checks:
location /healthz {
    access_log off;
    return 200 'OK';}
By customizing log formats and destinations, you can align NGINX’s logging with your operational and security monitoring workflows.
NGINX Error Logs
While access logs focus on requests, error logs capture server-side issues, such as configuration problems, failed upstream connections, and application-level errors, making them crucial for stability and diagnostics.
Error Classification and Levels
The error_log directive sets both log location and severity level:
error_log /var/log/nginx/error.log warn;NGINX supports the following levels (from highest to lowest severity):
- emerg, alert, crit, error, warn, notice, info, debug
Setting a level logs that level and all more severe ones. For example, warn will also log error, crit, etc.
Debugging Information and Stack Traces
Error logs include a timestamp, message, and contextual info. If debug is enabled (requires NGINX compiled with –with-debug), NGINX logs low-level internal operations. While useful for pinpointing issues, debug logging should only be enabled temporarily in development or troubleshooting sessions due to its performance impact.
Performance Impact of Log Levels
Higher verbosity, especially debug, increases CPU and disk I/O. In production, it’s recommended to use warn or error levels for balanced insight and efficiency.
Error Log Rotation Considerations
Error logs can grow rapidly, especially in misconfigured systems, so regular rotation is critical. Use tools like logrotate to:
- Rotate logs daily or hourly
- Compress and archive old logs
- Define retention policies
Proper rotation ensures logs remain manageable and don’t consume all available disk space.
Custom NGINX Log Formats
NGINX allows administrators to define log formats tailored to specific use cases. This enables better integration with logging pipelines and observability tools.
JSON Logging for Better Parsing
Structured logs, like JSON, are easier to ingest by tools like Datadog, Loki, or Elasticsearch:
log_format json_logs escape=json '{ "time": "$time_iso8601", "remote_addr": "$remote_addr", '
'"request": "$request", "status": "$status", '
'"bytes_sent": "$body_bytes_sent", "referer": "$http_referer", ' '"user_agent": "$http_user_agent" }'; access_log /var/log/nginx/access.log json_logs;
Including Custom Headers and Variables
You can extend log formats to include app-specific headers like X-Request-ID:
"$http_x_request_id"Performance Monitoring Log Formats
For backend performance monitoring, log variables like:
- $request_time
- $upstream_response_time
- $upstream_connect_time
These help trace latency sources in distributed or containerized systems.
Conditional NGINX Logging
NGINX supports conditional logging using map and if directives with access_log. This helps reduce log noise and targets only relevant entries.
Logging Based on Status Codes
To log only 4xx and 5xx responses:
map $status $log_errors {
    ~^[45] 1;
    default 0;
}access_log /var/log/nginx/errors.log combined if=$log_errors;
Excluding Health Checks and Monitoring
Suppress logs for uptime probes:
location /healthz {
    access_log off;
    return 200 'OK';}
Geographic and User-Agent Based Logging
Log mobile traffic only:
map $http_user_agent $log_mobile {
    ~*Mobile 1;
    default 0;
}
access_log /var/log/nginx/mobile.log combined if=$log_mobile;
Rate Limiting Impact on Logs
Log only requests affected by rate limits using $limit_req_status, or log when throttling thresholds are triggered, helping measure load and policy effectiveness.
NGINX Log Format Customization and Variables
NGINX offers powerful logging capabilities that can be tailored to fit a wide range of operational needs. By customizing log formats and using available variables, administrators can gain precise visibility into traffic, performance, and security events.
This flexibility is critical for environments like high-traffic web applications, APIs, or containerized microservices where detailed diagnostics and observability are essential.
Standard NGINX Log Variables
NGINX provides a variety of built-in variables that capture key details about every request and response. These are commonly used in the default combined log format:
log_format combined
 '$remote_addr - $remote_user [$time_local] '
                    '"$request" $status $body_bytes_sent
'                    '"$http_referer" "$http_user_agent"';
Client information:
$remote_addr: IP address of the client$remote_user:Authenticated user (if HTTP auth is used)
Request details:
$request: Full request line (method, URI, protocol)$request_method: HTTP method used (e.g., GET, POST)$request_uri: The URI including arguments
Response data:
$status: HTTP response code (e.g., 200, 404)$body_bytes_sent: Bytes sent to the client excluding headers$request_time: Total time spent processing the request
Server information:
$server_name: Name of the server that processed the request$http_host: Value of the Host header in the request$scheme: Request scheme (http or https)$https: “on” if SSL is used, empty otherwise
These variables provide a foundation for monitoring user activity, debugging issues, and analyzing traffic patterns.
Advanced NGINX Variables
For deeper insights into request handling, security, and infrastructure behavior, NGINX also supports advanced log variables.
SSL/TLS Information
When SSL is enabled, the following can be logged:
$ssl_protocol: TLS protocol version (e.g., TLSv1.3)$ssl_cipher: Cipher suite used in the SSL handshake
Geolocation Data (requires GeoIP module)
$geoip_country_code: Two-letter country code of the client IP
Load Balancing & Upstream Metrics
$upstream_addr: Address of the upstream server that handled the request$upstream_response_time: Time taken by the upstream server to respond
Performance-related Metrics
$request_length:Size of the client request, including headers and body$msec: Request timestamp with millisecond precision$pipe: Shows if request was pipelined (“p”) or not (“.”)
Connection-level Information:
$connection: Unique connection serial number$connection_requests: Number of requests handled in the current connection
These variables are useful for profiling backend behavior, SSL configurations, and client performance bottlenecks.
Custom NGINX Log Formats for Different Use Cases
Administrators can define custom log formats using the log_format directive and apply them via access_log. This allows tailoring logs for different diagnostic or compliance scenarios.
Security Monitoring Format
To detect anomalies or brute force attempts, you might log user-agents, referrers, and response codes:
l
og_format security '$remote_addr - [$time_local] "$request" ' '$status $body_bytes_sent "$http_user_agent" "$http_referer"';
Performance Analysis Format
To evaluate gzip compression and request latency:
log_format perf '$remote_addr - $remote_user [$time_local] '
                '"$request" $status $body_bytes_sent "$gzip_ratio" $request_time';
In this case, $gzip_ratio shows how effectively responses are compressed. Tail the log with tail -f to monitor performance in real time.
API Logging Format
For REST APIs, include request method, URI, and response time:
log_format api '$request_method $request_uri $status $request_time';This format helps track API usage and latency with minimal verbosity.
Microservices Tracing Format
For distributed systems, use headers like $http_x_request_id:
log_format trace '$remote_addr [$time_local] "$request" $status ' 'TraceID="$http_x_request_id" Upstream="$upstream_addr"';This supports end-to-end tracing across services and is useful when integrated with OpenTelemetry or a centralized logging platform. Detailed logs may add 2–5% CPU load. Use buffer=32k and keep formats lean.
Reload NGINX after modifying logging formats, and monitor your logs using tail, grep, or streaming tools.
NGINX Logging Performance Optimization
Efficient logging is essential for observability, but if misconfigured, it can degrade server performance. NGINX offers various options to optimize how logs are written, stored, and processed, especially for high-traffic environments.
The following techniques help reduce CPU overhead, minimize disk I/O, and maintain system responsiveness.
NGINX Log File Management
Proper log file management helps minimize I/O bottlenecks and ensures efficient storage. One key optimization is asynchronous logging using buffered writes. Instead of writing every request to disk immediately, NGINX can batch log entries in memory using the buffer parameter, such as:
access_log /var/log/nginx/access.log main buffer=32k flush=5s;This setup reduces disk operations by writing logs every 5 seconds or when the buffer reaches 32 KB.
To further optimize, enable open_log_file_cache, which reduces file descriptor reopens and improves performance:
open_log_file_cache max=1000 inactive=20s valid=1m;Log rotation is also crucial, especially for sites generating over 1GB of logs daily. Use logrotate with daily rotation and compression to keep disk space usage under control .
NGINX Log Filtering and Sampling
High-volume traffic often leads to excessive log generation. Filtering and sampling can help reduce this overhead. NGINX supports conditional logging based on variables like response codes, IP address, or request methods. For example:
map $status $loggable {
    ~^[23]  0;
    default 1;
}
access_log /var/log/nginx/access.log main if=$loggable;
This skips logging for successful (2xx/3xx) responses.
You can also exclude known health checks or bot traffic using IP-based conditions or user-agent filters. Additionally, for large-scale systems, sampling can be achieved via $request_id hash-based maps to only log a subset of requests.
NGINX Log Storage and Processing
Storing logs locally is faster but may become a bottleneck if the disk fills up or I/O is high. Many teams prefer real-time log shipping to remote platforms like ELK or Loki using tools like Fluent Bit, Vector, or rsyslog.
Use compression during archival (logrotate with compress) to save disk space. For long-term retention, consider shipping logs to cloud storage or SIEM platforms with integrated search and alerting features.
CloudPanel integrates log compression and dashboard viewing, allowing easier access to real-time and historical logs without shell access.
NGINX Logging Performance Monitoring
Logging can introduce some performance overhead, especially in high-traffic environments or with verbose configurations. Monitoring its impact helps ensure NGINX remains responsive and efficient.
Key metrics to track include:
- Disk I/O usage: Logging too frequently can throttle writes.
- Log buffer sizes: Use buffer=32k to 64k for high-traffic sites.
- Free disk space: Ensure log rotation prevents full partitions.
- Error log levels: Use
error_log… notice; or warn instead of debug unless troubleshooting, to reduce verbosity .
CloudPanel provides built-in dashboards that show CPU usage, disk usage, and log statistics—useful for spotting performance issues early.
NGINX Logging Security and Monitoring Best Practices
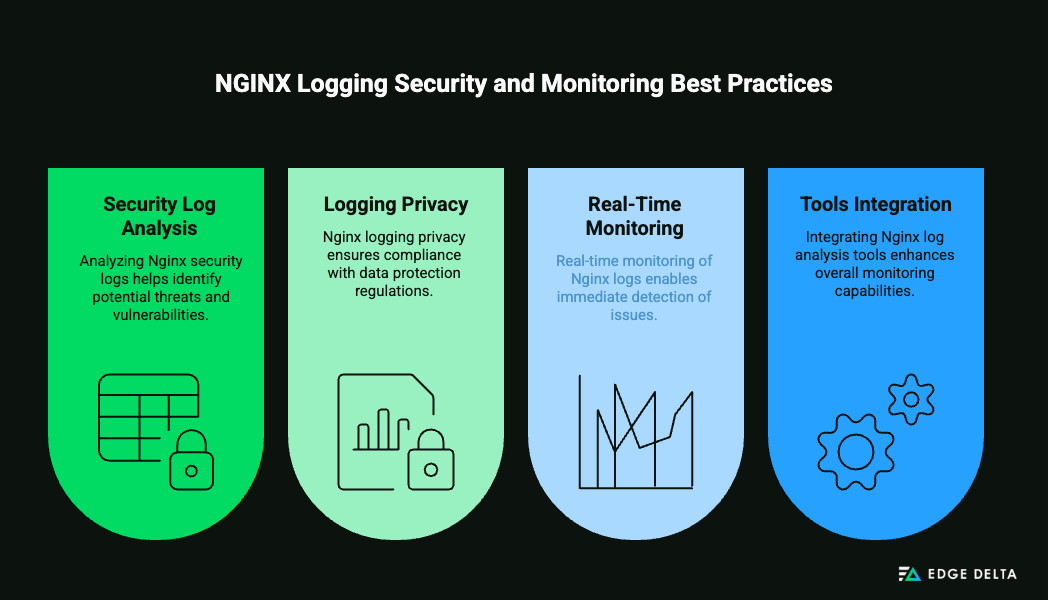
To maintain a secure and high-performing web infrastructure, it’s essential to go beyond basic logging. NGINX logs can be used not just for troubleshooting but also for detecting threats, ensuring data privacy, and monitoring system health in real time.
Here are key practices to improve NGINX log security, ensure compliance, monitor in real time, and integrate with analysis tools.
NGINX Security Log Analysis
NGINX logs are critical for identifying and mitigating security threats. Analyzing access and error logs can reveal common attack patterns, such as:
- DDoS attempts: Indicated by spikes in requests from single IPs or abnormal traffic patterns.
- Brute force attacks: Marked by repeated login attempts or failed authentication logs.
- SQL injection and XSS: Detected through suspicious query parameters or malformed requests.
Use custom log formats to capture user agents, referrers, and headers like X-Forwarded-For to trace attackers using proxies. Anomalous referrers or outdated user agents may signal bot or scraping activity.
Enable rate limiting and log its behavior via directives like limit_req to spot abuse. Combine this with GeoIP modules or third-party scripts to log geographic anomalies, such as sudden traffic surges from unusual countries.
Regular review of error.log entries such as repeated 403, 404, or 502 status codes helps uncover access violations, blocked resources, or upstream server failures.
A Security Engineer Teammate can continuously monitor these patterns at scale, flagging anomalous access behavior and correlating it with other security signals in real time.
NGINX Logging Privacy and Compliance
Logging must also align with data protection regulations like GDPR and PCI DSS:
- GDPR: IP addresses are considered personal data. Anonymize or mask them (e.g., 192.168.0.0/24) using custom log formats or external scripts. Avoid logging sensitive user identifiers or session data.
- PCI DSS: Requires log integrity for systems handling cardholder data. Secure logs by setting restrictive permissions (e.g., chmod 640, chown root:adm) and implementing audit trails.
- Data anonymization: Apply hashing or truncation to user-identifiable fields in logs before storage or external transmission.
- Log retention policies: Define how long logs are stored to comply with legal and organizational requirements. Many organizations retain logs for 30–90 days.
Encryption (e.g., using TLS for log forwarding) and restricted log access are essential for protecting stored and transmitted data.
Real-Time NGINX Log Monitoring
Proactive monitoring can reduce downtime and improve performance visibility. Configure real-time alerts for:
- HTTP error spikes (e.g., 500 errors)
- Latency thresholds (e.g., response time > 500ms)
- Traffic anomalies
NGINX supports monitoring via tools such as Prometheus and Grafana. Use the stub_status module or the ngx_http_api_module (NGINX Plus) to export real-time metrics.
For example, Prometheus can scrape metrics and trigger alerts using Alertmanager. Grafana dashboards help visualize patterns across multiple NGINX instances.
Automated anomaly detection or custom scripts enable faster incident response by scanning for patterns like unusual response codes or IP floods.
NGINX Log Analysis Tools Integration
Integrating NGINX logs with external tools simplifies centralized analysis:
- ELK Stack (Elasticsearch, Logstash, Kibana): Collects and visualizes access/error logs for threat detection and system health monitoring.
- Fluent Bit or Fluentd: Lightweight log forwarders that send logs to centralized platforms or cloud destinations (e.g., OpenSearch, Splunk).
- Splunk: Offers advanced search and machine learning to analyze traffic patterns, detect anomalies, and correlate with other system logs.
- Custom scripts: Bash, Python, or Go scripts using regex can filter logs in real-time or post-processing pipelines.
For example, a Python script could monitor /var/log/nginx/access.log for repeated status code 403s and trigger a firewall rule.
Dashboards created with tools like Grafana provide insights into request rates, bandwidth usage, and error distributions, helping teams troubleshoot and optimize performance quickly.
NGINX Log Troubleshooting and Debugging
When a site fails to load or behaves unexpectedly, NGINX logs are the first place to check. NGINX logs record every request and server event. Logs help spot errors, crashes, or traffic problems. A 404 means a missing file. A 502 or 504 points to upstream issues. Reading logs helps find the root cause fast. It also improves server performance.
Below is a breakdown of common log analysis scenarios, how to interpret error messages, analyze performance, and use tools to debug issues effectively.
Common NGINX Log Analysis Scenarios
NGINX access logs are essential for spotting traffic patterns and issues. To debug 404 errors, search for missing pages using:
grep " 404 " /var/log/nginx/access.logA 404 means the file isn’t found. This could be a wrong URL, misconfigured root, or missing static file.
To analyze slow response times, log $request_time and $upstream_response_time. These show how long NGINX and your backend take to respond:
log_format perf '$remote_addr "$request" $status $request_time $upstream_response_time';Use this to find the slowest requests:
awk '{print $NF}' access.log | sort -nr | head -n 10Bot traffic and scraping show up as repeated requests from the same IP or suspicious user agents like curl or sqlmap. Detect top IPs with:
awk '{print $1}' access.log | sort | uniq -c | sort -nr | headTo track user journeys, use variables like $http_referer, $remote_addr, and $request to understand how users move across your site.
NGINX Error Log Interpretation
The error log shows issues NGINX encounters. Common messages include:
- 404 Not Found – File missing
- 403 Forbidden – Access denied
- 500 Internal Server Error – App or config issue
- 502 Bad Gateway – Bad upstream response
- 504 Gateway Timeout – Upstream didn’t reply
- 503 Service Unavailable – Server overloaded
- 400 Bad Request – Client error
- SSL: handshake failed – Certificate or key issue
- connect() failed (111) – Upstream refusing connection
- client intended to send too large body – Exceeded upload size
Each error has a severity level, like error, crit, or debug. To correlate errors with access logs, match by timestamp or IP. If you see repeated 502s, check $upstream_response_time to confirm backend slowness. For SSL/TLS issues, look for “SSL” messages in error.log to trace certificate mismatches or expired keys.
NGINX Performance Analysis Through Logs
Logs help benchmark server performance. Start with $request_time and $upstream_response_time to measure how long each request takes. High values suggest slow apps or upstreams.
To check bandwidth, use $body_bytes_sent and $request_length. This tells you which endpoints are consuming the most data.
You can track cache efficiency using $upstream_cache_status. Add it to your log format to see if requests are HIT, MISS, or BYPASS.
For load balancing, use $upstream_addr to see which backend server handled the request. Uneven distribution may reveal misconfigurations. Example custom log line:
log_format upstream '$remote_addr $request $upstream_addr $request_time $upstream_response_time';NGINX Log Debugging Tools and Techniques
Use tools like grep, awk, cut, and tail -f for fast log inspection. Example:
grep "500" access.log | tail -n 10Regular expressions help match patterns, like all 4xx or 5xx errors:
grep -E " 4[0-9]{2} | 5[0-9]{2} " access.logFor automation, scripts can detect high error rates or failed login attempts. Tools like GoAccess, Grafana, and Datadog provide real-time log dashboards. Use multitail or less +F for live terminal views.
Logs also integrate with platforms like the ELK Stack or Grafana Loki for alerting and visualization. These setups turn raw log data into actionable insights.
Advanced NGINX Logging Configuration Examples
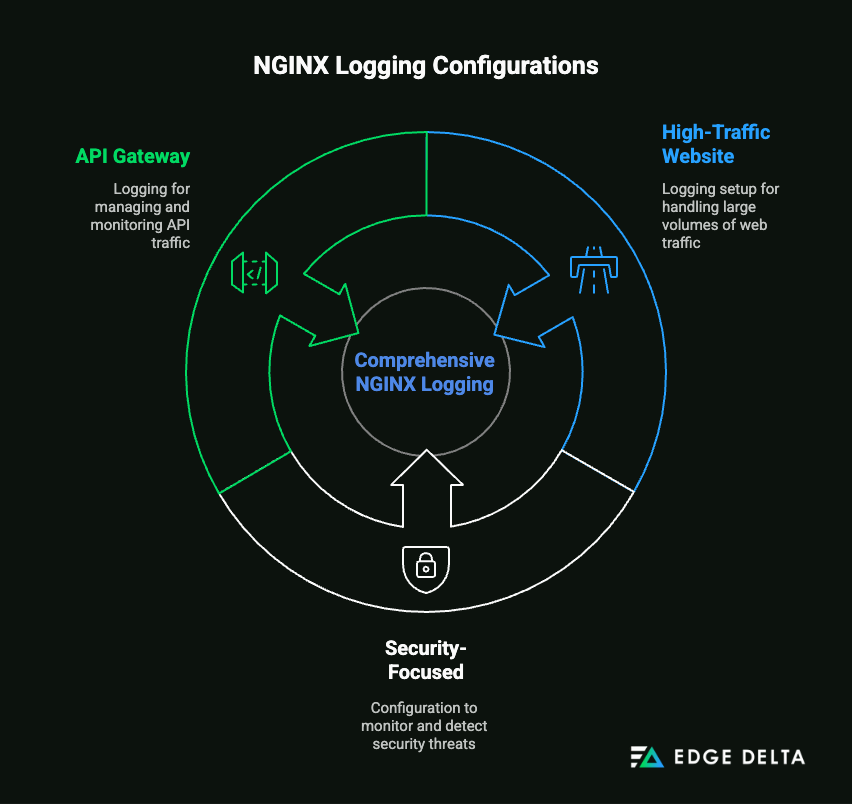
NGINX’s flexibility in log formatting and conditional logging allows it to support diverse deployment environments and operational needs. From high-traffic websites to containerized microservices, configuring logging appropriately is critical for observability, performance analysis, and security.
High-Traffic Website NGINX Logging Setup
For large-scale applications, a multi-tier logging strategy helps isolate log verbosity between access tiers (e.g., edge vs. application). NGINX supports multiple access_log directives, allowing traffic to be logged with different formats or to different files based on request attributes.
To aggregate logs behind a load balancer, use tools like Fluent Bit or Logstash to collect logs from each NGINX instance and forward them to centralized platforms like Elasticsearch or Amazon OpenSearch.
For correlation across microservices, NGINX can log X-Request-ID or traceparent headers, enabling distributed request tracking. When integrated with OpenTelemetry, NGINX participates in distributed tracing pipelines.
Example config:
map $http_x_request_id $request_id {
    default $http_x_request_id;
    ""      $request_id;
}
log_format trace '$request_id $remote_addr - $remote_user [$time_local] '
                 '"$request" $status $body_bytes_sent "$http_referer" '
                '"$http_user_agent"';
access_log /var/log/nginx/access.log trace;
Security-Focused NGINX Logging Configuration
To ensure robust security observability, NGINX can be configured to conditionally log events such as failed authentication attempts, rate-limiting violations, and unexpected HTTP status codes. Using map and if directives, these events can be isolated into separate log files.
Security logs are often forwarded to SIEM systems like Splunk or Elastic Security for real-time analysis. Logs can include user-agent strings, IP addresses, and headers (with token masking) to support audit trails and intrusion detection.
Example config:
map $status $log_security {
    ~^401 1;
    ~^403 1;
    ~^429 1;
    default 0;
}
log_format security '$remote_addr - $remote_user [$time_local] "$request" '
                   '$status "$http_user_agent" "$http_authorization"';
access_log /var/log/nginx/security.log security if=$log_security;
NGINX API Gateway Logging
As an API gateway, NGINX can capture key data points such as request/response bodies, rate limits, endpoint usage, and auth events. To log request bodies, ensure buffering is enabled using client_body_buffer_size.
Log formats can be extended to capture paths (for versioning like /v1/, /v2/) and headers such as Authorization (with proper masking). NGINX Plus or custom Lua scripts can further extend logging capabilities for quotas and response content.
Example config:
client_body_buffer_size 128k;
log_format api_gateway '$remote_addr "$request" $status '
                      '"$request_body" "$http_authorization" $request_time';
access_log /var/log/nginx/api_gateway.log api_gateway;
NGINX Container and Kubernetes Logging Integration
In containerized deployments, NGINX logs should be directed to stdout and stderr so that container runtimes (like Docker) and orchestrators (like Kubernetes) can collect them using logging agents like Fluent Bit or Fluentd.
Kubernetes environments use sidecars or DaemonSets to collect and forward logs to centralized systems like CloudWatch, Google Cloud Logging, or ELK Stack.
Dockerfile config:
RUN ln -sf /dev/stdout /var/log/nginx/access.log \
&& ln -sf /dev/stderr /var/log/nginx/error.log
Kubernetes YAML snippet:
containers:
  - name: nginx
   image: nginx:latest
   volumeMounts:
      - name: nginx-logs
        mountPath: /var/log/nginx
volumes:  - name:
 nginx-logs
    emptyDir: {}
Conclusion
NGINX logging is more than just a troubleshooting tool. It’s a foundation for performance, security, and operational visibility. When using centralized logging, including NGINX logs, it can reduce mean time to resolution (MTTR) by up to 50%. When logs are well-structured and accessible, teams can detect and resolve issues faster.
By customizing log formats, administrators can capture the exact data needed for each use case—from tracing API performance to detecting security threats. Variables like $request_time, $upstream_response_time, and $ssl_protocol offer deep insights into server behavior and user activity.
However, logging should be optimized to avoid unnecessary load. Buffered logging, smart filtering, and regular rotation help maintain performance even under heavy traffic.
Finally, integrating logs into real-time monitoring and analysis tools turns raw data into actionable insights. Whether you’re managing a high‑traffic site, a secure API, or a containerized stack, robust logging is critical. A strong NGINX logging strategy keeps your systems healthy, secure, and ready to scale. For teams looking to automate what comes next, the SRE Teammate correlates NGINX logs with metrics and traces to surface incidents before they escalate.
Frequently Asked Questions About NGINX Logging
Where are NGINX logs stored by default?
Default locations: /var/log/nginx/access.log and /var/log/nginx/error.log. NGINX logs can be customized using access_log and error_log directives. Location varies by installation method and operating system.
How do I create custom log formats in NGINX?
Use log_format directive to define custom formats. Example: log_format custom ‘$remote_addr – $remote_user [$time_local] “$request” $status $body_bytes_sent’; then reference with access_log /var/log/nginx/custom.log custom;
What’s the performance impact of detailed logging?
Detailed logging can affect performance, especially with complex formats or high traffic. To minimize impact, use buffered or asynchronous logging, limit verbosity in production, and apply sampling or filters to reduce unnecessary log volume.
How do I analyze NGINX logs for security threats?
Monitor for suspicious patterns: unusual user agents, high request rates from single IPs, requests for common exploit paths (/admin, /wp-admin), SQL injection attempts in query strings. Use tools like fail2ban for an automated response.
How often should NGINX logs be rotated?
Daily rotation for most sites. High-traffic sites may need hourly rotation. Use logrotate with proper configuration. Consider file size limits (1GB max recommended) and retention periods based on compliance requirements.
Can I log to multiple files simultaneously?
Yes, use multiple access_log directives with different formats and conditions. Example: separate logs for API endpoints, security events, or different virtual hosts. Useful for organizing logs by purpose or analysis needs.
References:

