The OpenTelemetry framework is at its core a standard for managing telemetry data as it travels across your systems. It has been widely adopted and grown significantly in popularity due in large part to its unified approach, removing vendor lock-in and guaranteeing platform uniformity. While it boasts a wide array of tools, there are two pieces of the OTel framework which are particularly valuable: Context Propagation and Tracing.
In this article we will dive into the nuts and bolts of them both and demonstrate how they strengthen the observability process.
Key Takeaways
- With distributed tracing and context propagation, you can visualize the end-to-end picture of service interactions and system performance.
- Efficient root cause analysis (enabled by distributed tracing and context propagation) enhances product reliability by quickening the troubleshooting process.
- Performance monitoring detects bottlenecks and maximizes the use of available resources.
- Comprehensive monitoring guarantees span generation for each potential issue.
- This unified approach effectively integrates traces into your observability processes.
Full Definition of OpenTelemetry Context Propagation and Tracing
Distributed tracing gives users information on how their requests are traveling throughout their system, and Context propagation provides additional information by enabling traces to collect causal information relevant to requests, mapping them to other traces within a span regardless of where the request was created. Each of these pieces is critical when monitoring the health of your distributed system, giving you insight into which components are creating issues for your organization as a whole.
Context Propagation and Distributed Tracing are vital for developers and operators to understand, as they streamline the issue diagnosis, performance bottleneck identification, and request flow tracking processes. Distributed Tracing is the foundation of these two methodologies, as it formulates the traces which represent the request’s journey between two services. Context Propagation augments this by adding high-level context to traces, allowing them to associate with other traces in the same span across services.
| Factor | Context Propagation | Tracing Scope |
|---|---|---|
| Trace Data and Metadata | (to create spans) | Trace Data |
| Purpose | Ensure coherent span structure | Ensure coherent trace structure |
| Components | Trace context, baggage, user-defined context | Trace IDs, Trace beginning, Trace end, etc. |
Diving Deeper Into OpenTelemetry Context Propagation
Context Propagation is the process of adding metadata to track traces in the context of spans, which are aggregates of individual traces that represent a request’s entire journey through a given system. This is especially important in the distributed case; different services can live in completely separate environments, and without this metadata there would be no good way to associated connected traces.
By adding spanIDs to each trace, developers can clearly see which sequence the trace belongs to, and quickly identify any issues that arise when a request moves through that given flow. This is incredibly easy, particularly when using the OpenTelemetry framework to do so.
Components of Context Propagation
In a distributed system, the context serves as a container for metadata associated with a particular request as it passes through various services. Carriers are in charge of transferring context data inside and outside of these processes. Propagators, on the other hand, specify how the context is encoded and decoded into the carriers, guaranteeing that the trace data is reliably transmitted throughout the request path.
Types of Context
Here are the three essential components of Context Propagation:
Trace Context
Trace Context is the metadata used to correlate and follow a request across various services. It usually consists of a span ID, which identifies a particular work unit inside that trace, and a trace ID exclusive to that trace.
Baggage
Baggage is a set of user-defined key-value pairs that can spread with the trace context. It allows the transmission of additional data that is useful for various tasks, such as debugging or customized logging.
User-Defined Context
Developers can add unique pieces of data to the context by creating user-defined contexts. These typically contain relevant data that should be sent with the request but are not included in the baggage or trace.
Implementing Context Propagation via OpenTelemetry
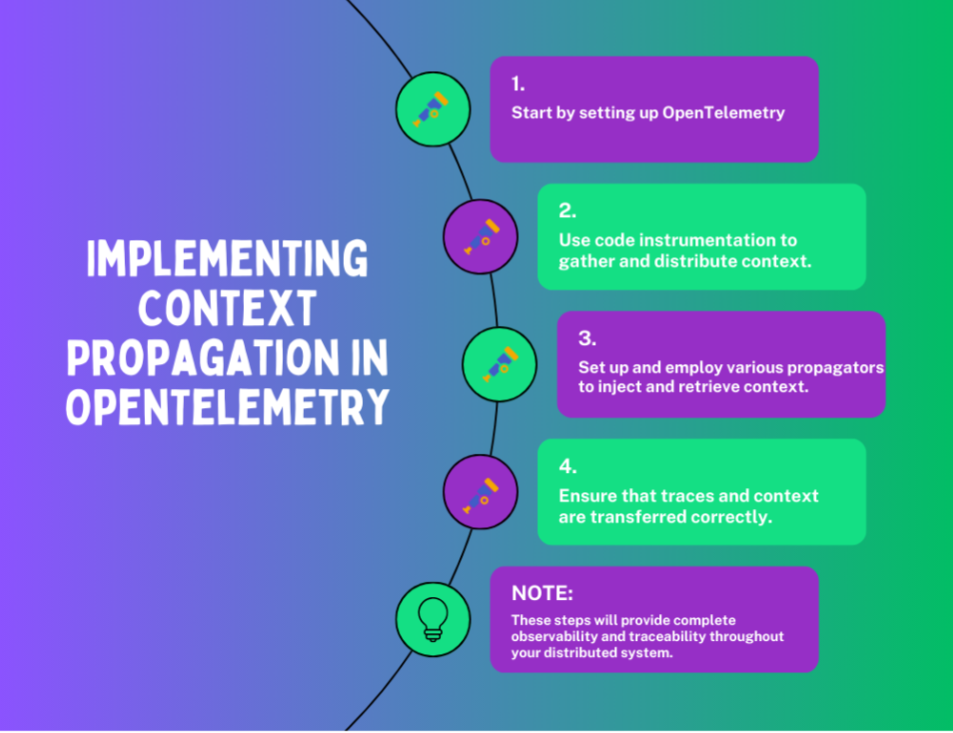
Various processes are involved during the OpenTelemetry context propagation implementation process, to guarantee that trace data is appropriately recorded and preserved throughout each and every service. Shown below is a step-by-step tutorial which guides you on that process:
Configure OpenTelemetry – Begin by setting up OpenTelemetry in your project, including installing all necessary OpenTelemetry packages and dependencies specific to your programming language.
Instrument Code – Instrument your code to gather and distribute context appropriately. This involves implementing the OpenTelemetry tracing functionality into your program (if you are doing this in Go, check out our step-by-step guide to do exactly this).
Configure Propagators – Set up and employ various propagators to inject and retrieve context. The propagator you choose will depend on the requirements and particular use-case you are working with.
Testing and Validation – Ensure that OpenTelemetry traces and context are transferred correctly across services by properly testing your implementation. Validate that the trace information can be visualized and captured appropriately.
By following these steps, you can establish robust context propagation in your application, to help provide complete observability and traceability throughout your system.
Diving Deeper Into OpenTelemetry Tracing
Distributed tracing involves tracking request data between various distributed system components and services. With it, a request lifecycle can be fully expressed and understood. It offers a complete understanding of the behavior and performance of the system.
Trace Identifiers
OpenTelemetry stitches together traces using multiple vital identifiers. These IDs are essential to preserving the continuity and organization of traces. It is possible to visualize the entire journey of a request by connecting spans with these identifiers, highlighting the interactions between services and the timing of various operations.
Propagation Mechanisms
One of the most common methods of propagating trace data across services is HTTP headers. Trace data is typically included in the request headers when a request is made from one service to another. After extracting this data, the receiving service continues the transaction.
Why Does OpenTelemetry Context Propagation Matter?
For distributed systems to function reliably and efficiently, it is crucial to understand how a request moves across several services. Context propagation and distributed tracing provide a unified picture of the request lifecycle by connecting service interactions.
Here’s why these two functions are essential:
Improved Observability
Both of these methodologies give a comprehensive picture of a request’s path, which enhances observability. This visibility aids in detecting anomalies, comprehension of service interactions, and preservation of system health.
Root Cause Analysis
Using these processes will speed up and improve root cause analysis. Detailed traces aid in identifying the source of problems, such as failed database calls or spikes in latency in particular services, enabling prompt and efficient issue resolution.
Performance Monitoring
For performance improvement and monitoring, they are essential. Teams can implement well-informed performance enhancements by tracing requests to detect bottlenecks and resource consumption issues, such as slow queries or network latency.
Conclusion
Understanding and implementing OpenTelemetry context propagation and distributed tracing is crucial to preserving the functionality and health of modern distributed systems. These mechanisms enhance observability, enabling a thorough understanding of request lifecycles and service interactions.
Furthermore, they are essential performance monitoring tools that help locate and fix bottlenecks to maximize system responsiveness. Organizations may use these techniques to guarantee strong, dependable, and high-performing apps.
FAQs on OpenTelemetry Context Propagation and Distributed Tracing
What is context propagation in OpenTelemetry?
Context propagation is the mechanism by which event messages carry metadata across service and process boundaries.
What is the difference between OpenTelemetry and OpenTracing?
OpenTelemetry adds metrics and logs, while OpenTracing concentrates only on distributed tracing. With its unified method for gathering and examining metrics, traces, and logs, OpenTelemetry gives you a thorough grasp of the functionality and behavior of your system.
What is a propagator in OpenTelemetry?
In OpenTelemetry, a propagator is an entity capable of injecting and extracting context from a carrier.