

.NET MAUI (Multi-platform App UI) is Microsoft’s modern cross-platform framework for building native mobile and desktop applications using a single shared codebase. Developers write apps in C# and .NET, and MAUI produces native applications for Android, iOS, macOS, and Windows. It unifies UI, business logic, and project structure across platforms while still allowing platform-specific customization.
While this approach simplifies development, it introduces significant observability challenges. Applications that span multiple operating systems and device types generate telemetry under different runtime conditions, making it difficult to collect consistent, high-quality traces and understand end-to-end application behavior — especially when troubleshooting issues that only appear on specific platforms.
OpenTelemetry (OTel) provides a unified, cross-platform way for .NET MAUI applications to generate metrics, logs, and traces using one consistent instrumentation model across Android, iOS, macOS, and Windows. By enabling the OTel SDK within a MAUI app and configuring the OTLP exporter, developers can send rich, standardized telemetry data directly to Edge Delta, regardless of device or platform. From there, Edge Delta can handle the heavy lifting of optimization, analysis, and delivery across the broader monitoring ecosystem.
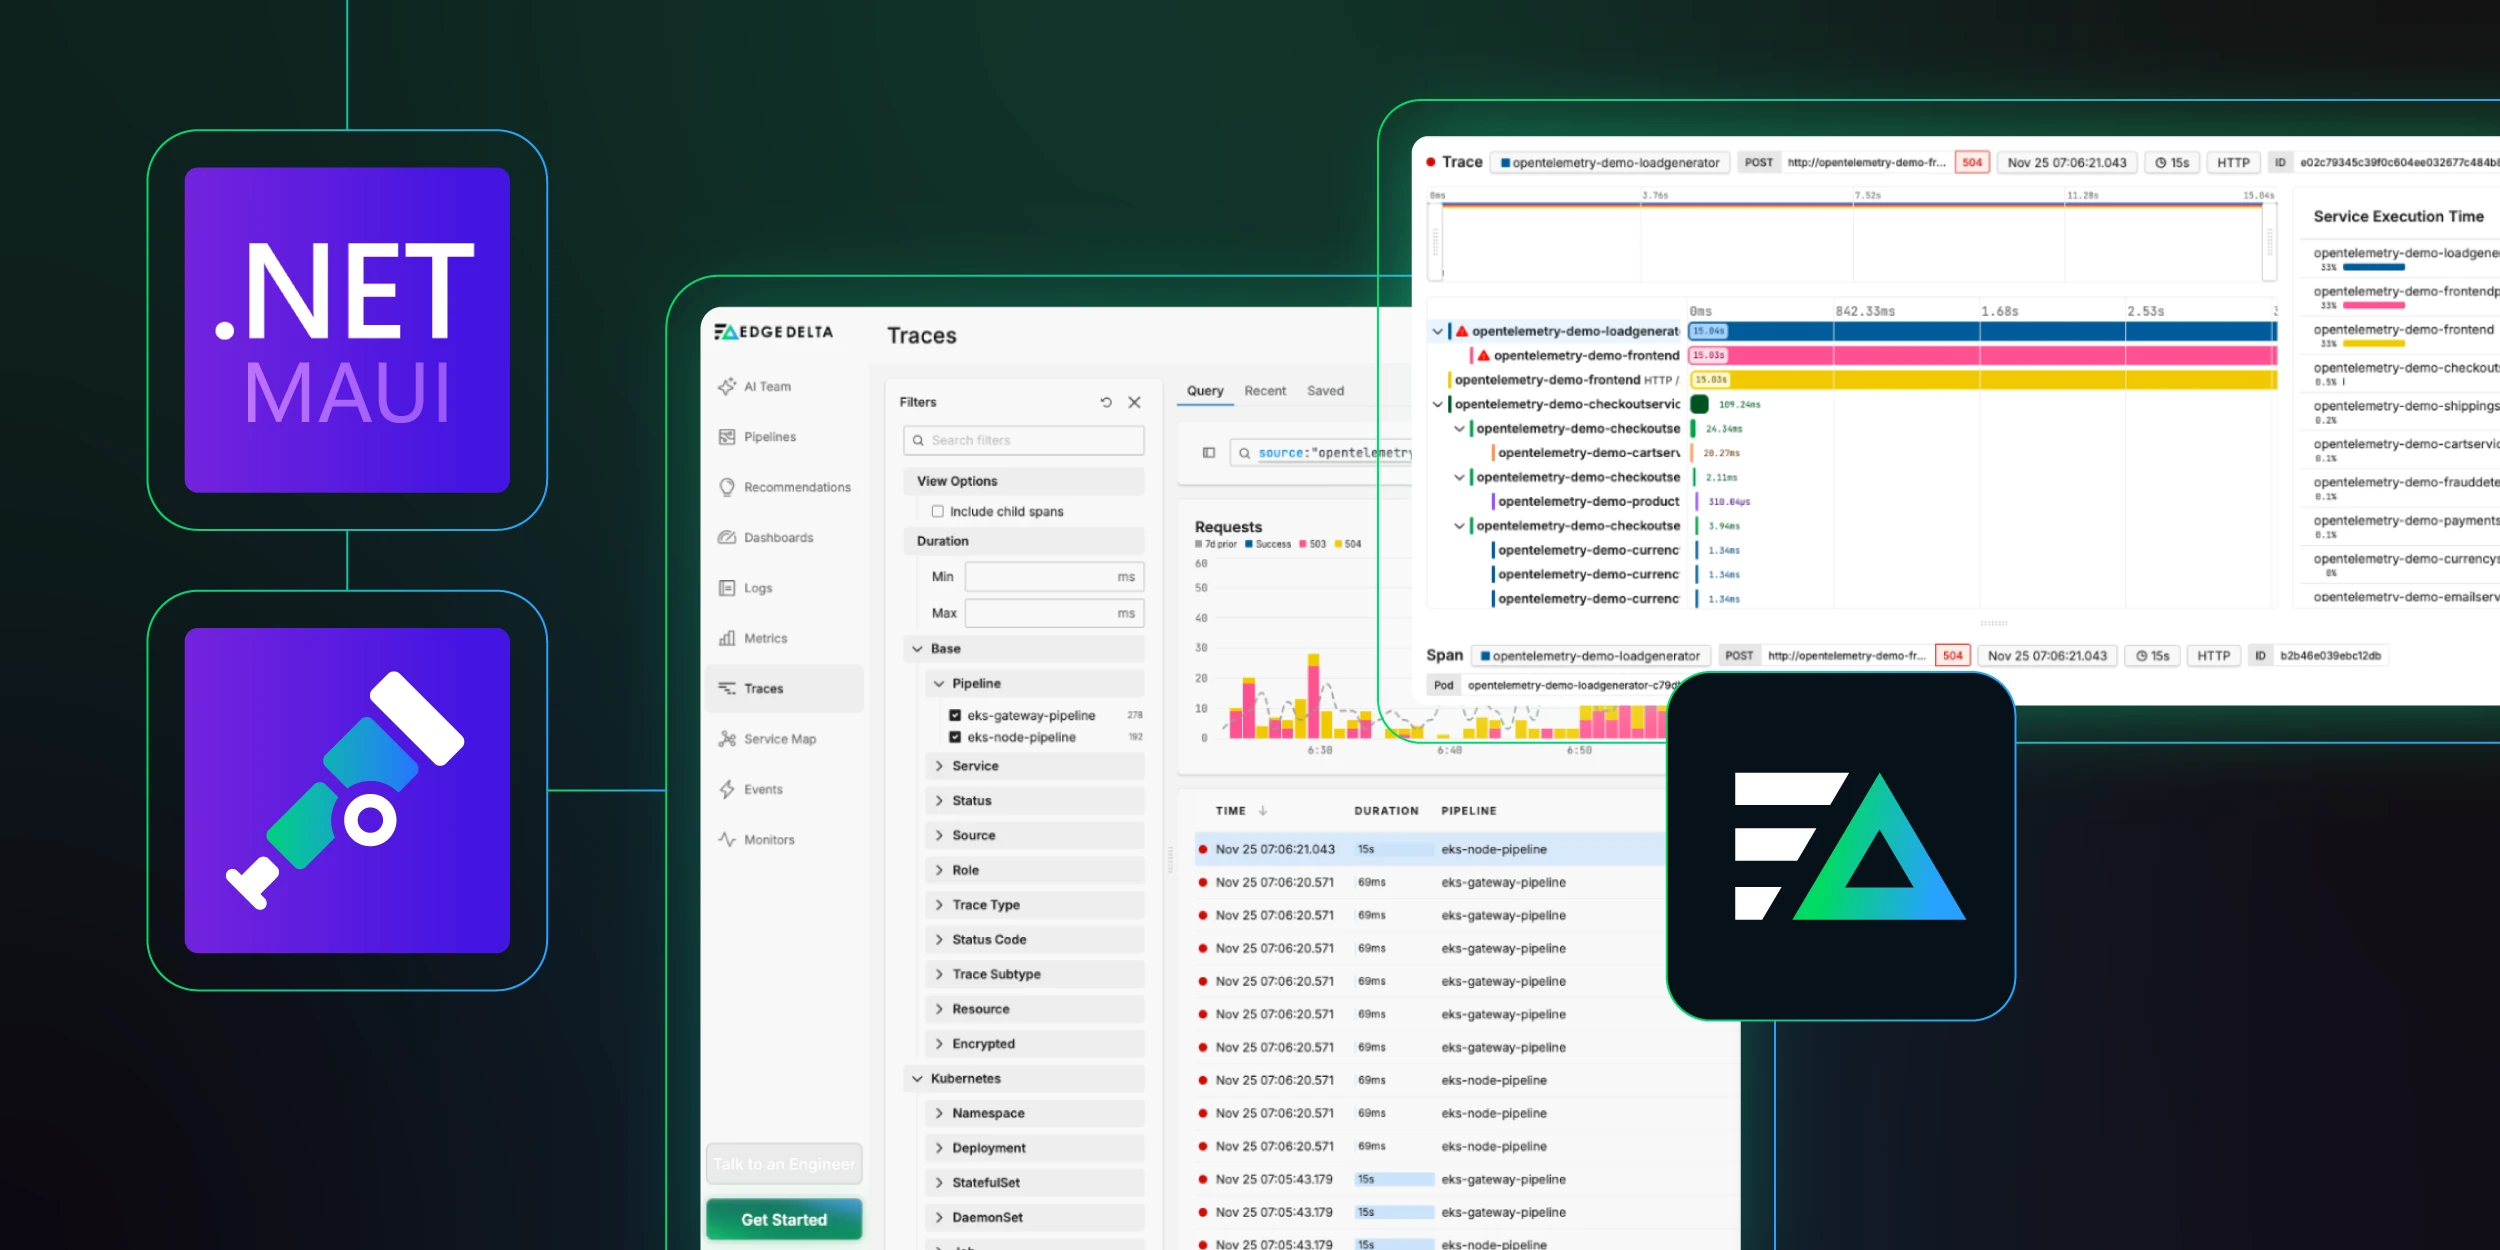
In this blog post, we’ll demonstrate how to instrument a .NET MAUI application with OpenTelemetry and export trace data to Edge Delta, where it can be processed and visualized using the Edge Delta Trace Explorer.
High‑Level Architecture
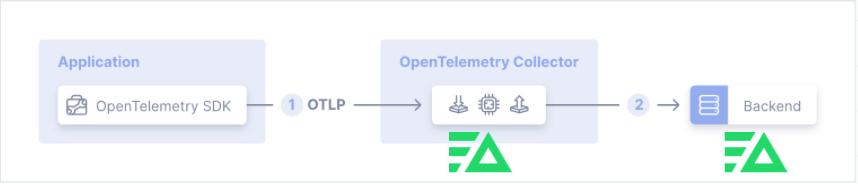
Clients can choose between the OTel zero-code or manual-code instrumentation of the .NET MAUI agent. The OTel agent will be configured to send data to an Edge Delta agent, which is equivalent to an OpenTelemetry Collector. The Edge Delta agent will then process the data and send it to Edge Delta’s Observability Platform for dashboarding and alerting.
Solution Components
Edge Delta Telemetry Pipeline
Edge Delta can be deployed either as a Linux agent or as a cloud pipeline, which both use the same OTLP input concept. On Linux, you deploy the Edge Delta agent (for example, as a systemd service or container) and configure an OTLP input node in the agent’s pipeline YAML. This input is typically bound to a local port (e.g., 0.0.0.0:4317 for gRPC or 4318 for HTTP) and set to accept OTLP signals (logs, metrics, and traces).
Your .NET MAUI app (or any OTel-instrumented service) is then configured to use the Edge Delta agent’s address as its OTLP endpoint. Once data arrives, the pipeline can enrich, transform, filter, and route telemetry data to downstream systems such as SIEMs, observability platforms, or object storage.
In a cloud deployment, Edge Delta’s Cloud Pipeline plays the same role but runs centrally instead of on the host. You define an OTLP input in the Cloud Pipeline configuration, expose it through a secure endpoint (often behind TLS and an API gateway or load balancer), and point your OTel exporters at that URL. This pattern works well when you want multiple apps or environments (including MAUI clients, backend services, and infrastructure) to send OTLP data to a single, shared Edge Delta pipeline.
In both Linux and cloud deployments, the OTLP input acts as the standard ingest point, and the rest of the Edge Delta pipeline handles normalization, analytics, and routing — giving you a consistent way to handle OTel data regardless of where it originates.
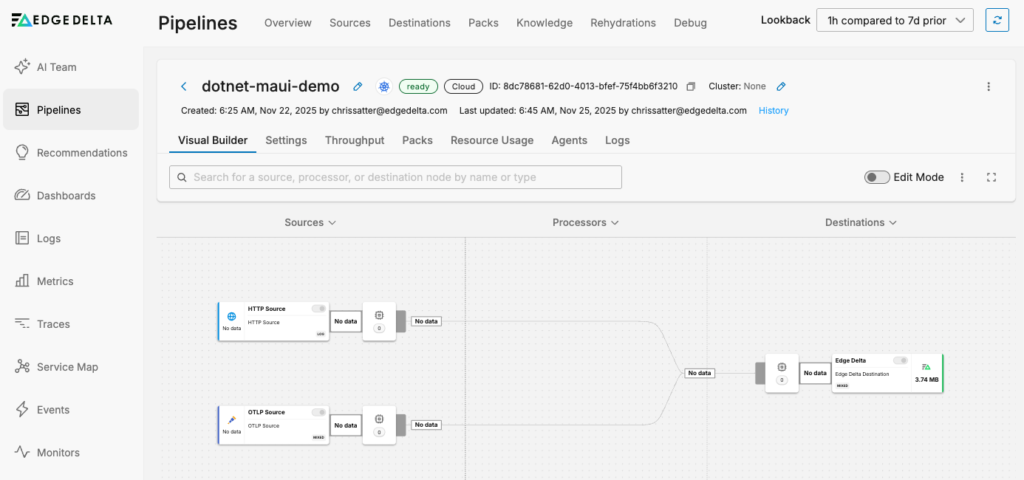
In the example below, we are leveraging one of Edge Delta’s Cloud Pipelines, which comes provisioned with an OTLP input node:
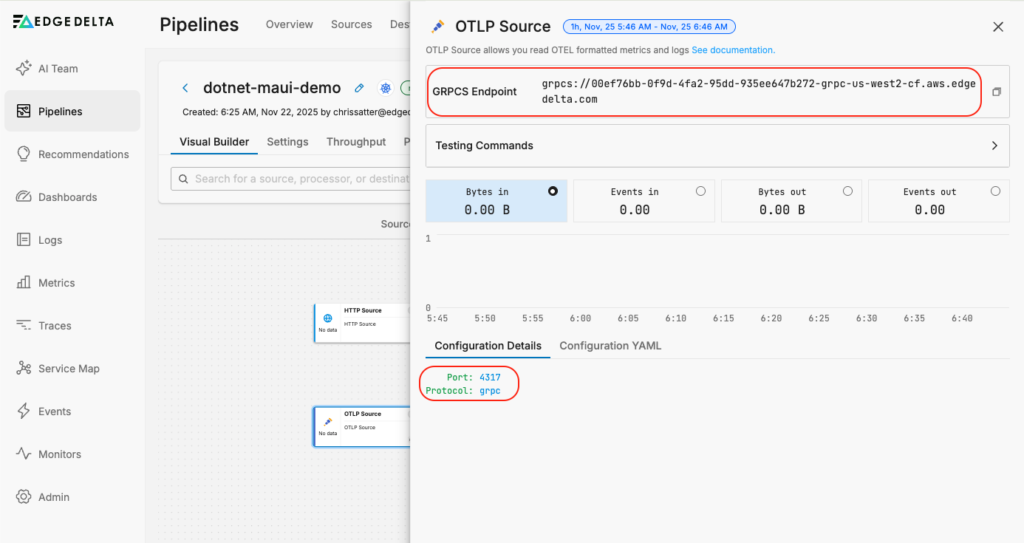
Double-clicking on the node exposes the gRPC endpoint address, as well as the TCP port and protocol the node is listening on:
OpenTelemetry Requirements
Because .NET MAUI is built on top of the standard .NET runtime, MAUI applications can use the official OpenTelemetry .NET SDK to generate traces, metrics, and logs. However, OpenTelemetry does not yet provide MAUI-specific documentation or templates, and certain mobile behaviors — such as app lifecycle constraints on Android and iOS — may require additional configuration.
In practice, this means that MAUI applications can use the same .NET OpenTelemetry APIs (ActivitySource, Meter, and ILogger) as other .NET workloads, but teams should validate behavior on each target platform and be aware that some features, especially metrics on mobile, may vary by runtime or require platform-specific adjustments. Overall, MAUI is compatible with OpenTelemetry, but it should be treated as a general .NET integration rather than a fully first-class, mobile-optimized OTel scenario.
The following requirements outline the key packages, configuration settings, and platform considerations needed to successfully instrument a .NET MAUI application with OpenTelemetry and export data via OTLP. You can also consult the OpenTelemetry documentation for more information.
-
Required packages:
- OpenTelemetry
- OpenTelemetry.Exporter.OpenTelemetryProtocol
- OpenTelemetry.Extensions.Hosting
- OpenTelemetry.Instrumentation.Http
- OpenTelemetry.Instrumentation.Runtime
- (Optional) OpenTelemetry.Exporter.Console for local debugging.
-
Resource configuration:
- Set standard resource attributes such as
service.nameandservice.versionvia ResourceBuilder. - In this example, the service is configured as
WeatherTwentyOne, version1.0.0, with namespacemauiand environmentdemo.
- Set standard resource attributes such as
-
OTLP endpoint and protocol:
- Configure the OTLP exporter to send data to a collector or Edge Delta OTLP endpoint using gRPC.
- The endpoint is resolved from the
ED_TRACE_ENDPOINTenvironment variable, defaulting tohttp://10.0.2.2:4317for Android emulators andhttp://localhost:4317for other platforms. - For HTTPS endpoints, configure the secure URL and omit the cleartext HTTP/2 setting.
-
Exporter configuration:
- Use
AddOtlpExporterto set the endpoint and protocol (OtlpExportProtocol.Grpc). - If authentication is required, configure request headers.
- Use
-
Tracing configuration:
-
Set the W3C trace context format:
Activity.DefaultIdFormat = ActivityIdFormat.W3CActivity.ForceDefaultIdFormat = true
-
Use a single
ActivitySource(for example,WeatherTwentyOne.App) for manual spans. -
Enable auto-instrumentation with
AddHttpClientInstrumentation(). -
Configure sampling using
AlwaysOnSampler().
-
-
Provider startup:
- Build tracer and meter providers eagerly at application startup.
- Register providers as singletons to ensure spans and metrics are captured as soon as the app starts.
-
Android-specific requirements:
-
Add the following permissions to the Android manifest:
android.permission.INTERNETandroid.permission.ACCESS_NETWORK_STATE
-
Enable cleartext traffic if using HTTP endpoints:
<application android:usesCleartextTraffic="true" />
-
Enable unencrypted HTTP/2 support when using HTTP endpoints:
AppContext.SetSwitch("System.Net.Http.SocketsHttpHandler.Http2UnencryptedSupport", true);
-
-
Optional debugging:
- Configure a simple span processor to log spans to Logcat (for example, using the tag
WeatherSpans) to verify that spans are being created correctly.
- Configure a simple span processor to log spans to Logcat (for example, using the tag
OTLP Endpoint and Protocol
Now that we’ve covered the requirements for instrumenting a .NET MAUI application with OpenTelemetry, this section will walk through how to configure the OTLP exporter so that traces can be sent to Edge Delta for processing and visualization.
First, we set the OTLP gRPC endpoint in MauiProgram.cs, with an environment override for Edge Delta SaaS:
// Defaults (local collector/agent)
#if ANDROID
    private const string DefaultOtlpEndpoint = "http://10.0.2.2:4317";
#else
    private const string DefaultOtlpEndpoint = "http://localhost:4317";
#endif

// Helper to resolve the endpoint (env wins)
private static Uri GetOtlpEndpoint()
{
    var endpoint = Environment.GetEnvironmentVariable("ED_TRACE_ENDPOINT") ?? DefaultOtlpEndpoint;
    return new Uri(endpoint);
}
Here is our exporter configuration:
Action<OtlpExporterOptions> configureExporter = options =>
{
    var endpoint = GetOtlpEndpoint();
    options.Endpoint = endpoint;
    options.Protocol = OtlpExportProtocol.Grpc;

    var apiKey = Environment.GetEnvironmentVariable("ED_API_KEY");
    if (!string.IsNullOrWhiteSpace(apiKey))
    {
        // Edge Delta SaaS ingestion header
        options.Headers = $"x-ed-api-key={apiKey}";
    }

    if (options.Endpoint.Scheme.Equals("http", StringComparison.OrdinalIgnoreCase))
    {
        AppContext.SetSwitch("System.Net.Http.SocketsHttpHandler.Http2UnencryptedSupport", true);
    }
};
The exporter will use http://10.0.2.2:4317 on Android, or http://localhost:4317 elsewhere.
Edge Delta Trace Explorer
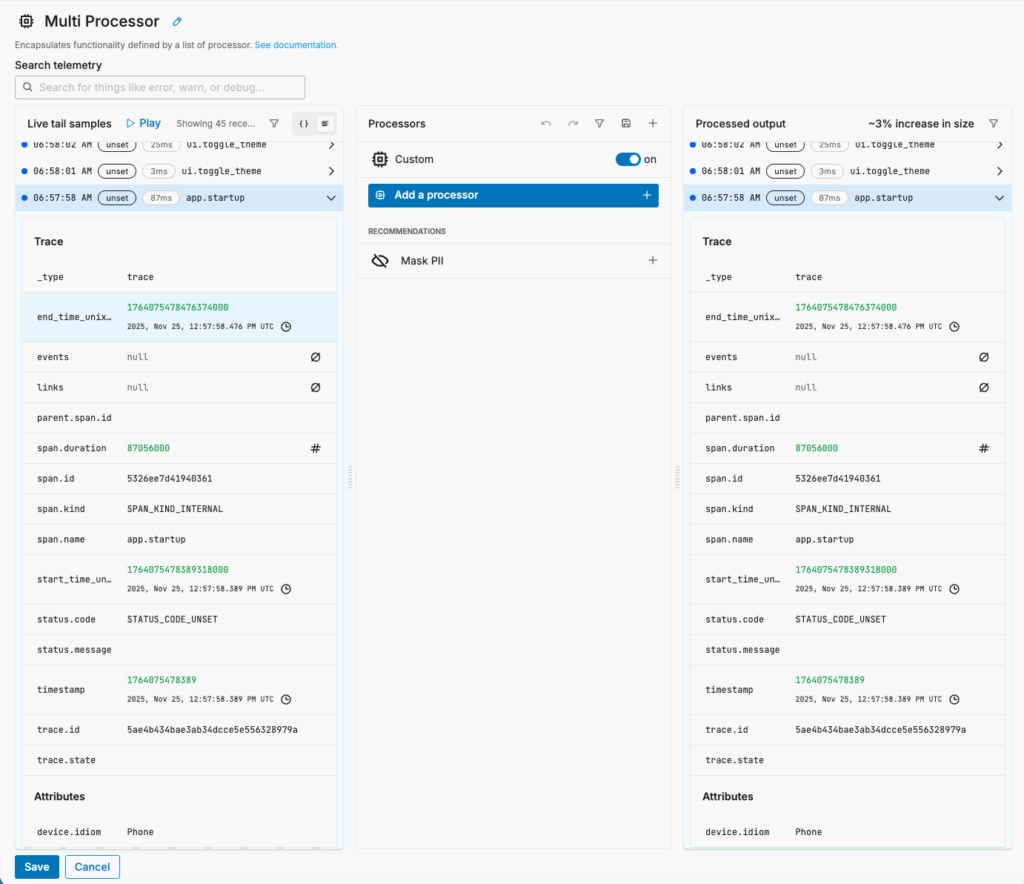
Once OpenTelemetry traces are exported from the .NET MAUI application and ingested by Edge Delta via the OTLP endpoint, the next step is validating and exploring that data. You can start by using Live Capture within the Multi Processor pipeline node to verify the ingested OTLP data matches your expectations. You can also add custom or pre-built processors to transform the data according to your requirements:
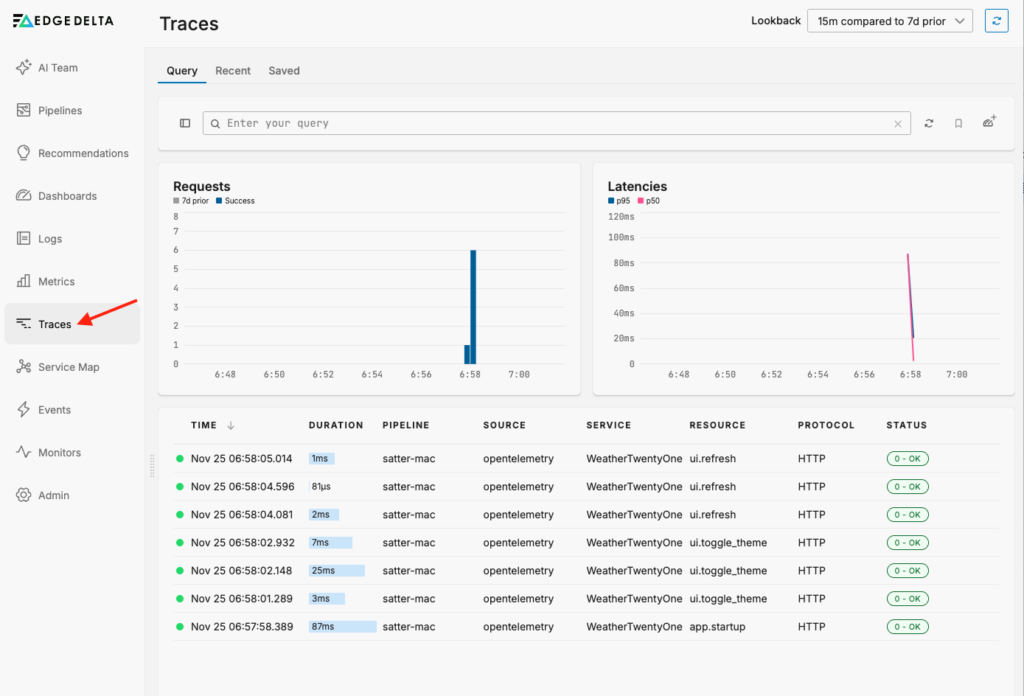
Once you’ve verified that trace data is flowing into Edge Delta and that the appropriate processing logic is being applied, you can navigate to the Trace Explorer by clicking on “Traces” in the Observability Platform:
You can also select specific traces to see more detail:
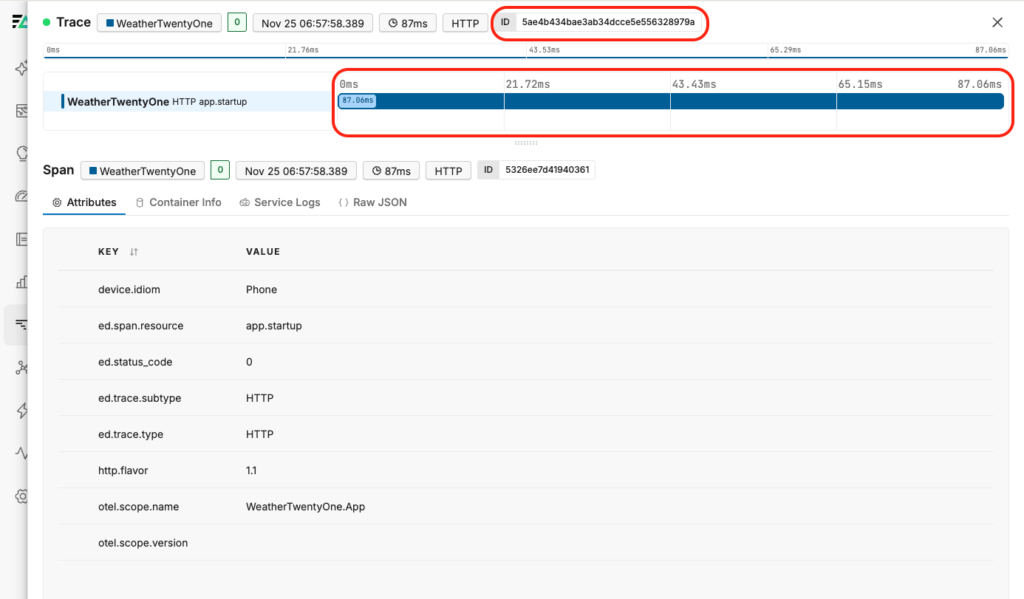
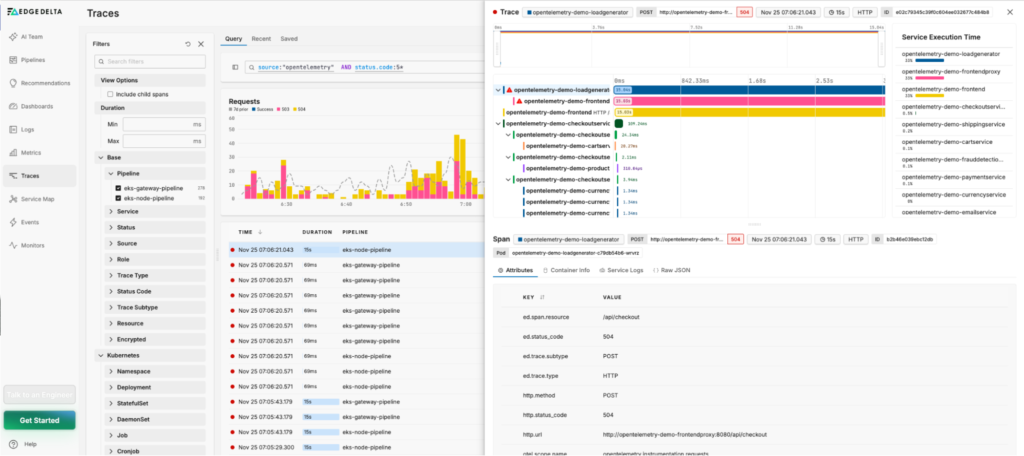
This trace is simple, containing only a single span. As applications become more complex and additional instrumentation is added, traces will include multiple related spans. The Trace Explorer makes it easier to understand these parent-child relationships, identify long-running operations, or uncover dependencies:
Conclusion
Monitoring .NET MAUI applications is challenging because a single codebase must operate reliably across multiple platforms with different runtimes and behaviors. Gaining consistent, end-to-end visibility into those applications — without adding complexity to the codebase — can be difficult.
In this post, we demonstrated how instrumenting a .NET MAUI application with OpenTelemetry and exporting trace data to Edge Delta enables standardized, cross-platform observability. By handling ingestion, normalization, enrichment, routing, and visualization, Edge Delta helps teams quickly understand application behavior, troubleshoot issues, and deliver high-quality user experiences without heavy or platform-specific instrumentation.
Edge Delta’s capabilities are not limited to OpenTelemetry traces and spans. Its Telemetry Pipelines can ingest any telemetry data from any source and route it to any destination, including SIEMs, observability tools, or object storage. This data can also be leveraged in curated views, dashboards, and alerts within Edge Delta’s own Observability Platform, as well as in multi-agent workflows with AI Teammates.
If you’d like to learn more about how Edge Delta can help with OpenTelemetry adoption, start a free trial.


