


Today’s dynamic services and ephemeral workflows produce extremely high volumes of observability data, which is enriched with key details like service names, pod IDs, container hashes, regions, and more. While this context can be an asset during troubleshooting, it can easily overwhelm downstream systems, making queries slower and more resource-intensive.
Edge Delta’s Observability Platform is the modern solution that supports quick and efficient search functionality for petabyte-scale telemetry data volumes. Not only is our platform built on the blazing-fast ClickHouse Database Management System (DBMS) — it also supports the use of facets during search, which allows users to run complex queries much more efficiently by minimizing read operations. And with Edge Delta’s Telemetry Pipelines, teams can easily create facets on their data before it’s indexed, ensuring it’s ready for facet search on arrival.
In this blog post, we’ll cover facets in detail, and explain how they significantly reduce query times to streamline issue detection and remediation. We’ll also demonstrate how easy it is to create and leverage facets effectively in the Edge Delta platform.
What Are Facets?
A facet is a field or attribute (like service name, source IP, or status code) used to filter, group, or aggregate telemetry data. Because facets are indexed directly into each data item, they allow teams to access and query information far more efficiently than relying on plain-text search alone.
Take the following sample logs in CSV format:
timestamp,service,pod_id,region,status,message
2025-08-28T07:15:43Z,checkout-service,checkout-7f5d8c9f6b-abc12,us-west-2,500,"Database connection timeout"
2025-08-28T07:16:02Z,auth-service,auth-6d4c7b9a4c-def45,us-east-1,401,"Invalid authentication token"
2025-08-28T07:16:25Z,inventory-service,inv-9a8b7c6d5e-ghi67,us-west-2,200,"Stock check completed successfully"
2025-08-28T07:16:47Z,payment-service,pay-2b3c4d5e6f-jkl89,eu-central-1,502,"Upstream service unavailable"
2025-08-28T07:17:18Z,auth-service,auth-6d4c7b9a4c-pqr56,us-east-1,500,"Database connection timeout"
2025-08-28T07:17:45Z,shipping-service,ship-4f5g6h7i8j-stu90,ap-southeast-1,404,"Address not found"
To find all logs with a “500” status code using plain-text search, we might run a query like:
status=500This forces the backend to scan every log line as raw text, matching the substring via regex. This approach becomes wildly inefficient as log volumes grow.
By adding the “status” field as a facet, we can run the following query instead:
status:500This query jumps directly to the indexed “status” field in each log without scanning the entire message, making searches far faster and more efficient.
Creating Facets in an Edge Delta Telemetry Pipeline
Adding new facets is incredibly challenging without a pipeline that can structure data before sending it downstream. Once data is indexed, it’s often rigid and difficult to reorganize, forcing teams to waste time and compute creating the facets they need.
Edge Delta’s Telemetry Pipelines address this problem by enabling users to add facets to telemetry data through pre-index parsing and enrichment — either with pre-built pipeline packs or custom OTTL statements. This ensures all facets are in place once the data arrives.
Adding Facets with Pipeline Packs
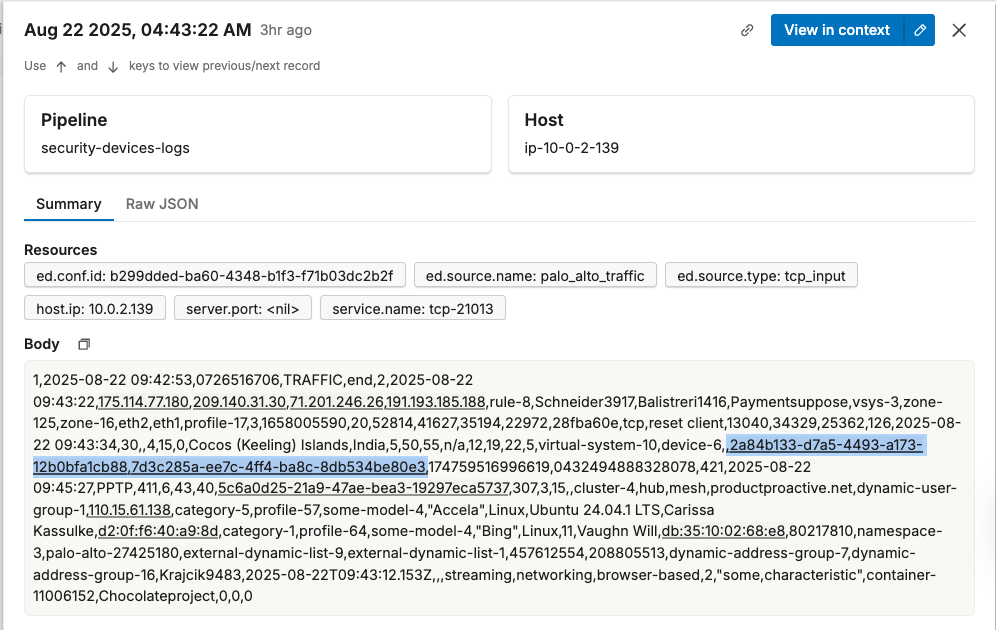
In the example below, we’re sending Palo Alto logs into Edge Delta’s Observability Platform. Currently, the logs are unstructured:
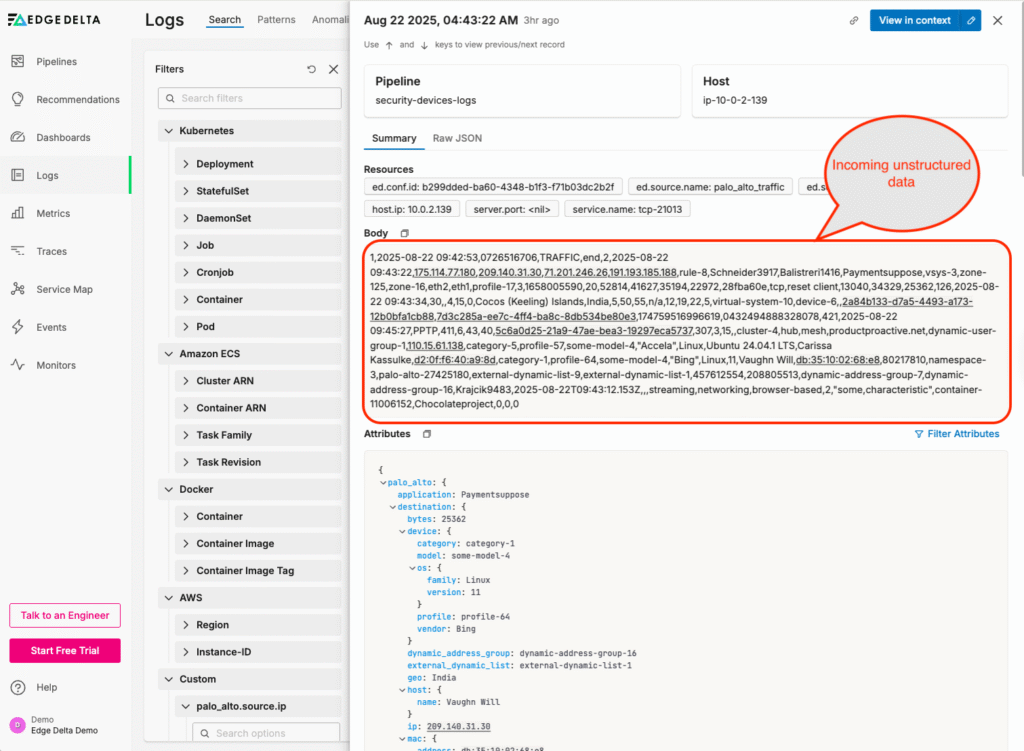
Without structured data, we can’t leverage facets to optimize query performance. To fix this, we can navigate to the Edge Delta Telemetry Pipeline collecting the logs, and add the pre-built Palo Alto Pack to parse them:
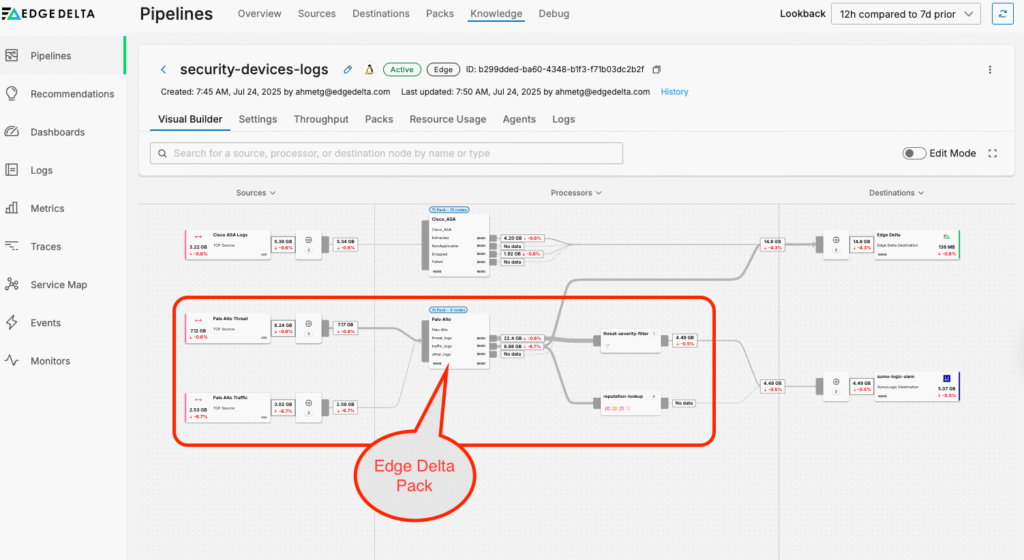
If we drill into the Pack, we can see how the data is being processed:
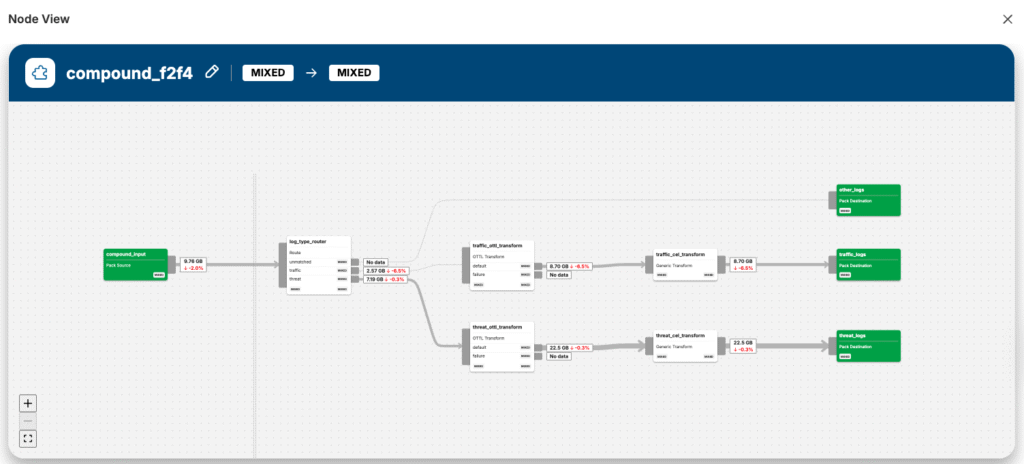
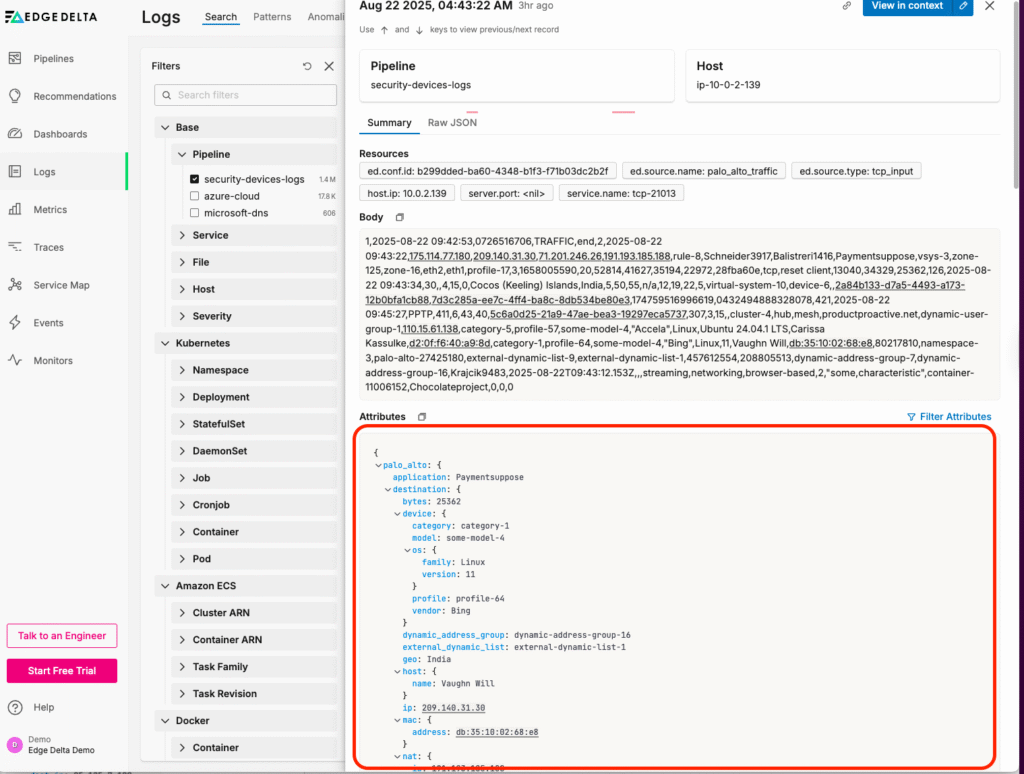
Once each log is processed, it will contain structured fields in the “attributes” portion of the item:
Adding Facets with OTTL
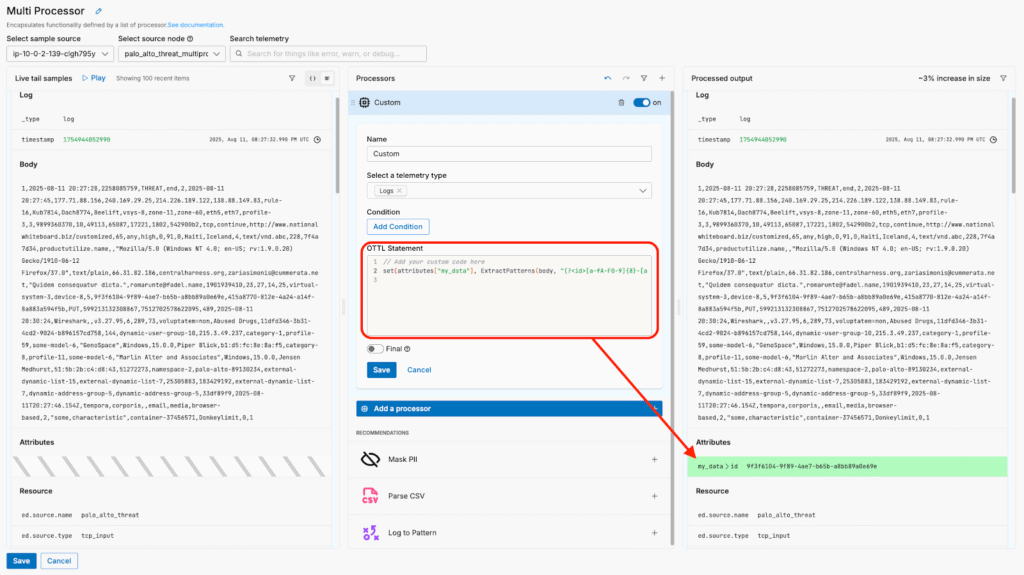
Alternatively, if we only need to build a facet for a single attribute, we don’t need to parse and structure the entire log item. Take the example below, where we only need to build a facet for the “id” attribute:
Here, we can use Edge Delta’s OTTL processing functionality to build a custom OTTL statement that captures the “id” field and adds it to the log item as an attribute:
Once the logs reach Edge Delta’s Observability Platform, we can use these newly created facets to search through them much more efficiently.
Searching with Facets in Edge Delta’s Observability Platform
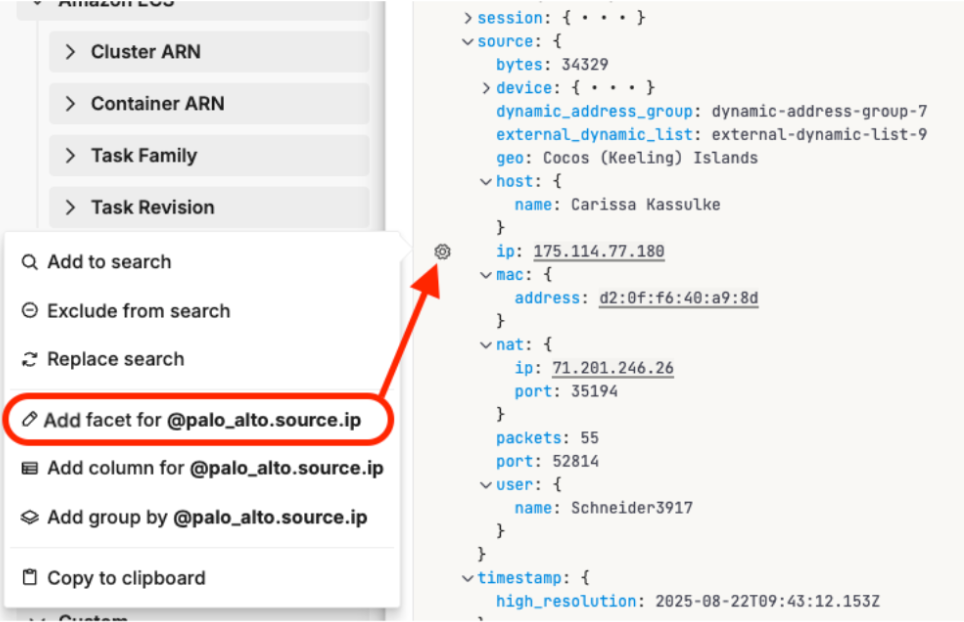
Edge Delta offers a wide range of out-of-the-box facet filters for data generated by AWS, Docker, and Kubernetes environments, which can be accessed in the “Filter” tab on the left-hand side of the Observability Platform interface. We can also add new custom facet filters by selecting an attribute directly from a log item. For this example, we’ll create a new facet filter for the “ip” field by selecting it, and clicking “Add facet for @palo_alto.source.ip”:
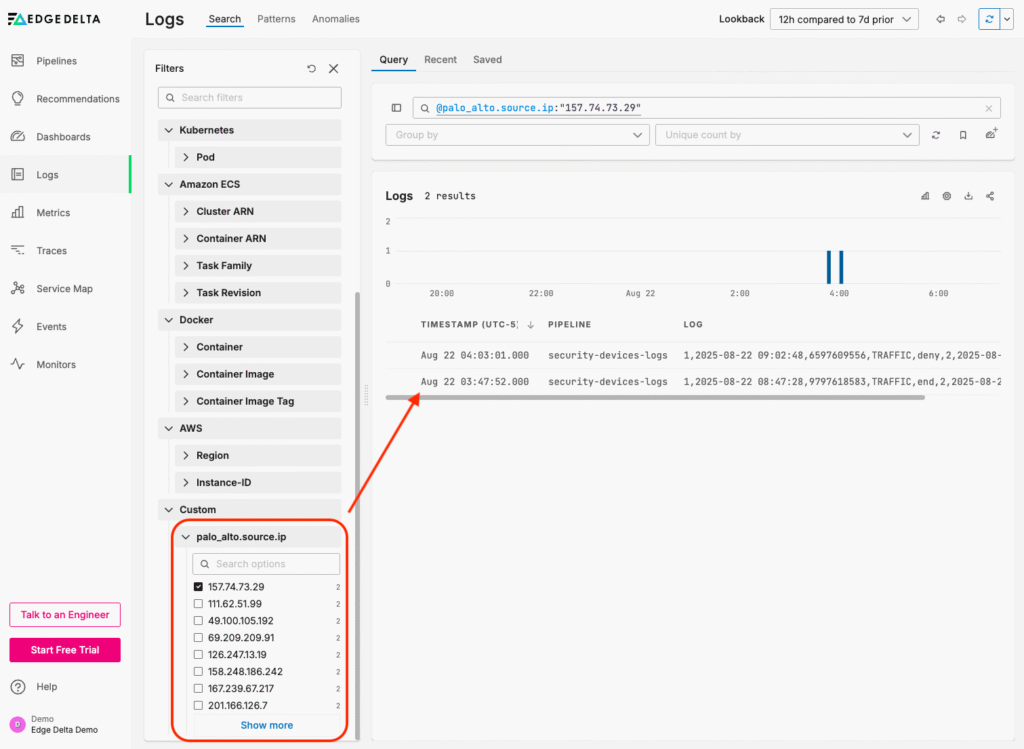
Once the facet filter is created, it will appear under the “Custom” section at the bottom of the “Filter” tab. From here, we can easily use it to filter through logs by their associated IP address:
Conclusion
As observability data volumes continue to grow, traditional search methods are struggling to keep up. Facets provide a powerful way to optimize queries by reducing the amount of data that needs to be evaluated, cutting down both query time and complexity.
With Edge Delta, teams gain an intuitive interface for creating and using facets during search. Our Telemetry Pipelines make it easier to structure incoming data and extract new fields as standalone facets, which leads to faster, more efficient queries in any downstream destination — including Edge Delta’s own Observability Platform.
To explore facet-powered log search for yourself, check out our free, interactive Playground environment, or start a free trial.


