


Continuous integration (CI) and continuous delivery/deployment (CD) are essential practices in modern software development which focus on strengthening the software development cycle. Continuous integration (CI) is the frequent and dependable deployment of incremental code changes, whereas continuous delivery/deployment (CD) is the process of integrating, testing, and delivering those changes. More specifically, continuous delivery doesn’t push anything to production, while continuous deployment automatically releases these changes directly into the production environment.
CI/CD pipelines can become very complex, with a number of different moving parts. Monitoring helps ensure CI/CD performance and reliability. With added visibility into your CI/CD pipeline, you can ensure greater production environment consistency, detect issues far easier, and gain general insights into the build and deployment process.
CI/CD monitoring plays a crucial role in:
- Automated testing and deployment through early failure detection
- Assurance of code quality
- Process optimization for seamless deployment
- Post-deployment system health maintenance for prompt issue resolution in production
This article will explore CI/CD monitoring, associated tools like Datadog and Grafana, and best practices for ensuring effective software delivery.
Key Takeaways
Continuous Integration (CI) and Continuous Delivery/Deployment (CD) are key techniques used in modern software development.
CI/CD pipeline reliability and performance can be greatly improved through monitoring, which promotes early issue detection and offers insights into the build and deployment process.
Teams can improve the software delivery process by using well-known CI/CD monitoring tools like Datadog and Grafana.
Clear KPIs, automation, frequent reviews, and teamwork are all essential parts of effective CI/CD monitoring.
CI/CD Monitoring: How Does It Work?
The CI/CD process begins with developers committing code changes to a version control system. The CI server then initiates a build process involving code compilation, unit testing, and artifact creation. When a build becomes successful, automated tests are triggered to ensure functionality. After this comes:
- Integration into the main branch
- Staging deployment
- Manual approval for production
- Ongoing performance monitoring
Key Components of CI/CD Monitoring
Effective CI/CD monitoring guarantees dependable and seamless integration and deployment operations by focusing on a few essential elements. The following are the main components required for thorough CI/CD monitoring:
Pipeline Visibility
Pipeline visibility enables teams to monitor changes throughout the CI/CD process. This transparency ensures effective tracking and management from code commit through build, test, and deployment stages. Observability tools help find bottlenecks and inefficiencies by providing information at each stage of the pipeline.
Real-time Alerts and Notifications
Real-time alerts and notifications play a crucial role in CI/CD monitoring by offering immediate feedback on current pipeline status. This capability allows teams to quickly address any issues, minimizing downtime and ensuring a smooth deployment process.
Integration with Other Tools
Seamless integration with existing tools such as deployment tools, testing frameworks, and Source Control Management (SCM) systems is essential for efficient CI/CD monitoring. This ensures full control and visibility over the pipeline and a smooth flow of data and processes.
Historical Data and Trend Analysis
Analyzing historical data offers valuable insights into CI/CD pipeline performance over time. By recording past deployments, successes, and failures, teams can identify performance trends, pinpoint recurring issues, and measure progress against benchmarks. Utilizing this data enables early issue detection through trend analysis.
Below are the best practices for effective CI/CD monitoring.
Best Practices for Effective CI/CD Monitoring
Effective CI/CD monitoring is crucial for maintaining a reliable and efficient deployment pipeline. By implementing best practices, organizations can optimize performance, promptly detect and address issues, and maintain high standards.
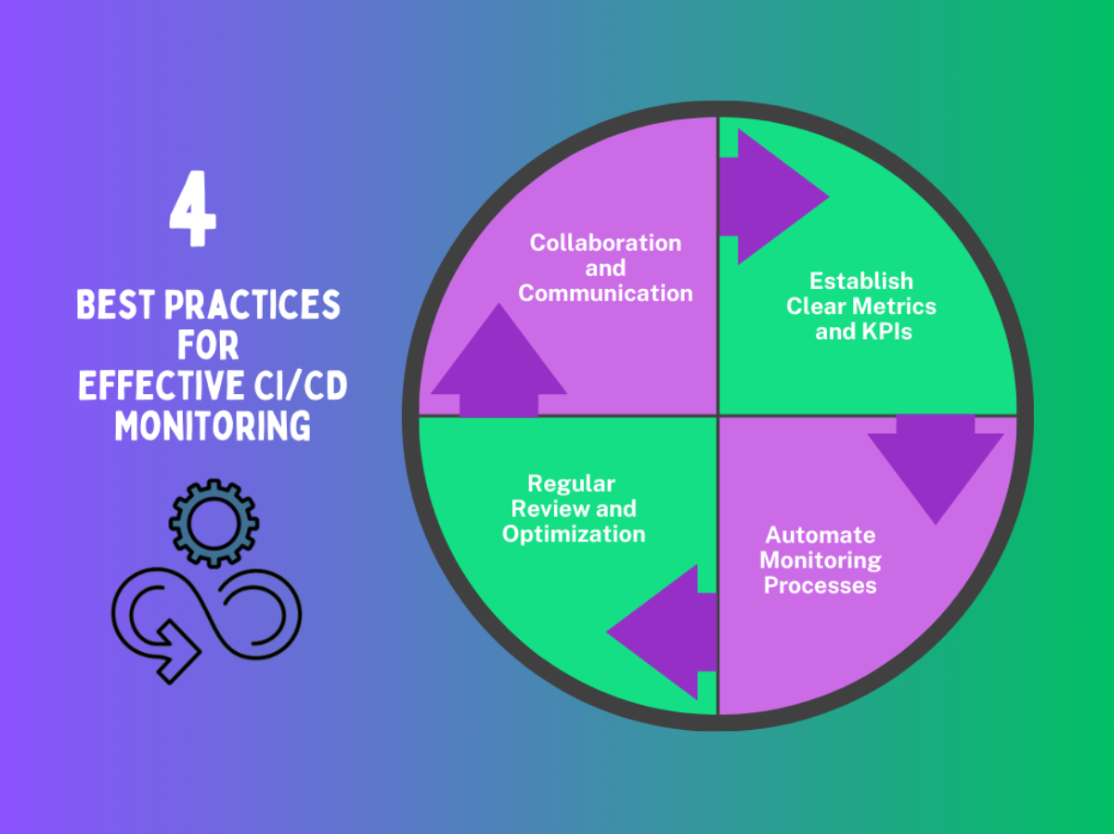
Below are the essential best practices for enhanced CI/CD monitoring:
Establish Clear Metrics and KPIs
For effective CI/CD monitoring, clear metrics and key performance indicators (KPIs) must be established. By clearly defining measurements and KPIs, teams can monitor the CI/CD pipeline’s success, pinpoint development areas, and spearhead ongoing optimization initiatives.
First, identify key metrics such as:
- build time
- frequency of deployments
- success and failure rates
- mean time to recovery (MTTR)
- code coverage
- lead time for deployments
- resource usage
Then, establish reasonable targets which align with business goals and industry norms.
Automate Monitoring Processes
Integrating reliable monitoring into your production environment is crucial while setting up your CI/CD pipeline. This guarantees early issue identification and facilitates proactive troubleshooting to preserve system performance and reliability. Automating CI/CD monitoring helps maintain dependable, effective, and goal-aligned development and deployment processes.
Teams can proactively monitor performance, identify problems early, and continuously enhance CI/CD pipelines using automated tools and techniques. Utilize monitoring platforms like Prometheus, Grafana, EdgeDelta, or Datadog to:
- Automate infrastructure with IaC tools
- Set up alerts or email
- Adopt event-driven monitoring for comprehensive CI/CD automation
Regular Review and Optimization
Regular feedback and review are necessary to confirm predicted results and validate the efficacy of automation techniques. This best practice allows for the discovery of errors, improvement of test scripts, and confident release of working code into production.
- Schedule a weekly or monthly assessment of key metrics to regularly review your CI/CD pipeline.
- Continuously improve pipeline components based on performance data and user feedback to achieve constant improvement.
- Maintain thorough records of pipeline setups and optimization techniques.
Collaboration and Communication
Ensure access to monitoring data by offering a consolidated dashboard with role-based access control and customizable displays for various stakeholders. Promote a transparent and accountable culture through:
- frequent reporting
- open channels of communication
- post-event evaluations to exchange knowledge and lessons
Establishing a collaborative team culture is just as essential to the success of a CI/CD workflow as choosing the appropriate procedures and resources. Developing a culture of open communication and shared responsibility among team members improves the versatility and efficacy of software update delivery.
The following section will cover some of the best CI/CD monitoring tools widely used in the industry.
Pro Tip on CI/CD Pipeline Implementation
When implementing CI/CD pipelines, prioritize automated tests, maintain stable build environments, run faster tests first for more efficient testing, and ensure all code passes through the pipeline before deployment.
Top CI/CD Monitoring Tools in 2024
CI/CD tools automate development, deployment, and testing procedures. While some manage development and deployment, others specialize in continuous testing and related tasks and specialize in continuous integration. By streamlining the software development lifecycle, these tools guarantee more frequent and reliable software updates.
Below is a quick view table comparing the key features and unique selling points of CI/CD monitoring tools.
| CI/CD Monitoring Tool | Key Features | Unique Value Proposition |
|---|---|---|
| Datadog | Real-time monitoring, performance insights, extensive integration | Comprehensive real-time insights |
| New Relic | Alerts and notifications, integration with DevOps, systems, deployment analysis | Detailed deployment reports |
| Edge Delta | Alerts and notifications, Kubernetes native support, automated observability, flexible pipelines and integrations | Automated observability and observability pipeline all-in-one solution |
| Splunk | Real-time visibility, pipeline monitoring, DevOps development | Deep data analysis |
| Prometheus | Metrics collection, notifications and alerting, scalability and reliability | Robust alerting system |
| Grafana | Integration with CI/CD tech, customizable dashboards, real-time monitoring | Rich visualization options |
| Jenkins | Monitoring alerts, simplified deployment, automated testing | Robust automation features |
Datadog: CI Visibility and Pipeline Performance Monitoring
Datadog’s integration with key CI technologies provides real-time monitoring and observability across CI/CD pipelines. The CI/CD features of Datadog offer insights into the performance of the CI pipeline, facilitating the detection of problems such as high mistake rates or unstable tests and enhancing the efficiency and dependability of CI workflows.
Key Features:
Real-time Monitoring: You can instantly track the progress of builds and deploys using Datadog’s real-time insights into your CI/CD operations. This feature ensures that issues, including build errors or performance snags, are quickly found and fixed.
Performance Insights: This feature monitors network traffic, CPU and memory usage, and other metrics during builds and deployments. By analyzing these metrics, teams can find performance bottlenecks, maximize resource usage, and raise the general effectiveness of CI/CD operations.
Extensive Integration: GitLab and GitHub Actions are just two examples of the popular CI/CD tools with which Datadog integrates. This integration enhances pipeline visibility by aggregating data into a single dashboard. From code commits to deployment, teams can effortlessly monitor metrics at every pipeline stage, guaranteeing transparency and promoting cooperation among departments.
New Relic: Full-Stack Observability with CI/CD Integrations
New Relic offers comprehensive observability tools to monitor and optimize the entire software development lifecycle. By integrating with CI/CD systems, New Relic offers visibility into application health and performance during the deployment process.
Key Features:
Alerts and Notifications: To guarantee prompt issue detection, users can configure alerts depending on deployment status, performance criteria, and other data important to CI/CD workflows.
Integration with DevOps Systems: Jenkins, Travis CI, CircleCI, and other popular CI/CD systems are integrated with New Relic to enable automatic monitoring and reporting within existing workflows.
Deployment Analysis: New Relic assists teams in making data-driven decisions for ongoing development by offering insights and reports on deployment frequency, success rates, and performance impact.
Edge Delta: Automated Observability and Analytics for CI/CD
Edge Delta offers a distributed approach to observability, leveraging stream processing to analyze data at its source. Its Kubernetes-native architecture provides automated observability for complex systems, with robust alerting and extensive integration capabilities. Edge Delta’s automated analysis helps DevOps teams optimize CI/CD processes, improving deployment speed and reliability while seamlessly connecting with existing tools and workflows.
Key Features:
Kubernetes Native: Designed specifically for Kubernetes environments, Edge Delta seamlessly integrates with container orchestration, providing deep visibility into cluster health and performance. This native support ensures efficient monitoring of dynamic, containerized workloads.
Alerts and Notifications: Edge Delta provides real-time alerting and intelligent notifications, enabling teams to quickly identify and respond to issues in their CI/CD pipelines. Its customizable alert system helps prioritize critical events and reduce alert fatigue.
Automated Observability: Edge Delta automates the collection, analysis, and correlation of observability data across the entire CI/CD pipeline, as well as the applications being run. This approach reduces manual effort, accelerates issue detection, and provides actionable insights without extensive configuration.
Splunk: Real-Time Monitoring and Analytics for CI/CD
Splunk excels in data analysis across the development lifecycle for increased visibility and provides deep insights into application and infrastructure performance. The Splunk platform is an ideal option for DevOps teams looking to improve application delivery speed, quality, and business value. It ensures effective handling of frequent code modifications by continuously monitoring CI/CD pipelines, which promotes agile practices.
Key Features:
Real-time Visibility: Throughout the whole development lifecycle, Splunk’s real-time monitoring features deliver prompt feedback. This feature delivers immediate feedback, guaranteeing the prompt identification and fixing of issues. Teams may maintain high responsiveness and reliability in their CI/CD processes with the help of real-time visibility.
Pipeline Monitoring: With its extensive analytics tools, Splunk offers detailed insights into how well CI/CD pipelines operate. These insights help teams discover bottlenecks and improve build times and overall productivity, enabling them to continuously enhance their operations.
DevOps Development: Splunk is designed to facilitate agile and effective application delivery for DevOps teams. Offering resources for pipeline optimization, troubleshooting, and monitoring simplifies collaboration between operations and development.
Prometheus: An Open-Source Monitoring and Alerting Toolkit
Prometheus is a scalable and dependable open-source toolset for monitoring and alerting. It has powerful query capabilities and interacts seamlessly with Kubernetes. Prometheus is made to track and gather data in real-time from various services and systems.
Key Features:
Metrics Collection: Prometheus can scrape metrics from CI/CD tools such as Kubernetes, Docker, and Jenkins. This tool supports several exporters and integrations to collect information on construction status, duration, success rates, and resource usage.
Notifications and Alerting: It provides an integrated alerting system that runs on parameters set with PromQL queries. Teams can set up alerts for resource limitations, performance deterioration, and CI/CD pipeline issues.
Scalability and Reliability: Prometheus’s extremely scalable and reliable architecture allows it to handle massive volumes of metrics from distributed systems. It facilitates federation and horizontal scaling for global monitoring across several clusters or data centers.
Grafana: Visualization and Dashboard Tool for Metrics
Grafana is an open-source analytics and monitoring platform that is often utilized in conjunction with Prometheus. Its ability to integrate with multiple data sources makes it an effective tool for tracking and evaluating metrics related to CI/CD processes.
Key Features:
Integration with CI/CD Technologies: Grafana supports integration with popular CI/CD tools, allowing users to extract information directly to monitor build statuses, deployment metrics, and pipeline performance.
Customizable Dashboards: This open-source tool offers an extensive collection of visualizations and enables customization to show relevant metrics and KPIs. It is popular for its capacity to aggregate and display data from various sources into visually appealing dashboards.
Real-time Monitoring: Grafana allows users to track the progress of continuous integration and distribution pipelines in real-time as events occur. Teams can identify issues promptly and take immediate corrective action due to this real-time visibility.
Jenkins: An Open-Source Powerhouse for Monitoring
Jenkins is a well-known open-source automation server that originated with the Hudson project. It streamlines continuous integration and delivery (CI/CD) to make software development processes more efficient and high-quality.
Key Features:
Monitoring and Alerting: Two essential components of Jenkins’ functioning are real-time monitoring and alerting. Jenkins monitors the health of CI/CD pipelines and sends out alarms immediately when issues arise.
Simplified Deployment: Jenkins offers strong support for deploying applications across several environments, streamlining the deployment procedure. Teams may define and automate deployment pipelines with its easy integration with platforms and tools for deployment.
Automated Testing: Jenkins’ ability to automate testing as a component of the CI/CD pipeline is one of its key benefits. This automation improves overall code quality and reliability by accelerating the feedback loop and enabling developers to detect and fix issues early in the development cycle.
Conclusion
CI/CD is an effective method which helps ensure the success of software development, by providing a framework within which to create, test, and deploy new code to production. Organizations can use it to quickly identify problems, streamline processes, and produce high-quality software. Teams should also adopt efficient CI/CD monitoring to continuously improve software development processes, boost dependability, and expedite delivery, and optimize this process of pushing production-grade code.
FAQs on CI/CD Monitoring
What is CI/CD monitoring?
Continuous integration/continuous delivery (CI/CD) is a set of procedures for helping software development teams consistently and reliably deliver code changes.
What is the best CI/CD tool?
The needs and preferences of the DevOp teams will determine which CI/CD tools are best; popular ones include CircleCI, GitLab, and Jenkins.
How do you keep up with CI/CD best practices?
There are a number of important best practices, some of which are:
- Make regular code commits
- Ensure pre-production environments don’t exist beyond their necessary lifecycle
- Balance both test coverage and performance, to ensure code is optimally reviewed
- Continue to automate the code integration process

