Historically, it has been difficult for DevOps and SRE teams to understand the behavior of, and quickly detect issues within, individual Kubernetes components. Traditional observability tooling requires teams to be extremely conscious of what they’d like to alert on and then set up monitoring logic at a granular level.
For example, teams running a Kubernetes environment might pick the namespaces they’d like to monitor. Then, determine the conditions they’d like to alert on, and then baseline the datasets. The sheer amount of time this takes to set up can be prohibitive for some teams – maybe they only have time to configure logic for a handful of namespaces. Plus, it puts the burden on teams to account for every behavior upfront and/or refine configurations after deployment – “I didn’t think to alert on that.”
Edge Delta is solving these challenges with a new feature, Source-Level Patterns. This feature builds upon our existing Pattern Analytics functionality. However, instead of baselining and analyzing datasets at the cluster level, you can now do so by more granular objects, such as Kubernetes namespaces, containers, or pods. This feature supports all datasets and will be especially relevant for Kubernetes environments. Let’s take a look at how it works.
How Source-Level Patterns Work
Within the Patterns screen, you can apply a Pattern Skyline job. Doing so will baseline a given dataset, display the different patterns (and negative patterns) occurring, and the volume of each pattern over time. Pattern Skyline jobs make it easy for you to spot issues (shown by significant changes in behavior), as well as the duration they have occurred. With Source-Level Patterns, you can run Pattern Skylines by the following objects:
- Namespace
- Controller Name
- Contoller Kind
- Container Name
- Container Image
- Pod Name
Applying Pattern Skylines at the source-level provides two primary benefits. First, you are baselining sources against themselves, meaning the most relevant dataset. As a result, you can quickly detect meaningful changes in behavior. Second, isolating datasets at the source level makes it easy to determine exactly what object an issue is occurring within – you can see the exact namespace or container. And you can get these insights without manually building logic to account for each individual object.
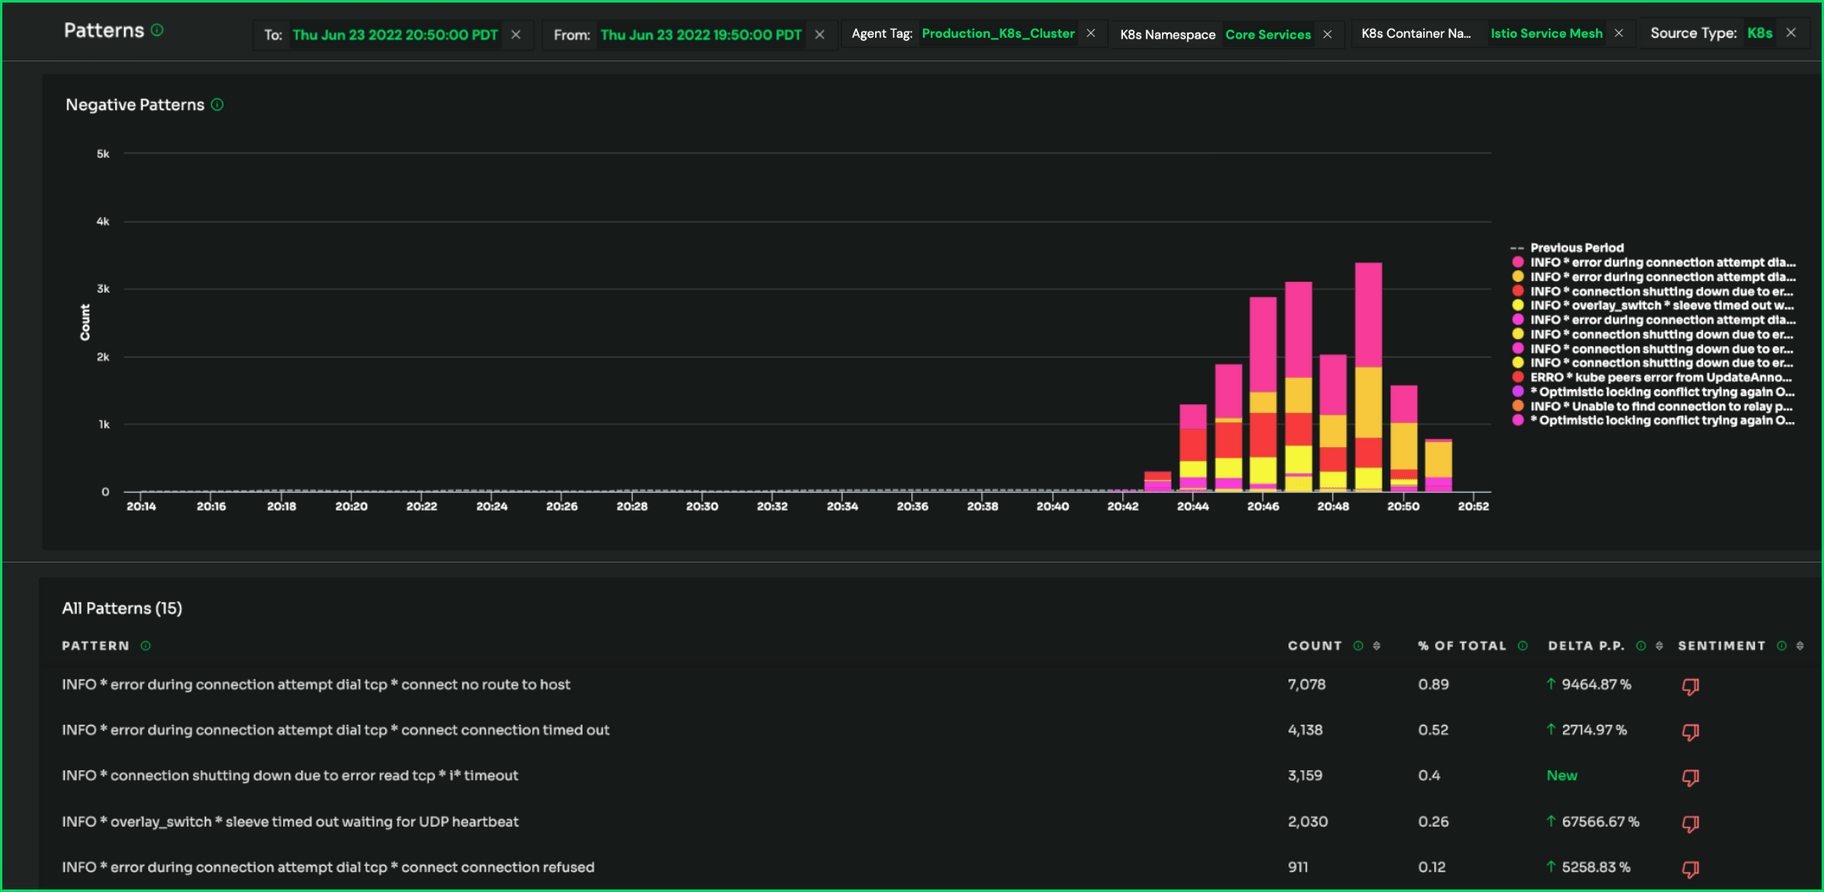
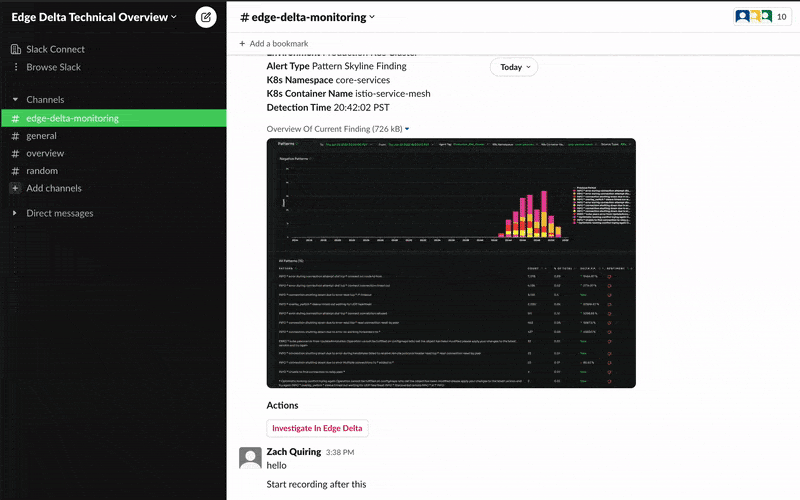
You can view these analytics from within the Edge Delta Patterns screen, or you can use these patterns to power dashboards in downstream systems, like Datadog, Splunk, or Sumo Logic. When Edge Delta detects anomalous behavior, it will trigger an alert within your preferred tooling. The alert communicates the impacted namespace and container, so you know exactly what components need attention. It will also create Findings Report – an email that will display the affected object (e.g., namespace, container) as well as the relevant data. Lastly, all raw logs – before, during, and after the issue – will be automatically routed to your observability platform.
Getting Started with Source-Level Patterns
Source-Level Patterns are easy to set up. Simply create a new Skyline Pattern from within the Patterns screen. Within the modal, select which object you’d like to group by. And that’s it – patterns will begin running at the object level. Plus, each time you add a new service, patterns will automatically be applied to it.
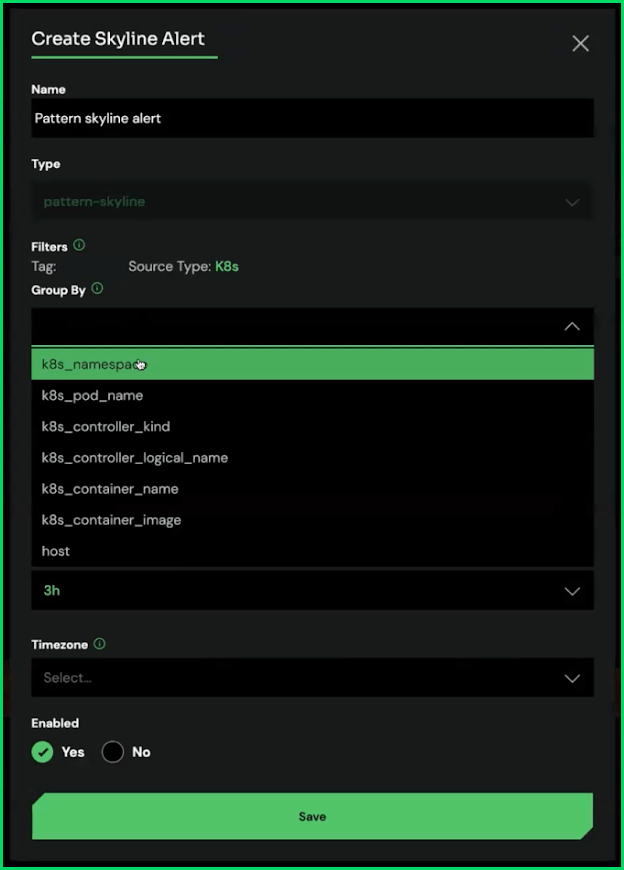
From here, you can also get more granular. For example, once you group patterns by namespace, you can also group by container within a given namespace. By default, Source-Level Patterns will be set up for Kubernetes environments.
Conclusion
Source-Level Patterns give DevOps and SRE teams a clear view into the behaviors of individual services or containers. With this level of visibility, debugging a microservices-based application can take a matter of minutes instead of hours or even days. To learn more about this feature, sign up for a demo today.


