

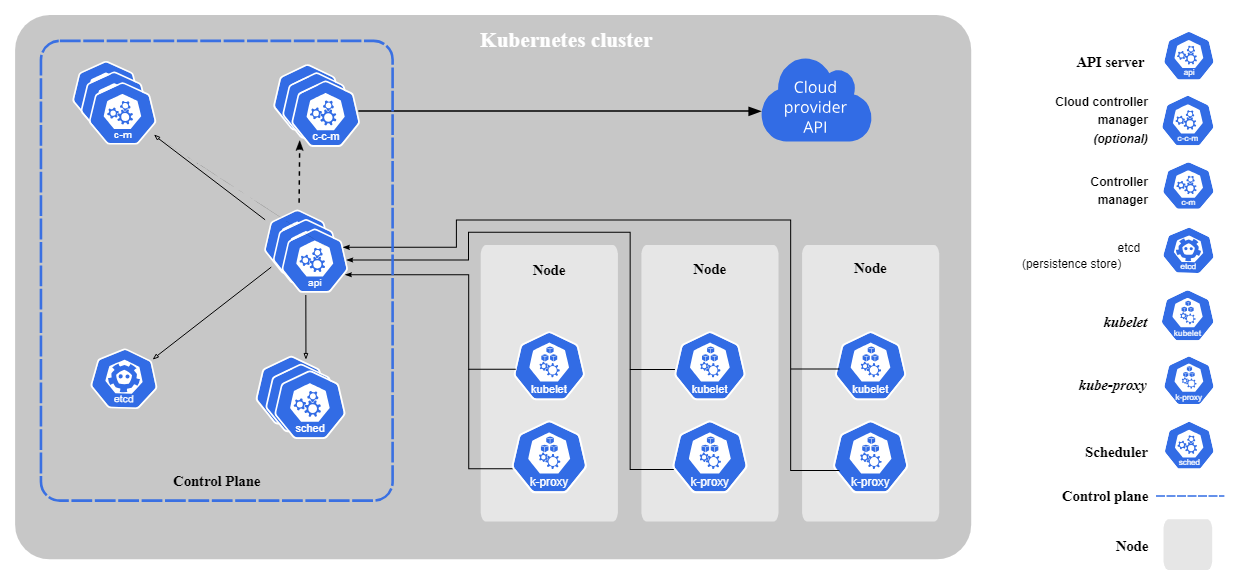
Kubernetes (sometimes referred to as k8s) is a fast-growing container orchestration platform. It helps companies automatically ship, scale, and manage containerized applications. When you’re running on Kubernetes, you might manage hundreds (sometimes thousands) of containers and pods. It’s critical to monitor logs and metrics emitted by these resources to ensure the optimal user experience and mitigate downtime.
If you’re just starting on Kubernetes, it is essential to know how to get started monitoring the platform. In this article, learn about Kubernetes monitoring and what you need to know about it.
Key Takeaways
- Observability and monitoring tools can help you ensure smooth operations, quick issue resolution, and efficient resource consumption.
- Cluster, node, deployment, pod, container, and application metrics are vital for understanding system health and performance.
- Challenges like scalability, metric overload, security, real-time updates, and complexity must be addressed for effective monitoring.
- Tools like Edge Delta, Kubernetes Dashboard, Prometheus, Sematext, EFK Stack, and Grafana Loki can be used to monitor Kubernetes workloads.
What is Kubernetes Monitoring, and Why Should You Use It?
Kubernetes monitoring involves collecting, analyzing, and visualizing telemetry to ensure the health and performance of different workloads. Monitoring this data can help you ensure that applications built on Kubernetes run smoothly and remain available.
By monitoring Kubernetes resources, organizations also gain observability in their clusters. This visibility can be inform resource management, performance optimization, scaling, and issue detection and resolution.
Here are some of the reasons why organizations should monitor their Kubernetes metrics:
- Monitors nodes, pods, and services to enable smooth operation.
- Quick identification and resolution of issues so downtime is minimized.
- It helps plan future capacity needs and ensures scalability.
- Strengthens overall security by detecting vulnerabilities and security issues.
- Provides insights into resource allocation to improve cluster and cost efficiency.
Kubernetes is self-healing in nature, meaning the system will automatically detect and attempt to rectify health issues. As a result, you may experience pod restarts, auto-scaling, and node recovery. Monitoring your Kubernetes resources allows you to understand when nodes crash, and resources are maxed out, so you can determine the root cause and prevent these issues in the future.
Infrastructure, DevOps, and developer teams collect metrics, events, logs, and traces (MELT) data for observability and monitoring. To implement real-time monitoring of Kubernetes, you can leverage metrics libraries, such as kubelet, cAdvisor, node-exporter, and Kube State Metrics (KSM) libraries. By doing so, you can expose, aggregate, and collect metrics to track health, performance, and resource utilization of clusters, nodes, pods, and other components. These metrics help organizations achieve the benefits above and use their resources efficiently.
In the next section, learn more about the key metrics monitoring K8s.
Good to Know!
Kubernetes monitoring often involves tracking “Pods,” the smallest deployable units in the Kubernetes ecosystem. Each Pod in Kubernetes has its unique IP address, making it a fundamental unit for monitoring and managing containerized applications.
What to Watch: Key Metrics to Monitor in K8s
There are various metrics involved in monitoring Kubernetes, but two of the most important metrics you should look at are cluster and pod metrics.
Cluster and Node Metrics
Cluster metrics provide insight into the behavior of an overall Kubernetes cluster, while node metrics help you monitor individual nodes within the cluster. By tracking node metrics, you can understand the number of nodes available, disk and memory utilization, network bandwidth, and running pods.
Common cluster health and node performance metrics to look at:
- The count of containers actively running
- Latency and error rate of Guage API
- CPU and memory usage on individual nodes
- Network throughput per node
- Disk usage and I/O operations
- Node uptime and availability
It is also possible to break down cluster metrics on a node-by-node basis so users can identify specific nodes running short of CPU or memory.
Deployment and Pod Metrics
Pod-level and deployment monitoring involves reviewing the metrics from containers, applications, pod health, crash loops, and resource usage.
Here are some of the essential metrics to monitor:
- The number of available replicas
- The desired replicas based on deployment configuration
- Deployment progress
- CPU and memory usage at the pod level
- Container restarts
- Pod status
Pod state is also another thing to watch when monitoring Kubernetes. While pod state is not a metric type, it can help the user understand pod behavior, which can then be correlated with pod metrics to gain more context on issues.
Container Metrics
These metrics help monitor individual containers. This can help determine users’ proximity to their resource limits and allow them to detect pods in a CrashLoopBackoff. Container memory utilization and CPU usage are also some metrics that provide insight into the health of the containers.
Application Metrics
These metrics help measure the availability and performance of applications running inside the Kubernetes pods. These metrics depend on the business scope of the application, but the most common ones are latency, responsiveness, and uptime.
Remember!
A key metric you’ll want to monitor for pods is CPU usage because, as we saw above, CPU limits can restrict how much CPU resources are available for each pod.
How to Monitor Kubernetes: Best Practices to Follow
A consistent monitoring strategy across the infrastructure ensures standardized metric collection and a reliable assessment of the state of the Kubernetes clusters.
The following are some of the best practices to implement in Kubernetes monitoring:
Utilizing DaemonSets for Data Collection
This approach involves utilizing log and metric-collection software, typically called an agent, deployed as a pod known as a DaemonSet. DaemonSets guarantees that each node in the cluster runs an instance of the DaemonSet pod. When nodes are terminated, the pod is also removed.
A DaemonSet allows for deploying an agent that monitors every node and all resources on each node throughout the Kubernetes cluster. Many monitoring systems utilize this approach to install their agent on each node. Subsequently, their agents gather and reveal metrics.
Detect Pods in Crash Loops
When pods start up, crash, start up again, and then crash again, this is called a crash loop. Several things can cause this, but one of the most common is a program inside the container crashing.
These crash loops can also happen if the pod is set up incorrectly or something goes wrong after a new pod is launched to Kubernetes. Having crash loop alerts can help businesses narrow the list of possible reasons and act quickly.
Monitor Job Failures
Kubernetes Jobs facilitates the execution of nodes for a designated duration and guarantees their deletion once their intended purpose is fulfilled. These Jobs frequently fail due to errors.
Whether these task failures occur due to the pods entering crash loops or the nodes rebooting, they must be reported immediately. Failures on the job can escalate into more substantial complications if disregarded; therefore, it is imperative to remain vigilant for them.
Leverage Service Auto Discovery
The company can see all services running in the Kubernetes cluster using Kubernetes Auto Discovery. This overview is essential for figuring out how healthy the cluster is.
Auto Discovery can monitor Kubernetes services and logs while keeping costs low and letting you see what’s happening with Kubernetes.
These best practices help build a solid monitoring base for a company’s Kubernetes groups, which speeds up the process of finding problems and managing resources well.
Companies that follow these best practices have many benefits, but keeping an eye on Kubernetes can be challenging.
Good to Know!
Edge Delta collects metrics using eBPF, meaning you don’t need to change application code to instrument metrics. From there, you can leverage our backend for visualization.
Challenges in Monitoring
Many challenges are involved in monitoring Kubernetes because of the platform’s distributed nature and dynamic environment. The following are some of the challenges users may encounter when monitoring K8s:
- Scalability: monitoring tools need help scaling with the platform, especially for organizations not used to handling large-scale data environments.
- Too many metrics: Kubernetes generates many metrics and can overwhelm existing monitoring tools.
- Security: Ensuring the protection of assets such as API tokens and sensitive files can be challenging because the platform has to monitor them.
- Real-time updates: Clusters in Kubernetes are constantly changing, so monitoring them in real time is important.
- Complexity: It can be complicated to monitor and understand the platform because of the amount of moving parts.
While there are a lot of challenges in monitoring, businesses can turn to different monitoring tools designed explicitly for Kubernetes monitoring.
In the next section, learn about the different Kubernetes monitoring tools in the market.
Monitoring Kubernetes with Edge Delta & Other Tools
Effective monitoring is crucial in ensuring the optimal performance and health of Kubernetes clusters. Various tools, such as Edge Delta’s Kubernetes monitoring platform, cater to different aspects of this task.
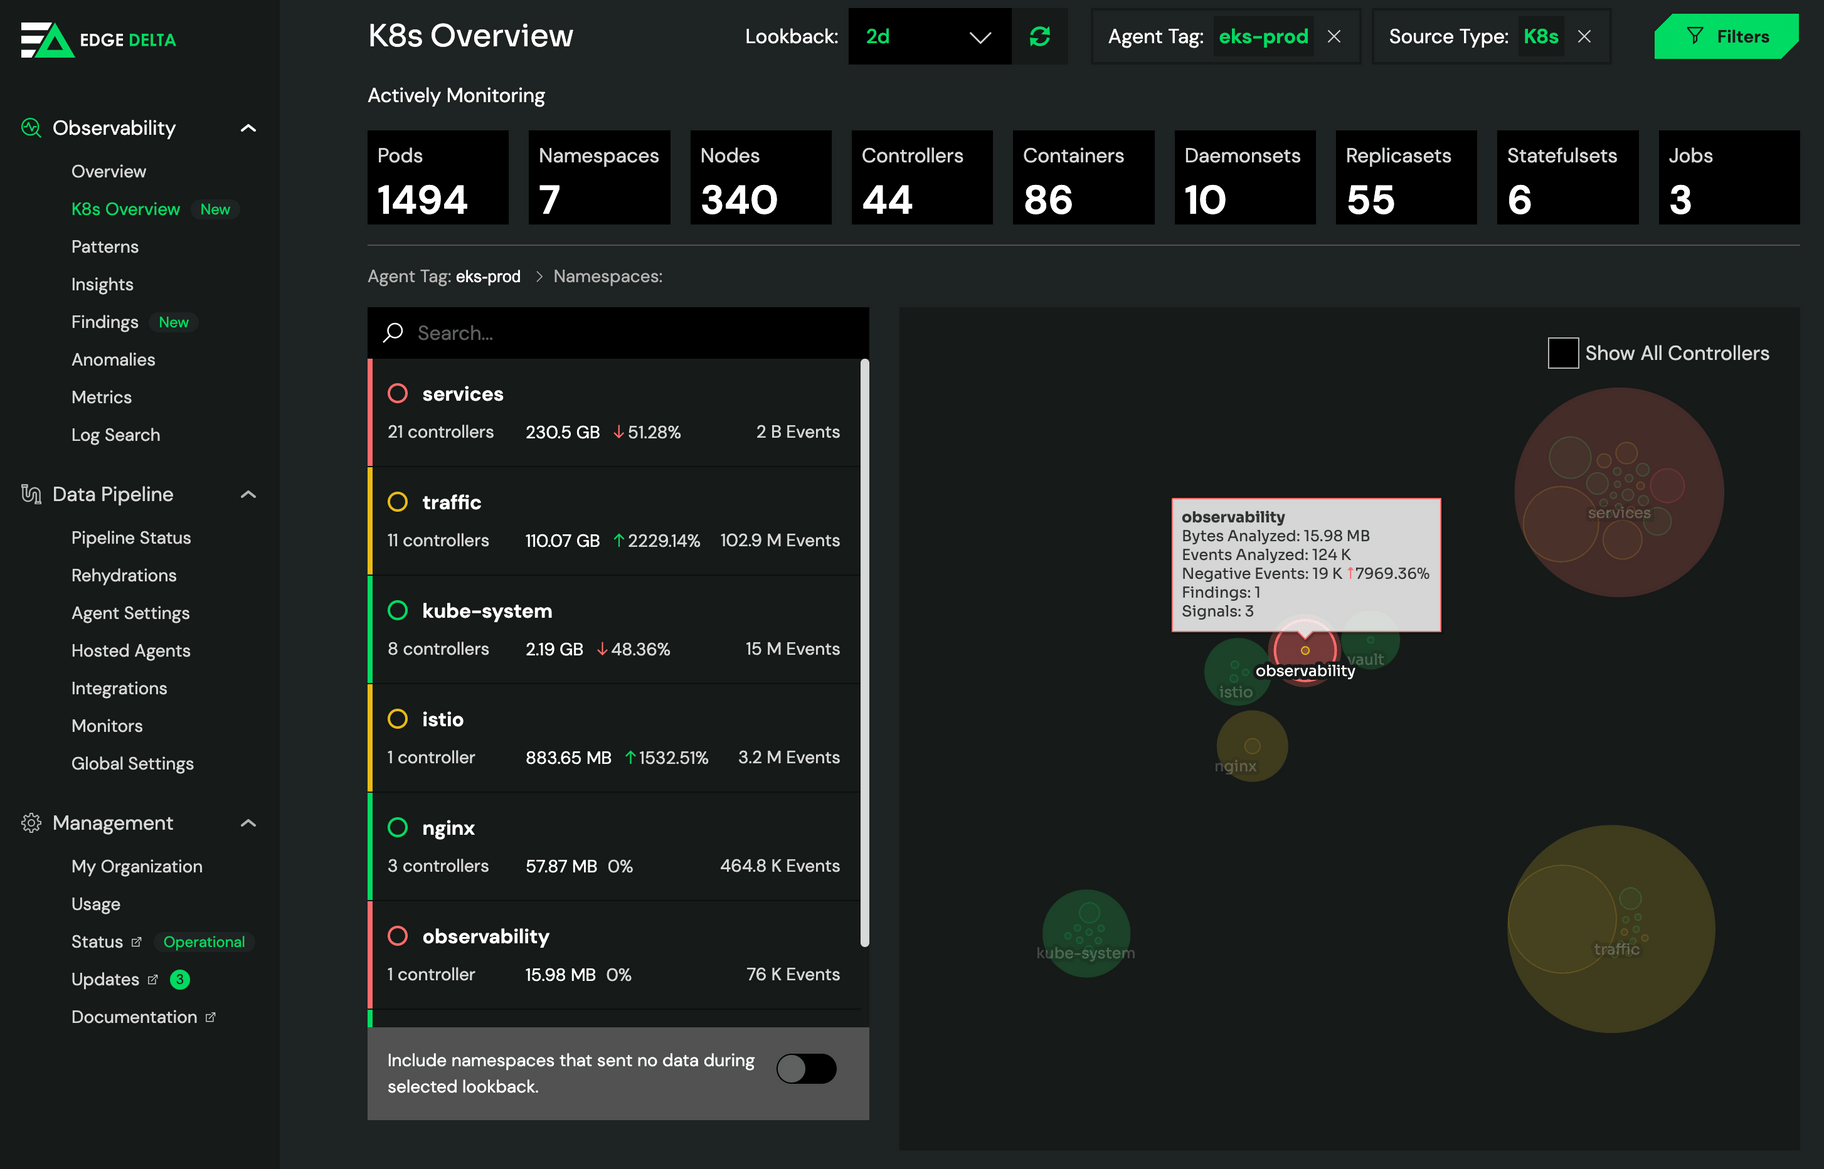
Edge Delta delivers the easiest Kubernetes monitoring experience by offering features such as:
- Automated alerts
- Pre-built dashboards
- Single-pane view of different environments
- Cost-effective data ingestion
- Easy-to-use metric collections
Monitoring and troubleshooting are easier with Edge Delta. The platform provides complete visibility across your Kubernetes resources and maps out every component. From there, you can gauge the health and volume of data each component is omitting. Edge Delta also collects “golden signals” and known metrics libraries using eBPF – meaning you can track your resources without changing the code for instrumentation. Edge Delta also automatically detects any anomalous behavior, so you can fire alerts without manually defining monitors.
One thing that makes Edge Delta stand out is its fast and affordable log search, which can handle large amounts of data. It has proven to be a powerful tool for making Kubernetes tracking easier and more cost-effective.
There are also other tools in the market for Kubernetes Monitoring. Some of the best ones are:
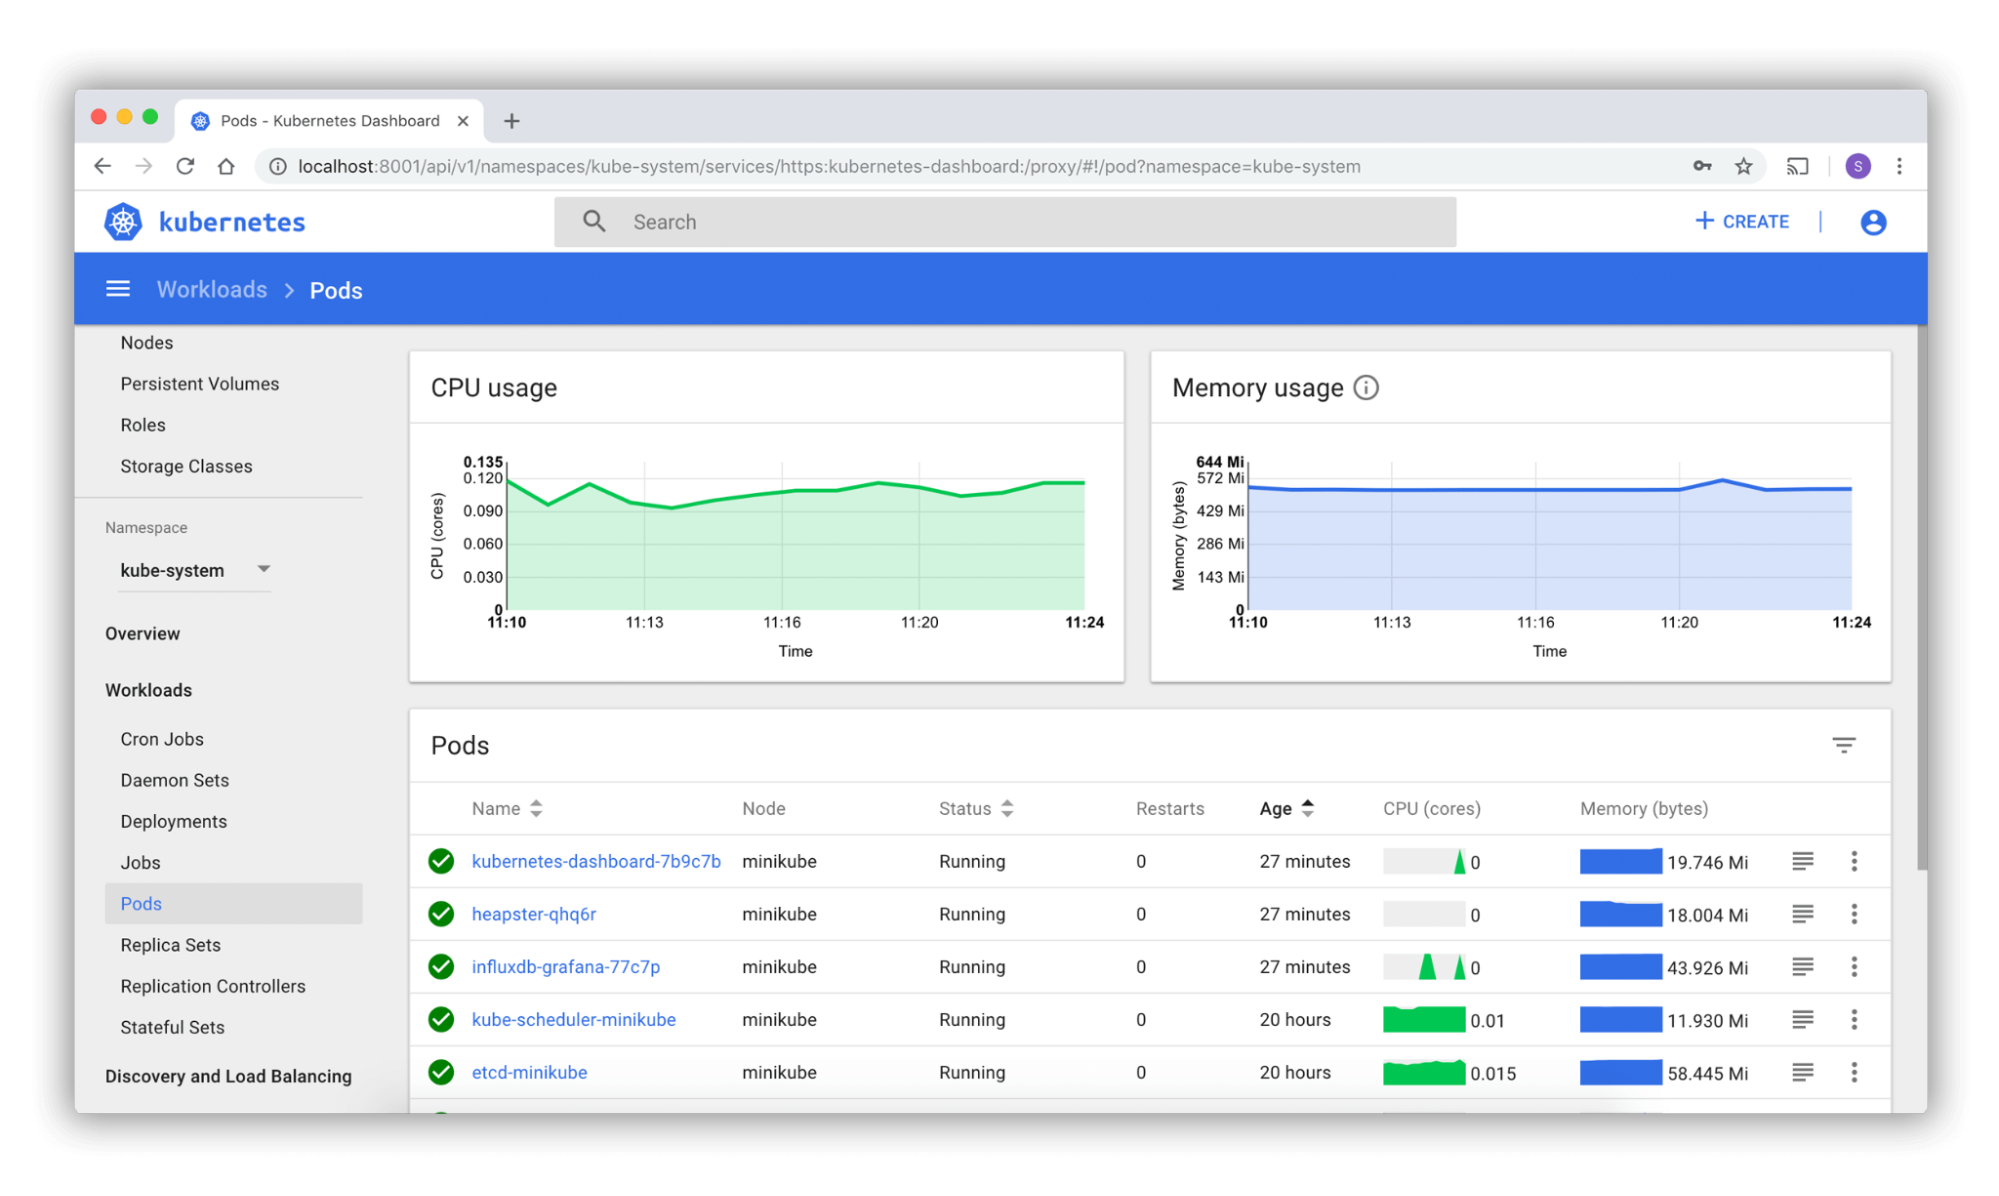
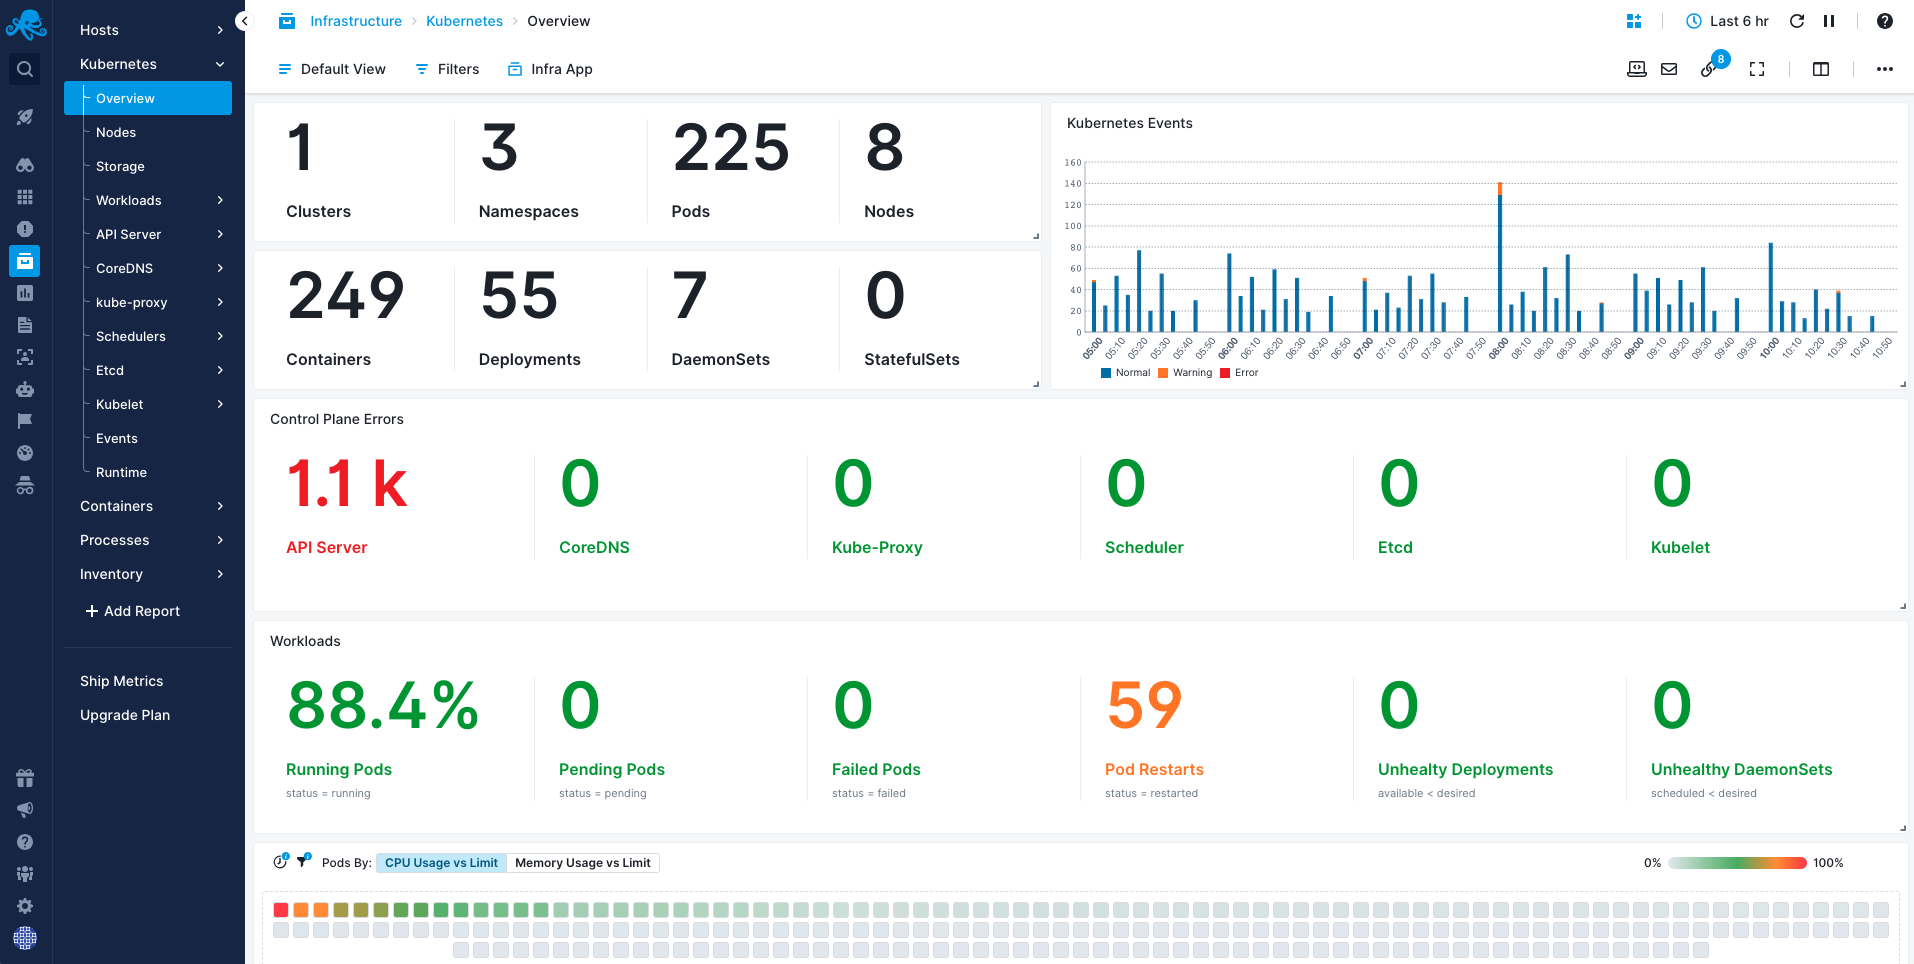
1. Kubernetes Dashboard
The Kubernetes dashboard is a web-based tool for monitoring Kubernetes. It lets you see important data from the pods and containers in your clusters. It is an important part of the Kubernetes environment and lets you see and control all of the tracking for a Kubernetes cluster.
Within your cluster, the dashboard shows information about pods, services, replication controls, and more. Real-time information about which nodes are running tubeless, how many CPUs are available, and how much memory each node uses.
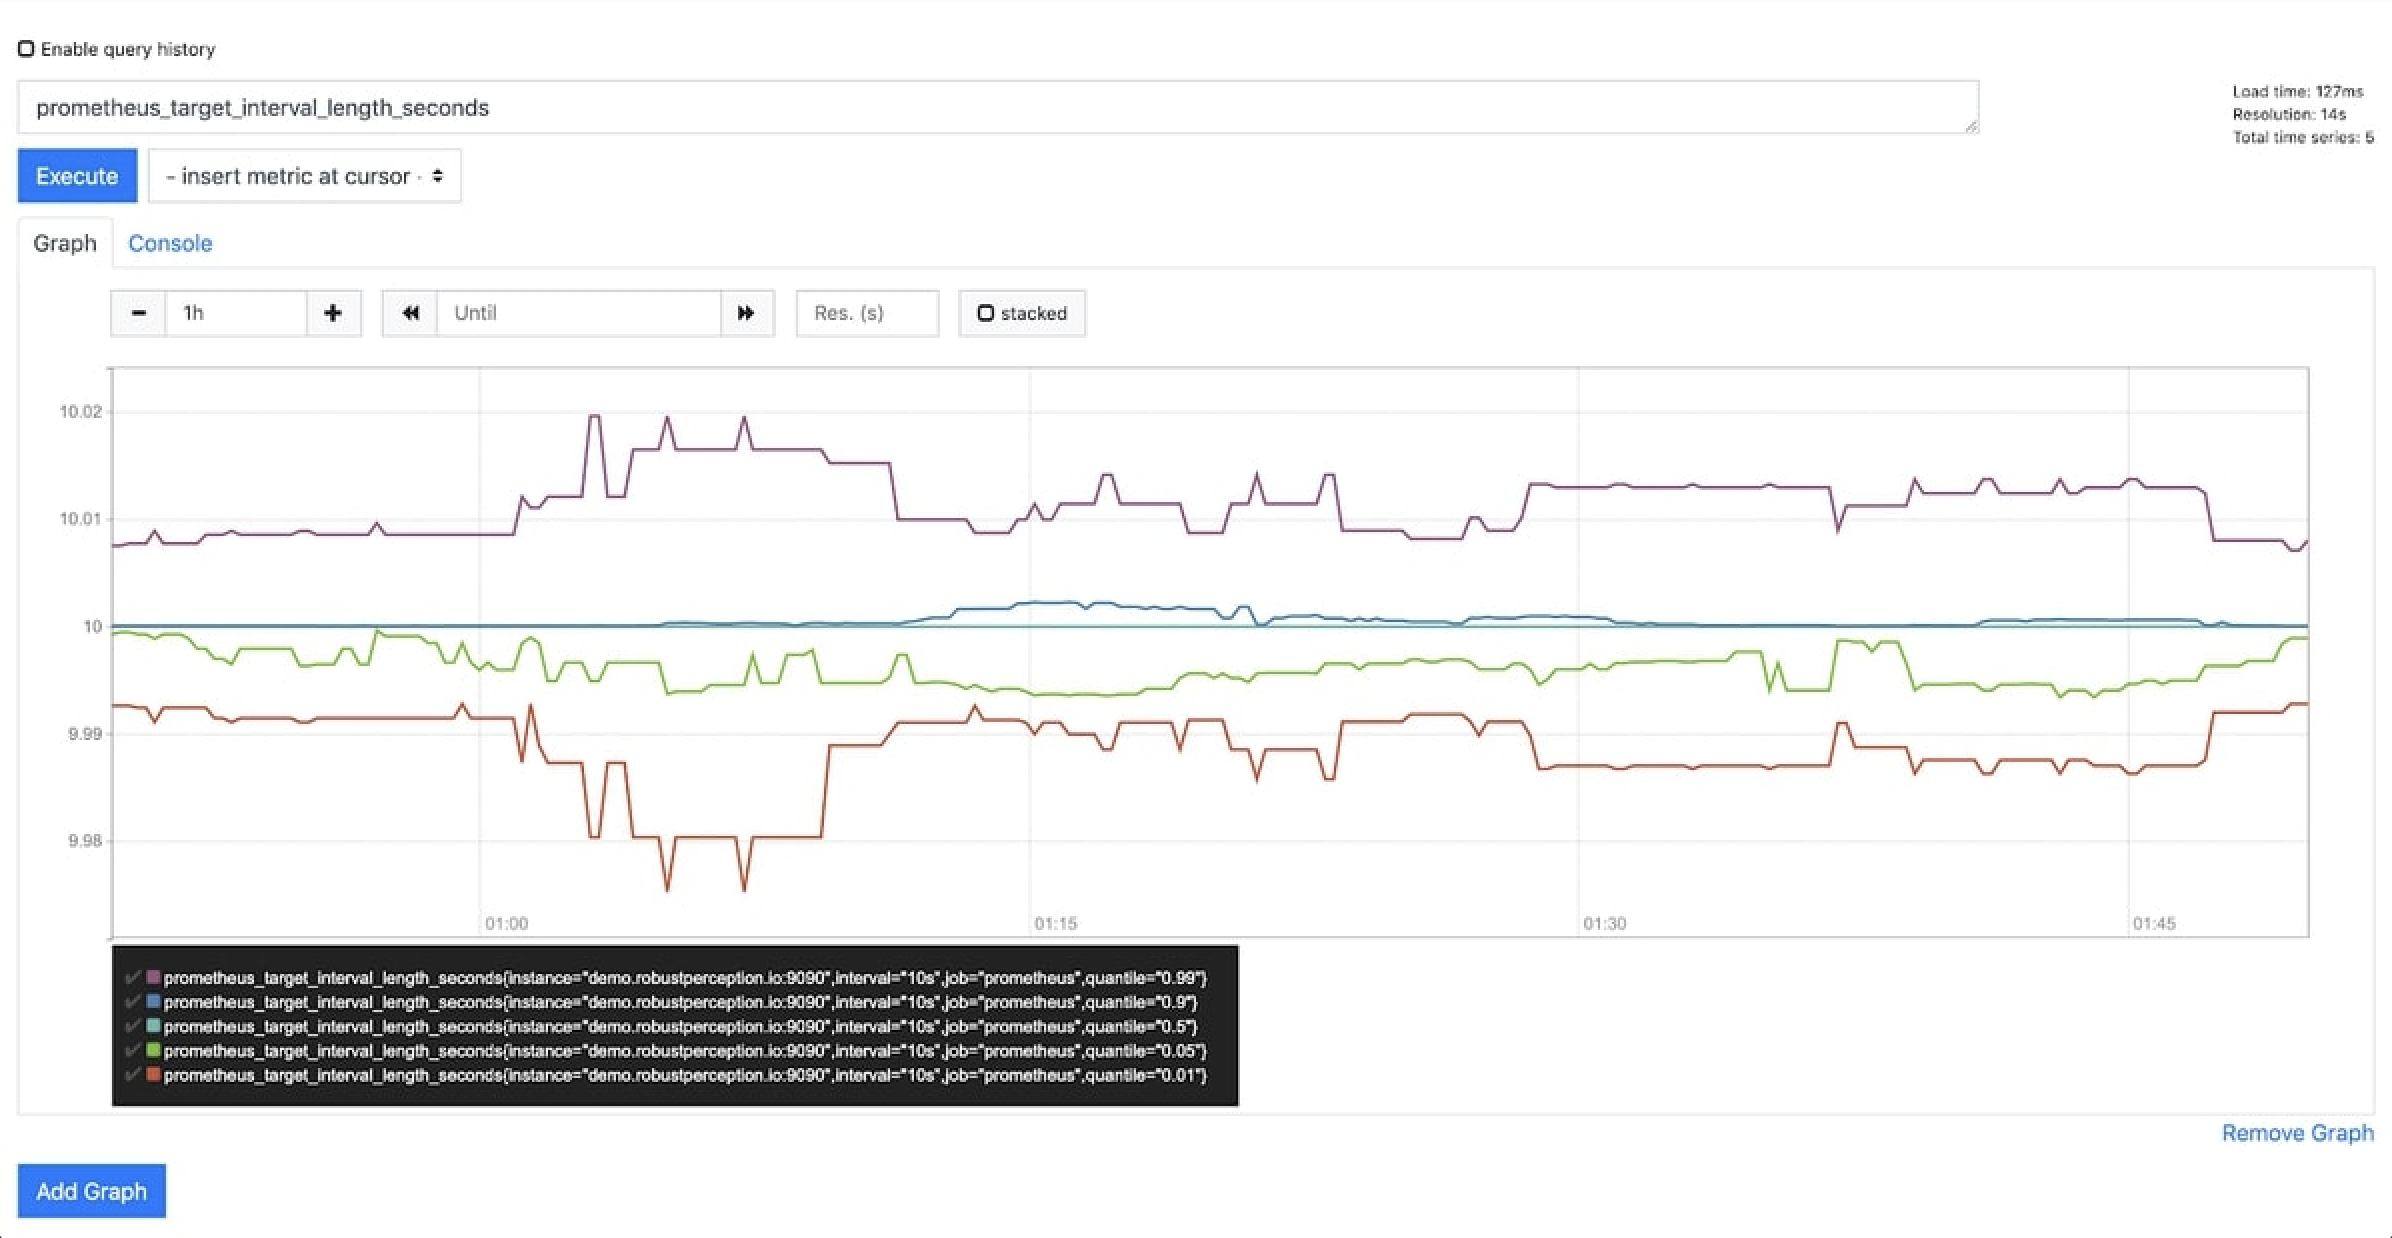
2. Prometheus
Prometheus provides two components: a backend to scrape and collect metrics, and a dashboard to visualize your data. It checks rule expressions, shows results, and can send alerts when true conditions are found. The easy-to-use interface gives you a big-picture view of all the metrics and individual metrics’ values over time and more information about them.
The system can pull data from other systems, like OpenTracing or StatsD/Graphite, and show data collected by Prometheus. This feature lets you add custom monitoring for parts of a program or third-party services like Google Stackdriver Logging or AWS CloudWatch Logs.
3. Sematext
Sematext provides Kubernetes Monitoring support with a comprehensive control plane. The viability of every Kubernetes resource is displayed on default dashboards.
Users are also provided with container and Kubernetes metrics, in addition to labels and categories, which are exposed in the user interface to enable further analysis and the creation of custom dashboards.
Additionally, logs and metrics can be correlated to facilitate root-cause analysis. Correlate the precise moment a metric surge occurs with error records from the same period.
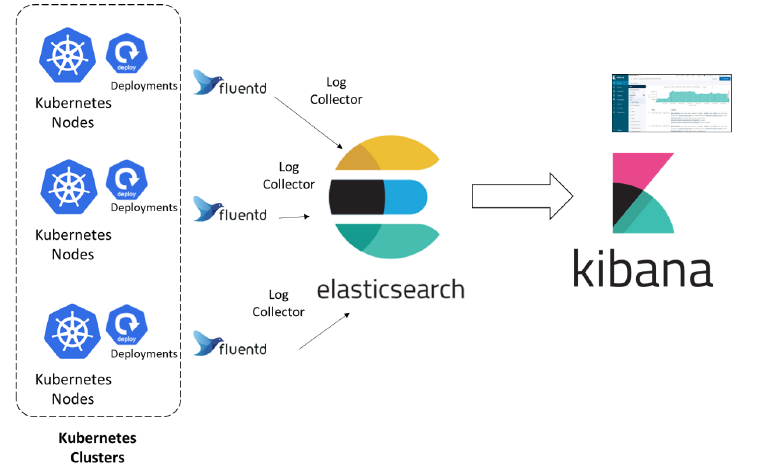
4. EFK Stack (Elasticsearch, Fluentd, Kibana)
EFK, which stands for Elasticsearch, Fluentd, and Kibana, is used by many to store, process, and display Kubernetes logs. Developers and system managers often use the EFK stack to determine how their applications and platforms work.
A distributed search and analytics engine called Elasticsearch is excellent at saving and organizing large amounts of data. Fluentd is a data collector that gets data from different places and sends it to Elasticsearch to be indexed. Kibana, a data visualization tool, lets people work with data saved in Elasticsearch by making their dashboards and visualizations.
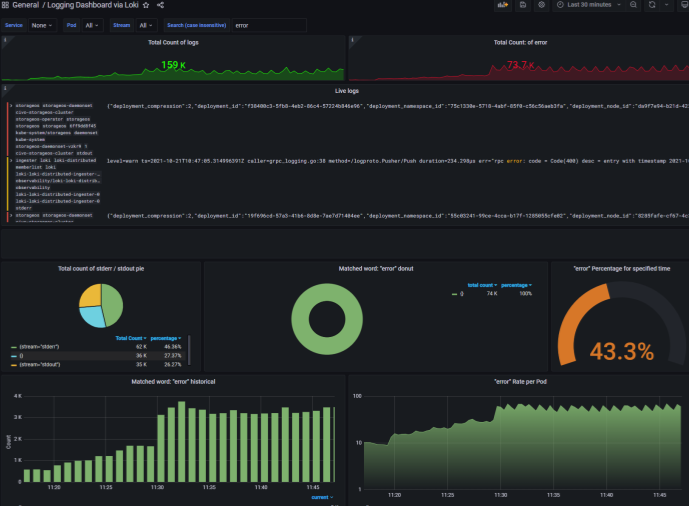
5. Grafana Loki
Grafana Loki is a method for collecting logs that can be used in tandem with your metrics. Frequently, users will visualize Prometheus metrics in Grafana and correlate with logs in Grafana Loki. It is a cost-effective, highly available, and widely scalable way to collect logs. Instead of storing the log data, it focuses on labels for each log stream.
Loki uses Promtail to collect all of its logs. Promtail is a special logs collector agent made for Loki. It renames logs and sends them to the Loki instance running on each Kubernetes node.
Loki adds its query language, LogQL, to make searching faster. LogQL can be used through Loki’s command-line tool or as an extension of Grafana.
Choosing the right mix of tracking tools is important to keep Kubernetes groups healthy and running well. Whether they use open-source frameworks or offer full-featured services, these tools are all part of a complete monitoring strategy that gives businesses the information they need to run clusters well.
Final Thoughts
Effective monitoring is crucial for the optimal performance of Kubernetes clusters. A well-rounded monitoring approach incorporates best practices and leverages tools that help organizations proactively manage their Kubernetes clusters.
FAQs About Kubernetes Monitoring
How do I monitor resource usage in Kubernetes?
There are multiple ways to monitor resource usage in Kubernetes. The best way is by using third-party tooling, like Edge Delta. You can also get snapshots of how pods or nodes in your Kubernetes cluster are using resources by using the Kubectl Top command. Kubernetes cluster owners should monitor how their resources are being used. You can monitor CPU, memory, and storage to see how resources are used.
How do I monitor Kubernetes pod memory usage?
You can track pod memory usage within Edge Delta out of the box – there’s no manual instrumentation required. You can also use the kubectl describe tool to learn more about the pod, such as how much memory it uses. Just change it to the name of the pod whose memory you want to check. This command will give you a complete account of the pod, including how much memory it is using.
What is Kubernetes best used for?
Kubernetes is primarily used for container orchestration. It excels in managing and scaling containerized applications across a cluster of machines. There is an orchestration tool in Docker called Docker Swarm, but most writers choose Kubernetes container automation instead.

