

AWS Lambda processes billions of executions every day, but troubleshooting issues at scale remains challenging without effective monitoring. Its ephemeral execution model, highly distributed architectures, and lack of persistent infrastructure create significant observability gaps.
AWS CloudWatch is often the default choice, but it isn’t free. CloudWatch Logs cost roughly $0.50 per GB, and high-volume Lambda workloads can quickly exceed $1,000 per month. While the free tier may cover small applications, production environments commonly incur $50–$5,000 or more in monthly monitoring costs.
This guide compares the leading Lambda monitoring solutions across native AWS services, enterprise platforms, serverless-focused tools, and open-source options. You’ll see how CloudWatch and X-Ray stack up against Datadog, New Relic, Lumigo, Prometheus, Grafana, and more — and where telemetry pipeline solutions like Edge Delta fit in.
Key Takeaways
• Lambda monitoring differs from server-based monitoring because functions are ephemeral, highly distributed, and execute in milliseconds without traditional host-level metrics, shaping how observability must be approached.
• CloudWatch and X-Ray are the primary native AWS tools, with most teams spending $50–$500 per month in typical production environments.
• The CloudWatch free tier includes 10 metrics, 10 alarms, 1 million API requests, and 5 GB of log ingestion—generally sufficient for roughly ten simple Lambda functions.
• CloudWatch Logs pricing shifted to a tiered model in May 2025, starting at $0.50 per GB and decreasing at higher ingestion volumes.
• Key Lambda metrics include invocations, errors, duration, throttles, concurrency, cold starts, and memory usage.
• CloudWatch Logs can exceed $1,000 per month at scale, so Lambda monitoring pricing should match workload size, budget, and operational needs.
Why Lambda Monitoring is Different
Monitoring AWS Lambda is challenging because functions run in a serverless, short-lived environment. There’s no underlying infrastructure to inspect and no direct access to the runtime. Each invocation is isolated, leaving teams dependent on logs, metrics, and traces to detect and diagnose issues.
Lambda workloads also span multiple AWS services, making log correlation slow and unreliable. Cold starts further complicate performance, often adding 100 milliseconds or more of latency—so effective monitoring must track both their frequency and their impact on users.
Cost visibility is also limited. Lambda pricing is based on:
- Invocation count
- Memory configuration
- Execution duration
A poorly optimized function can significantly increase Lambda costs. For example, a 1 GB function that runs 10 seconds can cost five times as much as a 512 MB function that runs 4 seconds.
Teams must monitor several key metrics to understand health, performance, and cost. The table below summarizes the most important ones and why they matter:
| Category | Key Metrics | Reason | Threshold |
|---|---|---|---|
| Invocations | Count, success, errors | Health | Error >1% |
| Performance | p50/p99, cold starts | Latency, cost | p99 >3s |
| Concurrency | Executions, throttles | Scaling | Any throttles |
| Errors | Timeouts, OOM | Reliability | Any |
| Cost | GB-seconds | Budget | >20% weekly rise |
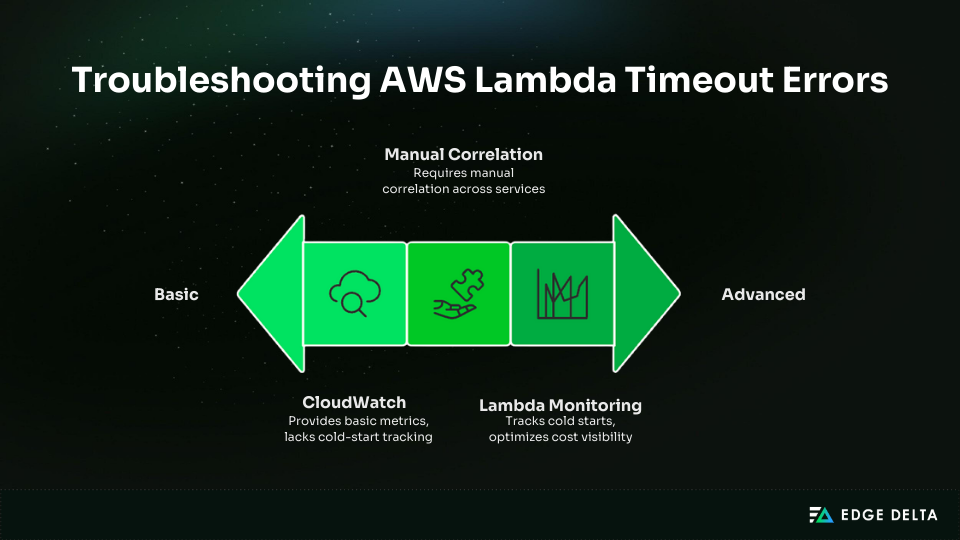
CloudWatch covers the fundamentals, but its limited visibility into cold starts and cross-service correlations often leads teams to explore additional native AWS tools for deeper, more complete monitoring.
Native AWS Monitoring Tools
Native AWS tools cover most Lambda monitoring needs for small and medium workloads. CloudWatch and X-Ray provide metrics, logs, tracing, dashboards, and alerting with minimal setup.
Knowing what they offer helps teams evaluate whether upgrading to third-party platforms is necessary.
1. Amazon CloudWatch (Metrics + Logs)
CloudWatch is the default monitoring service for Lambda. It automatically collects metrics, stores logs, and supports dashboards and alarms. It requires no additional setup and integrates tightly with all AWS services.
CloudWatch Pricing
| Component | Free Tier | Paid Pricing (2025) | Notes |
|---|---|---|---|
| Lambda Metrics | Unlimited | FREE | 8 standard metrics per function |
| Custom Metrics | 10 metrics | $0.30 per metric per month | |
| Logs | 5GB per month | $0.50/GB (0–10TB) • $0.25/GB (10–30TB) • $0.05/GB (50TB+) | Tiered pricing was introduced in May 2025 |
| Log Storage | 5GB per month | $0.03/GB per month | Set retention policies |
| Alarms | 10 alarms | $0.10 per alarm per month | |
| Lambda Insights | N/A | $0.20 per 1M invocations | Adds CPU, memory, disk, and network metrics |
For a workload with roughly 50 Lambda functions and 100 million monthly invocations, CloudWatch log volume grows quickly. At about 5 KB of logs per invocation, this environment generates approximately 500 GB of logs each month.
Under the 2025 tiered pricing model, that volume costs around $250 in log ingestion alone. Lambda Insights adds a modest additional charge based on invocation volume, bringing the total to roughly $270 per month, or more than $3,200 annually.
CloudWatch Capabilities
CloudWatch provides the core metrics and logs you need, plus Log Insights and dashboards. The main cost risks are log retention, verbose logs, and enabling Lambda Insights everywhere.
| Pros | Cons |
|---|---|
| • No setup • Strong AWS integration • Low overhead • Free tier fits small workloads | • One-minute metric delays • Slow log viewer • No tracing without X-Ray • Troubleshooting across functions is manual • Log costs grow quickly |
2. AWS X-Ray (Distributed Tracing)
X-Ray provides distributed tracing for Lambda and connected AWS services. It visualizes request flow and highlights bottlenecks.
X-Ray Pricing
| Component | Free Tier | Paid Pricing (Beyond Free Tier) |
|---|---|---|
| Traces Recorded | 100,000 traces per month | $5 per 1,000,000 traces recorded |
| Traces Retrieved or Scanned | 1,000,000 traces per month | $0.50 per 1,000,000 traces retrieved or scanned |
With X-Ray, most teams stay within the free tier, which includes 100,000 recorded traces and 1 million retrieved or scanned traces each month. Beyond that, recording costs $5 per million traces, and retrieval/scanning costs $0.50 per million.
In a typical workload that generates about 144,000 traces per month with 10% sampling, only 44,000 traces exceed the free tier, adding roughly twenty cents to the bill. Even at 100% sampling, monthly spend is usually under seven dollars.
3. Combined AWS Strategy
Most teams pair CloudWatch for metrics and logs with X-Ray for tracing. Typical production workloads pay $50–$300 per month for 25–100 functions and 50M–500M invocations.
Teams usually upgrade when:
- Debugging takes longer than 30 minutes per incident
- Advanced visualizations are required
- Multi-cloud environments are used
- Monthly budgets exceed $500
Enterprise APM Platforms
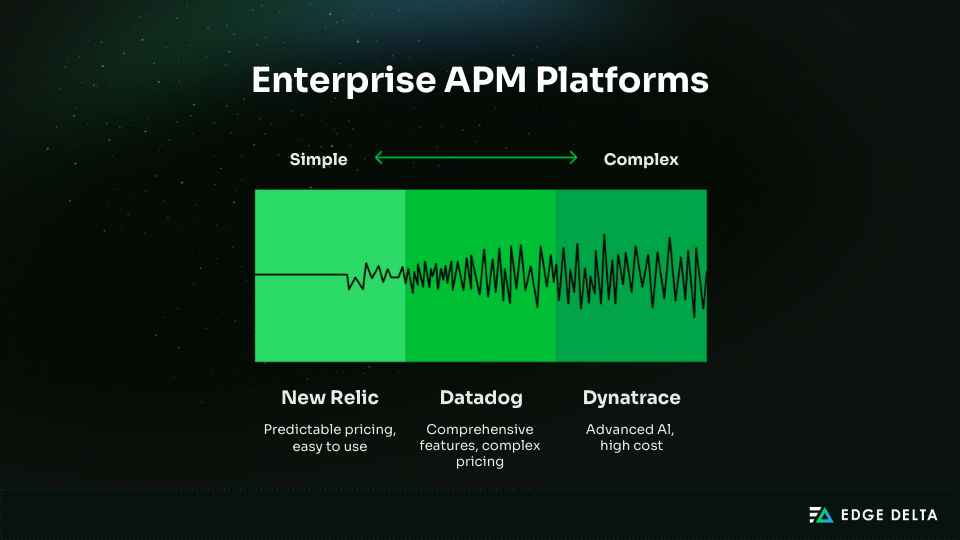
Enterprise APM platforms deliver advanced observability capabilities and typically cost between $500 and $5,000 per month. They’re well suited for teams running complex, highly distributed systems.
These tools are especially valuable for organizations that need faster, deeper troubleshooting and broader visibility than native AWS services can provide.
Datadog
Datadog is a widely adopted observability platform that provides broad visibility across infrastructure, applications, logs, and serverless workloads. It’s well suited for complex, fast-moving architectures, though its pricing can become cost-prohibitive at scale. As a result, many teams pair Datadog with a telemetry pipeline solution like Edge Delta to control data volumes and manage costs.
| Feature | Pricing | Cost for 50 Lambda Functions |
|---|---|---|
| Infrastructure | $15 per host monthly | ~ $200 monthly |
| APM | $31–$45 per host monthly | ~ $300–$400 monthly |
| Logs | $0.10/GB + $15 per host | $50–$250 monthly |
Most deployments land between $600 and $1,200 per month, though detailed, high-volume logging can push the cost above $2,000. Datadog Lambda monitoring includes near real-time metrics, distributed tracing, cold-start tracking, and more.
With more than 500 integrations and Watchdog (an AI root-cause analysis engine), Datadog provides deep observability for almost any system. Installation is straightforward with the Datadog Lambda Extension and typically takes 30–60 minutes.
| Pros | Cons |
|---|---|
| • Comprehensive feature set • Strong visualizations and query language • Broad integration ecosystem • Scales well across large, hybrid environments | • Pricing is complex and can result in bill surprises • Costs rise significantly at scale • Learning curve for new teams • Overkill for serverless-only workloads |
Best For: Large enterprises managing multi-cloud or hybrid environments with observability budgets exceeding $5,000 per month.
One customer report reflects this tradeoff: “Datadog’s features are unmatched, but our bill jumped from $800 to $2,400 after detailed logging was enabled.”
New Relic
New Relic positions itself as a simpler, more predictable alternative to Datadog. Its unified pricing model of charging per user plus data usage helps teams avoid separate APM, logs, and tracing charges.
| Tier | User Cost | Data | Lambda Coverage | Typical Total |
|---|---|---|---|---|
| Free | 1 user | 100 GB monthly | Full features | $0 |
| Standard | $49–$99 per user | Pay per extra GB | All included | $400–$800 (5–8 users) |
For a workload of 50 functions generating 500 GB of telemetry, a typical monthly bill is around $615. An equivalent Datadog setup often costs 40–60% more.
New Relic’s Lambda monitoring includes serverless APM, distributed tracing, anomaly detection, NRQL queries, and SLO tracking. The platform is generally easy to use, though it offers fewer integrations than Datadog.
Best for: Mid-market teams, cost-predictable environments, and startups scaling observability without overspending.
As one DevOps lead put it:“We switched from Datadog to control costs. Monthly spend dropped from $1,800 to $650 with similar visibility.”
Dynatrace
Dynatrace offers some of the most advanced AI-driven observability capabilities in the market. It uses OneAgent for automatic instrumentation and Davis AI for root-cause analysis, significantly reducing manual configuration.
Pricing is consumption-based and often requires a sales conversation. Most customers spend $1,000 to $5,000 per month as a starting point.
Dynatrace excels in large enterprises due to its automation and AI features. However, it is the most expensive option and usually unnecessary for smaller or serverless-focused workloads.
Best For: Organizations with more than 1,000 employees and annual observability budgets above $50,000.
Comparison Overview
| Platform | Cost | Best For | Lambda Focus | Value |
|---|---|---|---|---|
| Datadog | $600–$1,200 | Multi-cloud, large systems | ⭐⭐⭐⭐⭐ | 4/5 |
| New Relic | $400–$800 | Mid-market teams | ⭐⭐⭐⭐ | 4/5 |
| Dynatrace | $1,000+ | Enterprise AI needs | ⭐⭐⭐ | 3.5/5 |
Serverless-Focused Tools
Serverless-focused monitoring tools provide faster debugging and clearer visibility for distributed workloads. They accelerate time-to-value by automating tracing, correlation, and dependency mapping.
The primary trade-off is cost, as each trace typically carries a higher price than CloudWatch or X-Ray. Despite this, many teams adopt these tools because the faster debugging they enable boosts developer efficiency and reduces incident resolution times.
Lumigo
Lumigo delivers one of the strongest experiences for serverless monitoring, making distributed applications easy to understand.
Setup takes just five minutes via a Lambda Layer, requires no code changes, and automatically instruments functions. This is ideal for teams seeking instant visibility without extensive configuration.
The free tier includes 150,000 traces per month. Paid plans generally range from $300 to $1,000 per month, depending on usage. Lumigo is noticeably more expensive per trace—often 5–10 times the cost of CloudWatch.
For example, with 1 million traces per month:
- CloudWatch + X-Ray: $50–100
- Lumigo: $500–1,000
- Datadog: $600–1,200
Conclusion: The higher cost is justified by faster debugging.
Lumigo focuses on rapid troubleshooting with features built specifically for serverless workloads:
- Visual transaction flows mapping the full request path
- Automatic distributed tracing
- Live tail for real-time logs
- Error detection and performance bottleneck heatmaps
- Per-function cost insights
- Optimized support for Python and Node.js
A quick comparison highlights the time savings. Debugging in CloudWatch often requires reviewing multiple Lambda logs:
- Lambda 1 logs: 5 minutes
- Lambda 2 logs: 5 minutes
- Lambda 3 logs (finding a DynamoDB timeout): 5 minutes
- Total: ~15 minutes
With Lumigo, the full path appears in one visual map:
- Lambda 1 → Lambda 2 → Lambda 3 → DynamoDB (failure highlighted)
- Clicking the DynamoDB segment reveals the timeout
- Time to diagnose: ~30 seconds
Lumigo works best for teams running primarily serverless workloads and managing roughly 10–100 Lambda functions. It’s particularly valuable when fast debugging matters and engineering time is costly, with budgets in the $300–$1,000 monthly range.
As one CTO put it: “Debugging went from 30 minutes to 30 seconds. Our five-engineer team saves about ten hours each week.”
Open-Source Solutions
Open-source monitoring provides complete flexibility and no SaaS licensing fees. Teams control every component, retain all data, and can customize the entire stack.
The trade-off is significant engineering effort. Self-hosted platforms require setup time, ongoing maintenance, infrastructure management, and skills that often exceed what small teams can support.
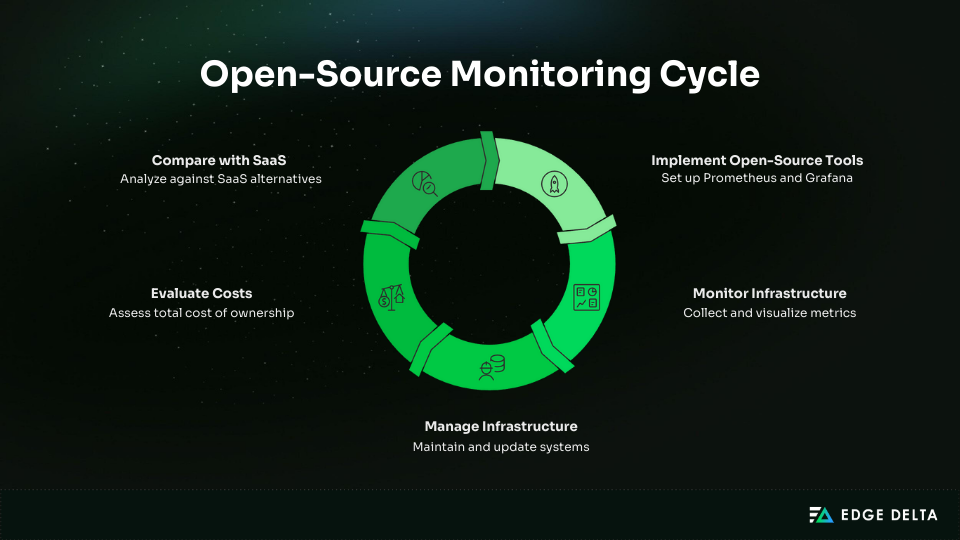
Prometheus + Grafana
Prometheus Lambda monitoring and Grafana form the most popular open-source monitoring stack. Prometheus collects metrics, while Grafana powers dashboards and visualizations.
The software is free, but self-hosting introduces real infrastructure and labor costs that many teams underestimate.
Total Cost of Ownership
Infrastructure typically costs:
- $50–$100/month for small systems
- $200–$500/month for medium systems
- $1,000–$2,000/month for large systems
Setup requires 40–80 hours for small deployments and up to 200 hours for large ones.
Monthly maintenance ranges from 5 to 40 hours. At a $100/hour engineering rate, the first-year total commonly ranges from $6,600 to $88,000.
Break-Even Analysis
For 10–50 Lambda functions, Prometheus amortizes to $550–$1,100/month, similar to Datadog’s $600–$1,200/month. Break-even typically occurs after 12 months.
At large scale (1,000+ functions), Prometheus costs $3,600–$7,300/month, while Datadog runs $5,000–$10,000/month. Large deployments break even in 18–24 months, after which Prometheus becomes the cheaper long-term option.
Integration Options:
- Lambda Telemetry API + PushGateway: Most flexible
- ADOT Lambda Layer: Production-ready, medium complexity
- CloudWatch Exporter: Easiest, least detailed
| Pros | Cons |
|---|---|
| • No vendor lock-in • Full data ownership • Deep customization • Free software • Multi-cloud compatibility | • Requires DevOps expertise • Long setup time • Ongoing infrastructure burden • Engineering cost often exceeds SaaS savings |
Prometheus + Grafana suits large teams with strong DevOps skills, strict data ownership needs, or very high-scale environments. It’s not a good fit for smaller teams, limited budgets, or situations where fast deployment and low overhead matter.
Grafana Cloud (Managed Open-Source)
Grafana Cloud offers managed Prometheus, Loki, Tempo, and Mimir, giving teams the benefits of open source without hosting their own infrastructure. The free tier includes 10,000 metrics and 50 GB of logs and traces.
Paid usage follows a per-GB model, typically $100–$400/month, often cheaper than Datadog. It fits teams wanting open-source tools without the burden of self-hosting.
Decision Framework
Use this framework to match your monitoring needs with the right tool. Your budget, function count, invocation volume, and architecture determine whether native AWS tools, a serverless-focused platform, or an enterprise solution is the best fit.
Quick Decision Guide
Budget is the easiest way to narrow your choices:
- <$50 CloudWatch free tier
- $50 to $300 CloudWatch + X-Ray
- $300 to $1,000 Lumigo or Grafana Cloud
- $1,000 to $5,000 Datadog or New Relic
- $5,000+ Dynatrace or self-hosted Prometheus
Invocation volume also influences cost and tooling needs:
- Under 10M CloudWatch free tier
- 10M to 100M CloudWatch ($50–250) or Lumigo ($300–600)
- 100M to 1B Enterprise platforms
- Above 1B Self-hosted Prometheus or high-tier SaaS
CloudWatch works for small setups with fewer than 20 functions, but its basic metrics and slower debugging push many teams toward third-party tools with stronger tracing, anomaly detection, and quicker issue resolution.
Architecture and debugging needs matter. Lambda-only stacks suit CloudWatch, while setups with ECS, EKS, SQS, or API Gateway benefit more from Datadog or New Relic. CloudWatch is the slowest to debug, Lumigo is the fastest, and Datadog gives the deepest analytics.
Recommended Tool by Scenario
| Situation | Tool | Monthly Cost |
|---|---|---|
| Startup (5 to 10 functions) | CloudWatch + X-Ray | $0 to $30 |
| Growing (20 to 50 functions) | Lumigo or Grafana Cloud | $300 to $600 |
| Mid-market (50 to 200) | New Relic or Lumigo | $400 to $1,000 |
| Enterprise | Datadog or Dynatrace | $1,000 to $5,000+ |
| Very high scale | Self-hosted Prometheus | $2,000 to $5,000 |
Selection Checklist and Scoring
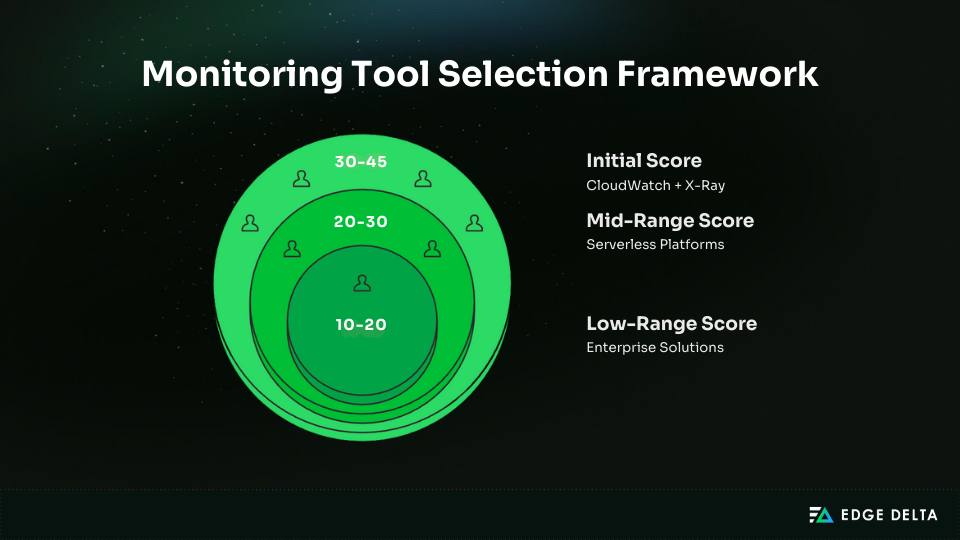
Score your monthly budget, team size, function count, debugging needs, and architecture complexity from 1 to 5. Add the total. Scores of 30-45 fit CloudWatch + X-Ray.
Scores of 20 to 30 align with serverless-focused platforms or Grafana Cloud. Scores of 10-20 indicate the need for an enterprise or self-hosted solution.
Best Practices and Cost Optimization
Effective implementation improves visibility, reduces noise, and prevents unnecessary CloudWatch spend. These best practices and optimisation steps help you monitor Lambda workloads efficiently while keeping costs predictable.
Implementation Best Practices
Strong monitoring starts with clean logs, consistent tracing, and reliable alerting. These steps help ensure accurate insights and prevent wasted spend.
1. Set CloudWatch Log Retention
Retention must be configured early since CloudWatch logs never expire by default and costs rise quickly.
for log_group in $(aws logs describe-log-groups \
  --log-group-name-prefix '/aws/lambda/' \
  --query 'logGroups[?retentionInDays==`null`].logGroupName' \
  --output text); do
  aws logs put-retention-policy \
    --log-group-name $log_group \
    --retention-in-days 30done
2. Use Structured Logging (JSON)
Structured logs make filtering, searching, and analytics far more accurate than plain text.
console.log(JSON.stringify({
  level:"INFO",
  message:"Processing order",
  userId:"123",
  orderId:"456",
  correlationId:event.headers["x-correlation-id"],
  timestamp:Date.now()
}));
3. Implement Correlation IDs
Correlation IDs link logs across distributed systems, enabling end-to-end tracing. Generate IDs at API Gateway, pass them to all Lambdas, and include them in every log.
4. Set Meaningful Alerts
Good alerting highlights real reliability issues, not noise. Use thresholds like:
- Error rate >1% for 5 minutes
- p99 latency > 2× baseline
- Throttles > 0
5. Establish Baselines First
Collect two weeks of production data to understand normal p50/p95/p99 latency, error rates, and cold-start frequency before setting alerts.
Cost Optimization Strategies
These techniques reduce log volume, control ingestion costs, and ensure monitoring remains cost-efficient at scale.
- Apply Log Retention Policies: Use 7 days for dev/test and 30–90 days for production. Archive older logs to S3 ($0.023/GB) for cheaper storage.
- Use Log Levels Wisely: Limit INFO and WARN in production. DEBUG should be development-only.
- Use Sampling: Trace only what you need: 10% standard sampling and 50% for critical paths to save up to 90% on tracing costs.
- Enable Lambda Insights Selectively: At $0.20 per 1M invocations, apply only to your top 20% most critical functions.
- Archive Old Logs to S3: Move logs older than 90 days to S3 and use Intelligent-Tiering to save even more.
- Filter Logs Before Ingestion: 500 GB/month of logs costs ~$250 in CloudWatch. Filtering with tools to lower costs.
Some teams use telemetry pipelines to manage CloudWatch spend as Lambda scales. Edge Delta is one option. It filters and shapes logs before they reach CloudWatch, cutting low-value data without requiring code changes.
Edge Delta helps when functions generate high log volume or when environments need different retention rules. Many teams see a 60–80% reduction in ingestion, which lowers CloudWatch costs while preserving the metrics and error details required for debugging.
Frequently Asked Questions
Is CloudWatch enough for Lambda monitoring?
CloudWatch fits small workloads with under 20 functions and simple architectures. It provides basic metrics and tracing but slower debugging. Teams switch to third-party tools for faster resolution, better tracing, anomaly detection, and shorter debugging times.
How much does CloudWatch cost at scale?
CloudWatch metrics are free, but logs cost $0.50/GB. At 100M invocations, Lambda typically generates ~500GB, costing about $250/month, plus $20 for Lambda Insights. With X-Ray, the total runs $270–$300. At 1B invocations, log costs range from $2,500 to $3,000. Using 30-day retention prevents long-term cost growth.
Datadog vs. Lumigo: What’s the difference?
Lumigo focuses on serverless, with fast setup and visual tracing. It costs $500–$1,000/month. Datadog provides full-stack observability for Lambda, containers, VMs, and databases at $600–$1,200/month. Lumigo suits serverless-only teams, while Datadog fits complex or multi-cloud environments.
Can I use Prometheus for Lambda monitoring?
Yes. With ADOT, Lambda metrics can be exported to Prometheus and viewed in Grafana. Software is free, but hosting costs $50–$500/month plus setup time. It’s most cost-effective for large deployments or data sovereignty needs.
How do I reduce CloudWatch Logs costs?
Use 30-day retention, reduce log levels, and apply sampling. Filtering with tools like Edge Delta cuts log volume by 60–80% (e.g., 500GB → 100GB: $250 → $50). Archive old logs to S3 for cheaper storage.
References:

