Amazon CloudWatch Logs gives teams that use AWS an easy way to collect and analyze their log data. CloudWatch is easy to use because it’s simple to set up and well-integrated with the AWS ecosystem. However, many customers run into challenges as their data volumes grow and their observability needs start to mature.
The Challenges of Amazon CloudWatch Logs
The first challenge is cost. Your Amazon CloudWatch bill depends on a few different factors. CloudWatch charges for ingest volumes, storage, queries run, and, if applicable, egress (per the CloudWatch pricing page). Anticipating your monthly bill becomes more complicated when you factor in metrics, CloudWatch alarms, dashboards, and other components.
As a result, AWS CloudWatch costs can quickly get out of hand and you may surprised by your bill at the end of the month. That’s why the monitoring tool can make up so much of your cloud costs. Many customers spend more on the service than they would for a more complete, third-party observability platform.
In one example, a customer was paying over $0.90 per GB when you factor in everything CloudWatch charges. This cost is 40% more than the data ingestion list price. (Eventually, this customer was able to reduce TCO by two-thirds using Edge Delta.)
The second challenge is that Amazon CloudWatch can lead to tool sprawl because it isn’t suitable for every use case. Specifically, if you use multiple clouds, you’ll need another tool to monitor non-AWS resources. Additionally, if you have teams with more advanced needs, they are likely better off using a standalone analytics tool. In these situations, one team (likely your infrastructure team) relies on CloudWatch, while other teams use their own tools.
If you experience this second challenge, you’re facing a complex management experience and potentially poor usability. The tools poorly integrate with one another. Each might have its own query language to learn (for example, CloudWatch Log Insights query syntax). Additionally, you might have several log collection agents deployed to meet the needs of different teams and their platforms.
In other words, you collect, prepare, and deliver logs in several different ways.
Edge Delta provides a few options to help you solve these challenges.
Option #1: Pre-Process Log Data Upstream
If you would like to continue using the Amazon CloudWatch service, you can leverage Edge Delta Observability Pipelines to pre-process the data you ingest into the platform. This approach can help you reduce CloudWatch costs.
Engineering teams often don’t need all of the raw data they ingest into Amazon CloudWatch. In a recent survey commissioned by Edge Delta, 82% of DevOps and SRE professionals stated that they limit log ingestion to cut costs often or all of the time.
At Edge Delta, we think it’s no longer feasible to ingest complete raw datasets in an expensive log store. We also don’t think practices like sampling or omitting complete datasets give users enough control.
These practices may provide short-term cost optimization, but they fail to solve your data growth problem long-term. Plus, you can’t derive any analytical value from data you omit altogether. These ideas are what drive our log data optimization use case.
We’ve built our Observability Pipelines product to give you more control over what you store in logging tools, like Amazon CloudWatch, while also providing visibility into data you don’t ingest raw.
Here’s how it works. The Edge Delta agent sits at the data source (or as close to the source as possible). The agent pre-processes every log event as it’s created.
Before ingesting data into CloudWatch, you can…
- Extract metrics from your logs to populate dashboards. The metrics are derived upstream, not after you’ve ingested the data in CloudWatch.
- Group recurring log lines into patterns to control the frequency you ingest events. As a result, you don’t end up storing (and paying for) hundreds of thousands of the same log event.
- Reduce the verbosity of your log data by removing excessive tagging or information that your team doesn’t need.
As data passes through the Edge Delta agent, we route all raw logs to Amazon S3. You can access these logs at any time.
All of these features help you ingest and pay for your most valuable log data. At the same time, they provide visibility and access to the data you don’t ingest in CloudWatch. As a result, you can right-size resource allocation and drive cost optimization.
Option #2: Replace Amazon CloudWatch
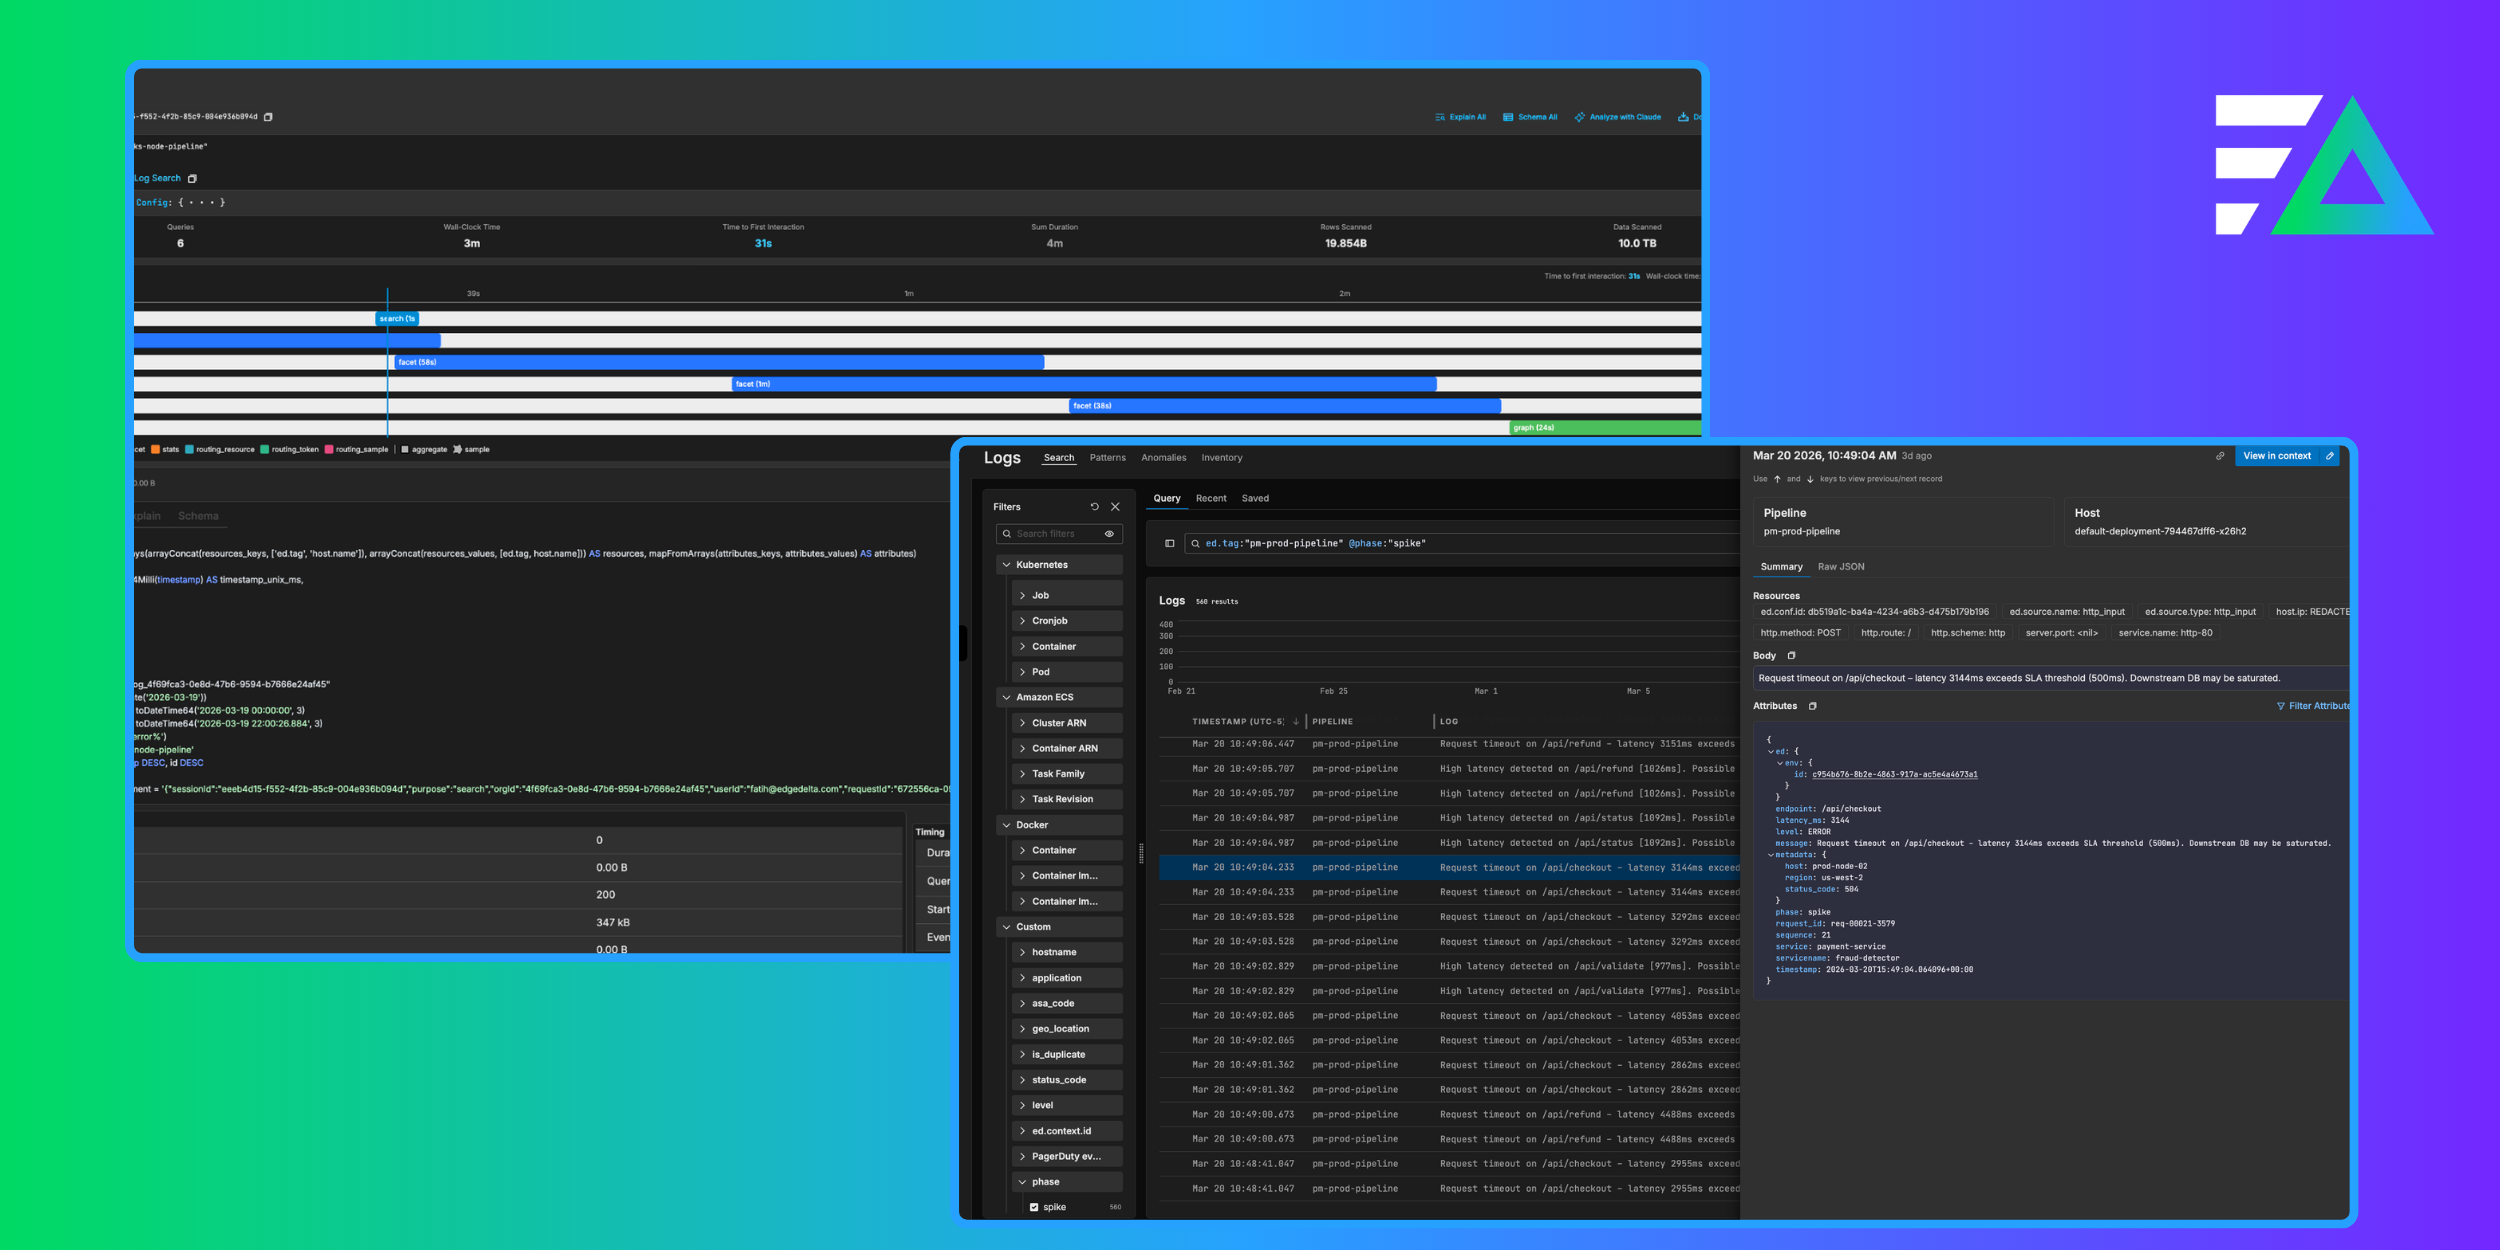
The most effective way to reduce Amazon CloudWatch costs is to replace the platform with Edge Delta Log Search. This is the route that Inter and Qualiti took.
Inter’s infrastructure team was using Amazon CloudWatch to monitor their Amazon EKS node and container logs. These resources alone generated over 70 TB of log data per month. Inter used another platform to support their application developers and a SIEM tool for their security logs. This setup made sense at the time because CloudWatch was well integrated with Amazon EKS, and their other observability tools weren’t optimized for Kubernetes data.
However, Edge Delta removed this point of friction. In addition to reducing costs, Edge Delta has helped Inter troubleshoot issues more easily. Rafael Bruno de Almeida, Inter’s Senior Tech Manager explains, “Edge Delta brings us good alerts and insights in a simpler manner to help us troubleshoot the whole issue.”
For Inter, the total cost of using Edge Delta is 60% less expensive than CloudWatch.
Qualiti’s decision to move off of Amazon CloudWatch was due to both cost and usability issues. More specifically, Qualiti’s developers had a hard time locating the log data they needed when using CloudWatch. Principal DevOps Engineer, Derrick Walton explains, “I wanted to ease the burden on our development team of locating the logs they needed. I didn’t want to have to jump in and continuously locate those logs for them.”
Since moving to Edge Delta, Walton notes, “things that took an hour to fix now take us 15 minutes.”
Summarizing the Two Paths to CloudWatch Cost Optimization
Amazon CloudWatch Logs provide an easy way to monitor your AWS logs. However, the platform can quickly become expensive as your data volumes grow. And, it’s unlikely to meet all of your teams’ needs – especially when it comes to monitoring resources that aren’t AWS services. So, you might end up with tool sprawl and management complexity.
By adopting Edge Delta, you can take two paths to Amazon CloudWatch cost optimization. First, you can pre-process your logs before ingesting data into CloudWatch. This approach allows you to reduce CloudWatch costs while continuing to use the platform. Second, you can replace CloudWatch, and realize savings of 60% or more.


