


Modern applications often produce log entries that contain multiple events. A single log line might include a full stack trace, several steps in a batch job, or multiple actions in one transaction. While this format technically works, it causes issues during analysis. Teams often need to split log items into multiple separate logs to improve visibility, alerting, and compliance, and preserve a one-to-one mapping to associated events.
Take a Java error, for example. The stack trace spans several lines but, can be saved as one single entry. This makes it hard to search or set alerts for specific exceptions within the stack trace. The same problem happens in ETL workflows or CI/CD pipelines. When logs show multiple operations in one block, teams struggle to pinpoint failures or monitor job progress.
Log splitting solves this problem by turning a single, complex entry into separate and meaningful events. This improves searchability, enables more precise alerts, supports detailed audit logs, and reduces storage costs through better data filtering.
In this article, we’ll explain when to split logs, why it matters, and how to do it. You’ll also learn which tools and techniques make log splitting easier and more efficient.
Key Takeaways
• Log splitting separates a single log entry into multiple events to improve analysis and observability.
• Splitting logs enhances searchability, alerting, compliance, and storage optimization.
• Tools like Logstash, Fluent Bit, Drain3, and Edge Delta support various log splitting techniques.
• Regex, delimiters, state machines, and ML-based parsing are all popular approaches used to implement log splitting.
• Splitting logs helps teams isolate failures and pinpoint latency in large systems.
• Proper implementation requires pattern analysis, tool selection, testing, and documentation.
• As log formats evolve, dynamic pattern learning and schema versioning support long-term scalability.
What Is Log Splitting, and When Do You Need It?
As modern systems generate increasingly complex logs, it’s common for a single log entry to contain multiple events. Without breaking these into separate records, analysis and monitoring can become inefficient or misleading. This is where log splitting, also known as log segmentation, becomes essential.
Understanding Log Splitting
Log splitting is the process of breaking a single log entry into separate records. It is used when one log contains multiple events or operations. This situation is common in batch jobs, stack traces, or JSON arrays, where a single line includes several actions. Logs like these are hard to search, monitor, or analyze in their original form.
Unlike log parsing, which extracts structured fields such as timestamps, severity levels, or user identifiers from a single event, log splitting turns one combined entry into several independent events. These methods are often used together — logs are split first, then parsed to extract useful details. Log segmentation improves analysis, makes alerting more accurate, and helps manage storage and monitoring more efficiently.
When Log Splitting Is Necessary
Several scenarios commonly require log splitting:
-
Multi-line Stack Traces
Languages like Java or Python often produce exception logs that span multiple lines.
Example:
java.lang.NullPointerException
   at com.example.Main.process(Main.java:42)
   at com.example.App.run(App.java:17)
Splitting this trace into individual lines as separate log events helps with searching and root cause analysis.
-
Batch Job Logs with Multiple Steps
ETL or cron jobs may output a single log entry containing multiple operations.
Example:
Extract started... Data transformed... Upload complete.Breaking this into task-level logs enables monitoring of each step’s success or failure.
-
CSV or JSON Logs with Embedded Records
Some systems log multiple structured records in one line.
Example (JSON array):
{"transactions": [{"id":1}, {"id":2}, {"id":3}]}Splitting this ensures each transaction can be processed and queried independently.
- Combined Application and System Logs
Logs that contain messages from multiple sources, e.g., app errors and system warnings, can be difficult to filter unless split by source or severity.
Log splitting improves log analysis by enabling more accurate pattern detection and visualizations. It enhances monitoring by isolating event-level metrics and supports alerting by allowing fine-grained rules for individual log events.
Benefits and Use Cases
As log volumes grow as a result of increasingly complex applications, splitting logs becomes essential for observability, security, and operational efficiency, unlocking multiple benefits across monitoring, compliance, and analytics workflows.
- Improved Searchability and Filtering
When each log line represents a single event, it becomes far easier to query specific issues. For example, parsing multi-line stack traces or JSON arrays into individual records enables tools like Logstash or Fluent Bit to return targeted results faster. This reduces troubleshooting time and improves accuracy, with some teams reporting up to 60% faster root cause identification.
- Enhanced Alerting Capabilities
Splitting logs allows for more granular alert rules. Instead of alerting on vague, aggregated errors, you can define conditions for specific events—such as a failed payment or unauthorized login attempt. Tools like Datadog or New Relic can trigger alerts based on fields within structured, split logs, improving mean time to detection (MTTD).
- Better Compliance and Audit Trails
Many regulations, including GDPR and HIPAA, require detailed logging of system access and changes. Splitting logs ensures each authentication or data access event is preserved individually, making audit trails more complete and traceable. This improves forensic capabilities and compliance posture during audits.
- Optimized Storage and Indexing
When logs are split and structured, you can apply selective retention policies. For instance, discard verbose debug-level entries while retaining critical error events. This approach reduces log storage costs, especially at scale, and speeds up indexing in systems like Elasticsearch or OpenSearch.
- Simplified Analysis and Reporting
Splitting logs into structured events enables better aggregation of metrics. Platforms like Datadog support visualizing logs by latency, user, or service once events are properly separated. This support helps teams build dashboards and usage reports that drive real-time insights.
- Easier Troubleshooting
Isolating individual events in long job logs or session traces makes it much easier to identify failure points. Instead of reading through 500 lines, an engineer can jump directly to the failed task or API call.
Real-World Use Cases
In e-commerce, log splitting helps track each step of an order—such as inventory checks, payment authorization, and fulfillment. This level of detail enables teams to isolate failures, identify abandoned checkouts, and resolve transaction issues faster.
In security monitoring, separating authentication from authorization logs improves incident detection. Failed login attempts, suspicious access patterns, or privilege misuse become easier to trace when events are individually logged, supporting compliance with standards like HIPAA and PCI-DSS.
For application performance, splitting logs reveals whether delays stem from slow HTTP requests or backend database queries. This allows engineers to pinpoint latency sources and optimize specific services without sifting through lengthy composite logs.
In ETL and batch jobs, each stage—extraction, transformation, and loading—can be logged separately. This makes it easier to monitor task-level success or failure, catch bottlenecks early, and debug large-scale data workflows more efficiently.
Common Log Splitting Scenarios
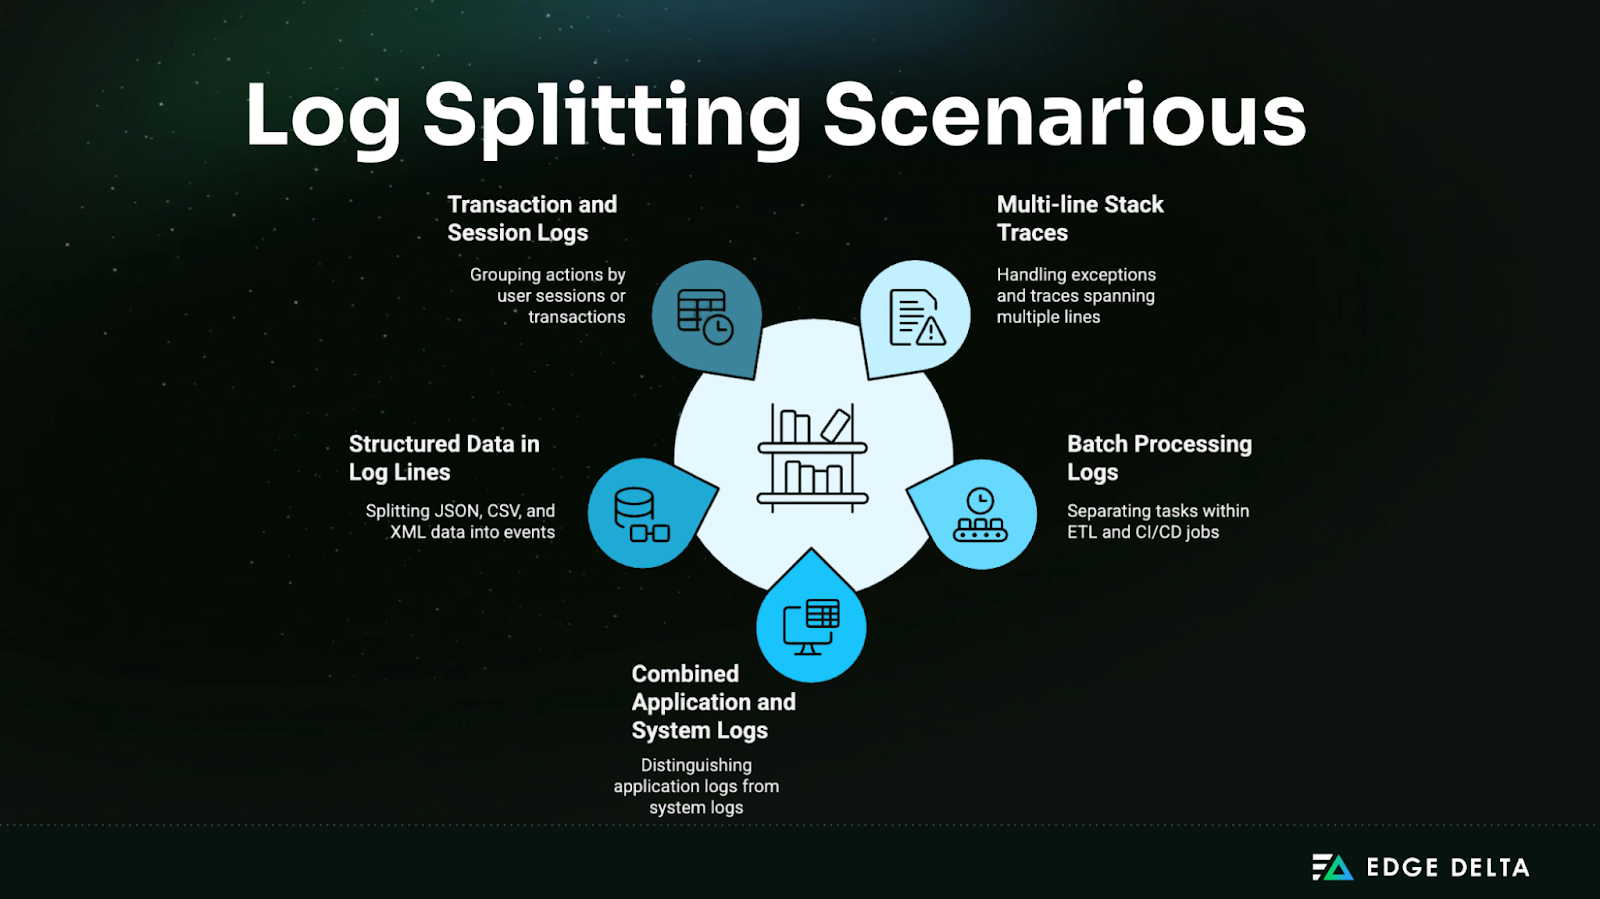
When processing large-scale logs, different patterns often require tailored splitting strategies. Let’s explore five typical scenarios and how to accurately detect and separate entries.
Multi-line Stack Traces and Exceptions
A common log splitting scenario involves multi-line stack traces from languages like Java, Python, and .NET. These span multiple lines but represent a single event. Without proper handling, log shippers may treat each line as a separate entry, breaking context and inflating log volume.
Example:
java.lang.RuntimeException: Something went wrong
    at com.example.App.method(App.java:42)
    at com.example.App.main(App.java:10)
To group these lines correctly:
- Use start patterns like
^Exceptionor^Traceback - Match continuation lines using
^\s+atorCaused by:
Tools like Fluent Bit and Logstash support multiline parsing with regex-based state machines. For instance, CNCF shows how to use Fluent Bit’s start_state/cont rules help join indented lines into a single event, preserving the full error context for debugging and alerting.
Batch Processing and Job Logs
Logs from ETL jobs, cron jobs, or CI/CD pipelines often contain multiple steps recorded in a single run. These include actions like data extraction, transformation, uploads, builds, tests, or deployments. Without splitting, it’s hard to isolate and analyze individual tasks.
To separate log events, look for markers like [JOB START], [STEP], or [JOB END]. Timestamps and job IDs also help define logical boundaries.
Example:
[JOB START] Deploy App
Build complete.
Tests passed.
Deployed to production.
[JOB END] Status: Success
Tools like Logstash, Fluent Bit, and Edge Delta can extract task-level results using Grok patterns or custom parsers to split logs into structured, searchable chunks.
Combined Application and System Logs
Applications often write logs to centralized system channels (e.g., syslog, journald), mixing entries from applications and the operating system. One log file may include high-severity errors (ERROR) alongside informational (INFO) entries from different sources.
To separate these effectively:
- Split on timestamps: Regex patterns like
^\d{4}-\d{2}-\d{2}T\d{2}:\d{2}:\d{2}denote new log entries. - Use source tags: Facilities (
cron,daemon,local0) or program names (myapp,kernel) can be used to route logs appropriately
Tools like syslog-ng, rsyslog, Fluent Bit, Edge Delta, or Logstash can filter by severity or source, enabling clear separation of application logs from system noise.
Structured Data in Single Log Lines
Sometimes logs embed multiple records within a single line—using formats like JSON, CSV, or XML. Common scenarios include:
- JSON arrays (e.g.,
{"events":[{"id":1},{"id":2}]}), which need splitting into individual event documents. - CSV strings containing multiple entries separated by semicolons or pipes.
- XML logs like
<records><r>…</r><r>…</r></records>, where each<r>element is a distinct record.
Systems like Logstash use the split filter to explode JSON arrays into separate events. Similar capabilities exist in Edge Delta, Fluent Bit, Fluentd, and jq-based pipelines. Handling nested structures ensures each logical record becomes its own log event.
Transaction and Session Logs
Session and transaction logs record a series of actions tied to one user or process, such as user clicks, database operations, or API request–response cycles. These logs can include:
- Multiple user actions within a session
- Database transactions like
BEGIN…COMMITorROLLBACK - API calls with request and response pairs
To split them, look for session or transaction boundaries: markers like [SESSION_START]/END, transaction IDs, or unique correlation IDs in headers. Tools like Logstash, Edge Delta, Fluent Bit, or AWS solutions such as Fluent Bit with stream processing can use these fields to group and route logs. This approach enables you to separate each session or transaction as its own logical event for better traceability and analysis.
Technical Approaches to Log Splitting
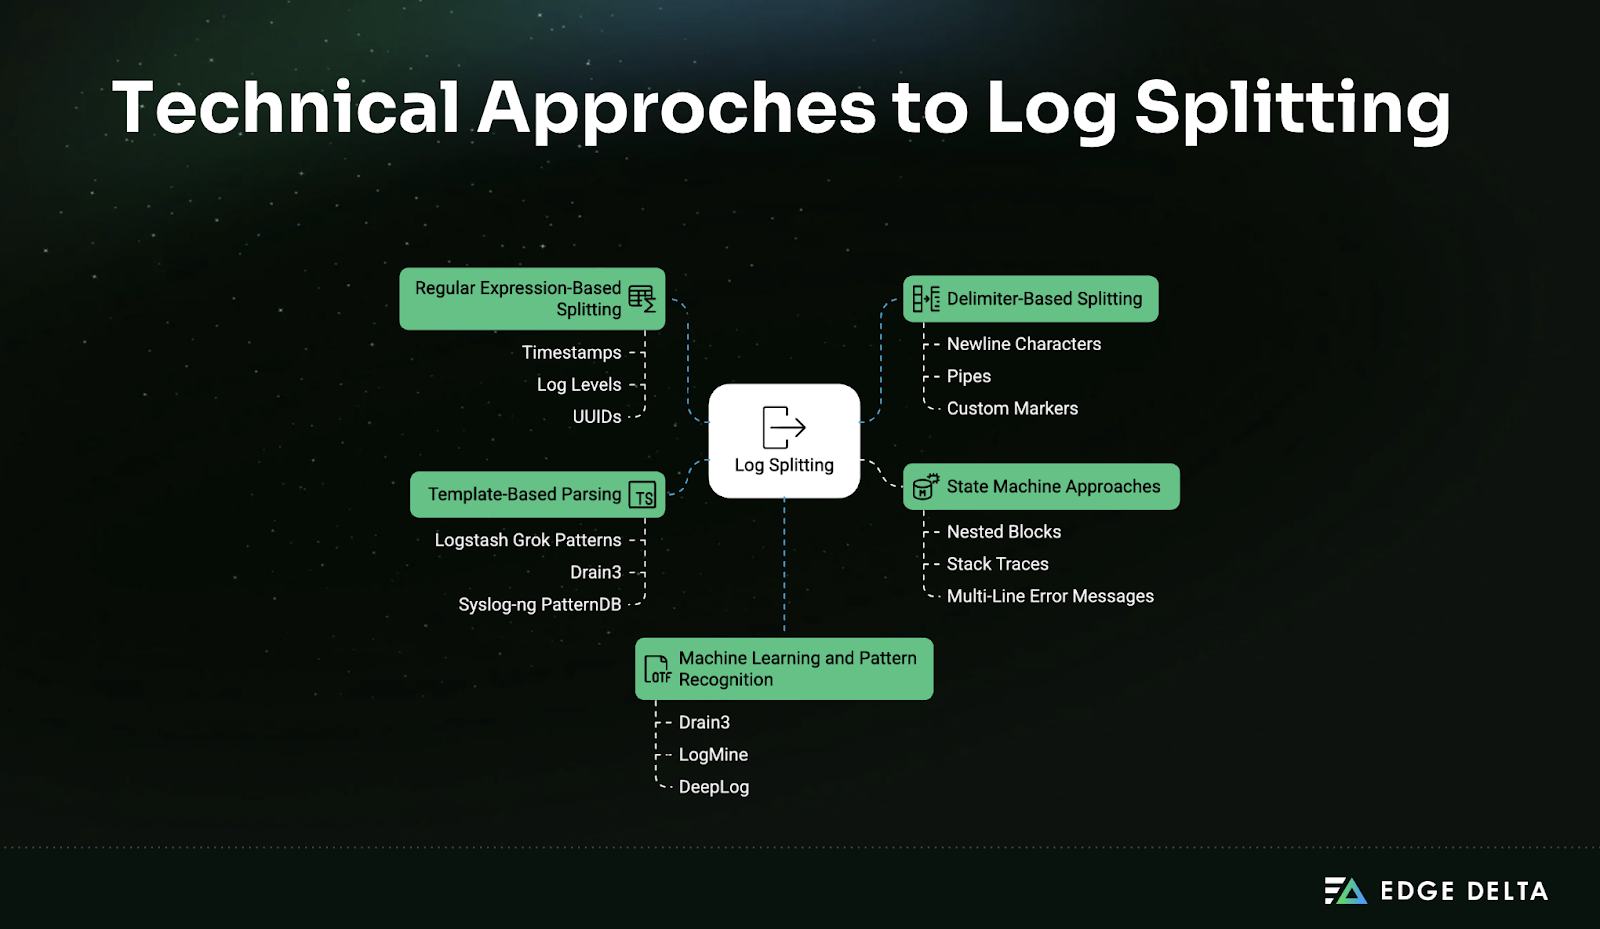
Log splitting transforms raw log streams into individual events for easier parsing and analysis. The right approach depends on log structure, performance needs, and tool compatibility. This section outlines key splitting methods — regex, delimiters, state machines, templates, and machine learning — along with practical guidance for implementation.
Regular Expression-Based Splitting
Regular expressions (regex) are a flexible and widely used method for log parsing and splitting. They allow you to define patterns that match log entry boundaries—typically using timestamps, severity levels, or transaction IDs.
Common patterns include:
- Timestamps:
\d{4}-\d{2}-\d{2} \d{2}:\d{2}:\d{2} - Log levels:
INFO|ERROR|DEBUG|WARN - UUIDs:
[a-f0-9]{8}-[a-f0-9]{4}-[a-f0-9]{4}-[a-f0-9]{4}-[a-f0-9]{12}
Python example for multi-line splitting:
import re
log_data = """2023-07-01 10:00:00 INFO Start
More info...2023-07-01 10:05:00 ERROR Failure"""
pattern = r'(?=\d{4}-\d{2}-\d{2} \d{2}:\d{2}:\d{2})'
entries = [line.strip() for line in re.split(pattern, log_data) if line.strip()]
In Java, Pattern.compile() with Matcher.find() is commonly used. In JavaScript, string.split(/regex/) allows regex-based segmentation.
Best practices:
- Keep patterns specific and well-documented.
- Avoid greedy quantifiers unless necessary.
- Use online tools like regex101 for testing.
- Validate with malformed logs to prevent data loss during parsing.
Delimiter-Based Splitting
Delimiter-based splitting separates logs using a consistent character or sequence that marks the boundary between entries. This method is efficient for logs with uniform formatting.
Common delimiters include:
- Newline characters (
\n) - Pipes (
|) - Custom markers like
###END###
Example in Python:
log_data = "entry1###END###entry2###END###entry3"
entries = log_data.split("###END###")
When using multi-character delimiters or special characters (e.g., |, *), escape them in regex-based processing. Tools like Logstash (Dissect filter) and Fluent Bit support delimiter-based splitting via configuration, as does Edge Delta.
Performance tip:
This approach is fast and memory-efficient, especially for large logs, but assumes that the delimiter never appears inside the log message itself. Validation and testing are essential for production use.
State Machine Approaches
State machines are ideal for parsing complex or structured logs where context matters—such as logs with nested blocks, stack traces, or multi-line error messages. A state machine maintains a parsing “state” and changes behavior based on current input and prior states.
Example use case:
Parsing Java exceptions where logs span multiple lines and end with a blank line.
Conceptual example:
- State: “Start” → Wait for exception
- State: “InError” → Append lines until blank line
Libraries like transitions (Python) or custom FSM logic in Go or Rust are often used in log parsing pipelines.
Benefits:
- Suitable for nested or hierarchical structures.
- Helps prevent splitting errors in multi-line log entries.
Caution:
FSMs require careful state management and error recovery logic to avoid getting stuck in malformed input scenarios.
Template-Based Parsing
Template-based parsing uses predefined structures to recognize and split logs. These templates describe common log formats and are often used in structured logging environments.
Tools and formats:
- Logstash Grok patterns: e.g.,
%{TIMESTAMP_ISO8601:timestamp} %{LOGLEVEL:level} %{GREEDYDATA:message} - Drain3: A template-based parser that extracts patterns from semi-structured logs.
- Syslog-ng PatternDB: Pattern matching for syslog messages.
Advantages:
- High accuracy for known log formats.
- Templates are readable and maintainable.
- Easy integration with observability platforms.
Best practices:
Version and document templates. Update them as application log formats evolve to avoid drift between actual logs and parsing logic.
Machine Learning and Pattern Recognition
Machine learning-based log parsing automates the discovery of log formats and splitting points by learning from sample data. This approach is effective in environments with dynamic or unknown log structures.
Popular tools:
- Drain3 – Log template mining
- LogMine – Frequent pattern mining
- DeepLog – Sequence modeling for anomaly detection
Workflow:
- Train on a dataset of logs
- Generate structure and segmentation rules
- Apply models in real-time or batch processing
Considerations:
ML adds complexity and computational overhead. It’s most effective for large-scale systems where manual rule maintenance is impractical. It is not ideal for simple, consistent logs where traditional parsing is more efficient.
Tools and Technologies for Log Splitting
An effective log splitting strategy relies on the right tools to parse, transform, and manage log data efficiently. This section outlines key tools and platforms used across open-source, commercial, cloud-native, and programmatic environments.
Open Source Tools
Open-source tools offer flexibility, transparency, and strong community support. They’re ideal for organizations seeking customizable and cost-effective solutions for log parsing and splitting.
- Logstash: A key part of the Elastic Stack, Logstash supports log splitting through filter plugins like
split,multiline, anddissect. These are useful for breaking up complex entries, handling multi-line stack traces, and extracting structured data. - Fluentd: This flexible log processor uses parser and filter plugins such as
record_transformerto transform and split log records based on patterns. - Fluent Bit: A lightweight alternative to Fluentd, Fluent Bit offers efficient log parsing and splitting with regex parsers and built-in filters—ideal for edge computing environments.
- rsyslog: Known for its high throughput, rsyslog includes modules like
mmnormalizeandmmjsonparseto parse, normalize, and split logs into structured formats. - Vector: A modern observability tool, Vector uses transforms like
remapandsplittoreshapeand route log data. Its configuration language allows flexible log transformations.
Commercial Platforms
Commercial platforms deliver end-to-end log management with enterprise-grade support, advanced features, and seamless integration with existing monitoring tools.
- Splunk: Offers both search-time and index-time log splitting. Features like
LINE_BREAKERin props.conf enable custom event segmentation. Users can also apply SPL (Search Processing Language) for parsing and analyzing. - Elastic Stack: Beyond Logstash, Elastic’s Ingest Pipelines use processors like
grok,split, and json to preprocess and split log entries at the point of ingestion. - Datadog: Provides customizable log pipelines where users can define parsing rules and transformation logic to break down raw logs into structured fields.
- New Relic: Enables log parsing and partitioning using configuration-based rule sets, allowing better organization and segmentation of log data.
- Sumo Logic: Uses pattern-based parsing expressions and field extraction tools to interpret and split log content for downstream querying and alerting.
Cloud-Native Services
Cloud-native platforms offer managed infrastructure and built-in tools for scalable log processing across distributed systems.
- AWS CloudWatch Logs: Uses subscription filters and AWS Lambda to process logs in real time, allowing for custom splitting and transformation before indexing.
- Azure Monitor: Supports query-time log splitting via Kusto Query Language (KQL) in Log Analytics.
- Google Cloud Logging: Uses structured logging and log routing combined with services like Cloud Functions for dynamic parsing and segmentation.
- Serverless Processing: Cloud functions like AWS Lambda or Azure Functions allow developers to write custom splitting logic as part of a scalable event-driven architecture.
Programming Libraries and Frameworks
For highly specialized or embedded use cases, programming libraries give developers full control over log parsing and transformation logic.
- Python: Libraries like re, json, and pandas are frequently used to create custom parsers and splitters for both structured and unstructured logs.
- Java: Developers use Apache Commons and Log4j, or build custom solutions for enterprise log parsing and segmentation.
- JavaScript/Node.js: Parsing libraries such as split2 and log-parser are suitable for real-time or batch log transformation tasks.
- Go: Offers fast performance and tools like logrus and native regex handling, making it ideal for high-throughput log processing and splitting.
Step-by-Step Implementation Guide
Implementing log splitting effectively requires a combination of planning, the right tools, and ongoing validation. Below is a practical walkthrough to help you get started, from initial analysis to testing and deployment.
1. Planning and Analysis
Before configuring any tools, take time to assess your current log formats, identify splitting needs, and define success criteria. Proper planning reduces errors and improves long-term maintainability.
-
Log pattern analysis
Review your service logs to determine where splits are needed—common delimiters include JSON boundaries, timestamps, or specific keywords. Identifying these helps define your splitting logic.
-
Volume and performance considerations
Estimate log event rates (events/sec, MB/minute) and evaluate resource capacity. This informs whether your pipeline should run on lightweight agents (e.g., Fluent Bit) or heavyweight systems (e.g., Logstash or Fluentd)
-
Tool selection criteria
Match your parsing needs against tool strengths: use Logstash for heavy regex, Fluentd/Fluent Bit for streaming, or serverless/cloud-based approaches if you need auto-scaling and low management overhead.
-
Testing strategy
Plan for test pipelines using sample log files including typical and edge cases (e.g., multiline stack traces). Prepare metrics to track correctness (split counts/results) before rolling out to production.
2. Implementation Steps
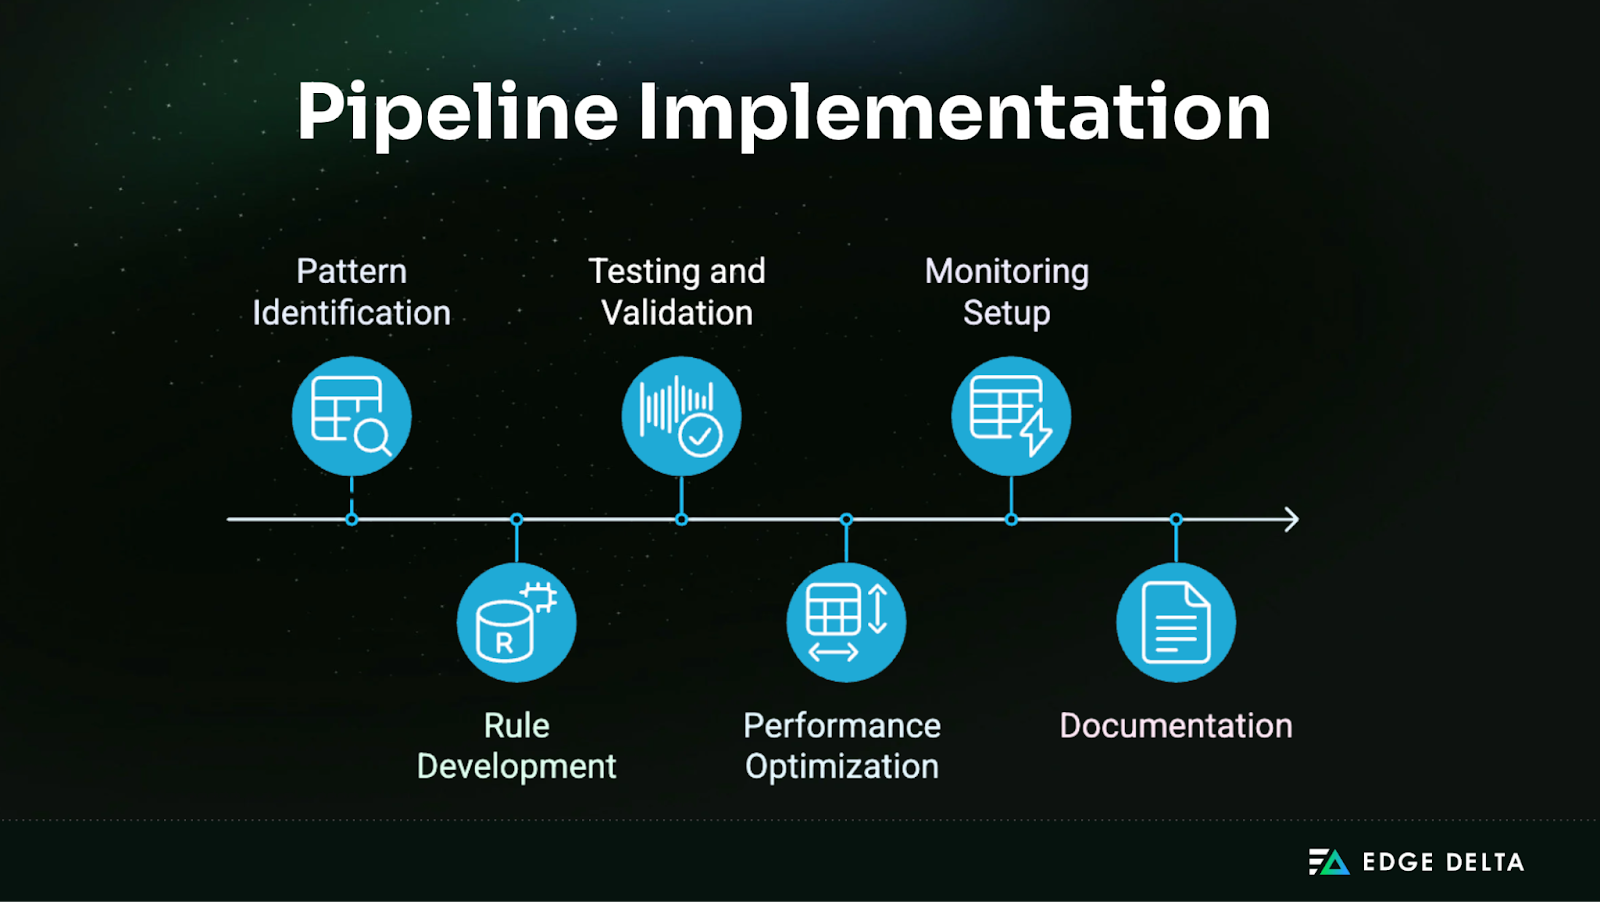
Once your strategy is defined, it’s time to build the pipeline. The following steps cover everything from pattern extraction to optimization and monitoring.
-
Pattern identification
Inspect a representative log batch. Identify repeated split points (e.g., JSON arrays or timestamps). Example: multiline stack traces or batched JSON events in a “records” field .
-
Rule development
- With Logstash, use a grok filter to capture fields, followed by a split filter to break array elements into events.
- With Fluentd, use rewrite_tag_filter or concat plugins to chunk multiline logs into the correct unit
-
Testing and validation
Run pipelines against sample logs. Validate output through assertions or simple file diff checks. Confirm that each split event still includes required metadata like timestamp, level, ID.
-
Performance optimization
Adjust buffer sizes and flush intervals: e.g., Logstash’s pipeline.workers or Fluentd’s time_slice_wait and buffer settings. Profile memory/CPU usage under realistic load and tune worker/concurrency counts accordingly.
-
Monitoring setup
Enable logging of split success and error counts with internal metrics. For example, Logstash supports metric filters, while Fluentd plugins expose internal buffers and retry counts.
-
Documentation
Record log formats, split logic, and edge cases. Maintain versioned config files including regular expressions and tag conventions.
3. Example Implementation
To bring everything together, this example demonstrates how log splitting is implemented in practice using Logstash. You’ll see a complete configuration with before-and-after outputs.
Example: Logstash splitting JSON arrays into per-event messages
input {
  file { path => "/var/log/app/records.json"; start_position => "beginning"; sincedb_path=>"/dev/null" }
}
filter {
  json { source => "message"; target => "msg" }
  split { field => "[msg][records]" }
}output
 {  file { path => "/tmp/split_events.json"; codec => "json" }
}- Before: a single message like
{"records": [{…}, {…}, …]} - After: multiple lines, each
{"msg": {"records": {...}}} - Parameters:
jsonfilter parses;splitduplicates other fields and writes separate events
Troubleshooting tips:
- Wrap JSON decoding in if checks to handle malformed messages.
- Check file input’s multiline settings, especially for stack traces.
- Use
stdout { codec => rubydebug }for quick inspection during development.
Best Practices and Common Pitfalls
Log splitting may seem straightforward at first, but real-world log data is messy, inconsistent, and often unpredictable. Without careful planning, even well-intentioned configurations can lead to performance bottlenecks, inconsistent results, or worse, lost data. This section outlines essential best practices to follow for a successful implementation, along with common pitfalls to avoid as you refine your log processing pipeline.
Best Practices
Implementing log splitting effectively requires more than just a working regex pattern—it demands thoughtful design and ongoing optimization. Here are some best practices to guide your setup:
- Start simple: Begin with basic patterns that match the majority of your log formats. For instance, if you’re splitting on timestamps or newline characters, build your initial parsing rules around those. Tools like Grok or regex101 help visualize matches as you iterate.
- Validate thoroughly: Test your log splitting logic with a wide range of real and edge-case log samples. Use sandbox environments or mock log generators to simulate production data and avoid surprises later.
- Monitor performance: Keep an eye on how your log splitting impacts system resources. High-latency parsing or regex backtracking issues can bottleneck pipelines. Leverage Prometheus, Grafana, or your log processor’s built-in metrics to track CPU usage and throughput.
- Plan for scalability: Design your pipeline with future log volume growth in mind. Consider stream processing frameworks like Apache Flink or Logstash with Kafka for distributed log handling and scaling horizontally.
- Maintain consistency: Use standardized parsing rules across environments. Share patterns as reusable modules or templates and keep them environment-agnostic to reduce inconsistencies between dev, staging, and production.
- Document patterns: Maintain version-controlled documentation of your parsing rules and regex patterns using tools like Git or integrated config wikis. This helps new team members onboard faster and ensures smoother troubleshooting.
- Handle errors gracefully: Not all logs will match your patterns. Use fallback mechanisms such as tagging unparseable logs (_grokparsefailure in Logstash) or routing them to a quarantine index for later inspection.
Common Pitfalls to Avoid
While configuring log splitting, beware of these common missteps:
- Over-splitting: Splitting logs too granularly can create noise and reduce readability. For example, breaking a multiline Java stack trace into single-line entries loses its context.
- Performance degradation: Complex or greedy regex patterns can slow down parsing significantly. Avoid nested quantifiers or unbounded lookaheads unless absolutely necessary.
- Data loss: If parsing fails silently, key log information might be discarded. Always validate whether important fields like timestamps or error messages are preserved post-split.
- Inconsistent parsing: Running different rule sets across environments leads to confusion. Always align rules using centralized config repositories.
- Maintenance overhead: Avoid highly specific patterns that are hard to update. Modularize your logic to keep it adaptable.
- Ignoring edge cases: Logs often contain malformed lines, encodings, or partial records. Design your pipeline to detect and flag anomalies early.
By adhering to these best practices and steering clear of common pitfalls, you’ll build a log processing pipeline that is reliable, scalable, and easier to maintain.
Monitoring and Troubleshooting Log Splitting
Ensuring your log splitting system runs smoothly requires continuous monitoring of performance and accuracy. Focus on key metrics to catch issues early:
- Log processing rate – Volume of logs processed over time
- Parsing success rate – Share of logs successfully parsed
- Parsing error rate – Frequency of failed splits or dropped entries
These indicators help surface issues like log format changes, misconfigured rules, or system overloads before they impact downstream workflows.
Set up alerts to detect performance degradation or unusual parsing behavior. Tools like Datadog, Prometheus with Grafana, and Elastic Stack (ELK) offer dashboards and real-time alerting to flag anomalies.
When problems arise, start by reviewing raw logs. Look for malformed entries or new patterns not covered by current rules. Check for recent config changes tied to deployments. Tools like Logstash, Fluentd, and Graylog provide debug modes to trace how logs are processed.
Evaluate output quality by sampling logs to ensure fields are correctly extracted and complete. For structured formats like JSON or XML, schema validators help detect misaligned or missing data.
Optimize performance by refining regex rules, adjusting buffer sizes, or scaling horizontally. Regularly review and update parsing rules, version-control changes, and test updates in staging before production deployment.
Troubleshooting checklist:
- Review rule/config changes
- Check logs and dashboards
- Test failed logs with debug tools
- Validate output structure
- Monitor resource usage
- Revert or adjust parsing rules
Advanced Techniques and Future Considerations
As systems grow more complex, traditional log splitting methods may struggle to keep up. Advanced techniques and forward-thinking strategies can help future-proof your log processing pipeline. The points below highlight practical enhancements and forward-looking considerations.
- Dynamic Pattern Learning
Modern systems increasingly rely on dynamic pattern recognition powered by machine learning. Tools like Drain3 and LogAI enable online learning to adapt log parsing rules as new formats appear, reducing manual intervention.
- Streaming vs. Batch Processing
Choosing between streaming and batch depends on system requirements. Streaming platforms (e.g., Apache Kafka) offer real-time splitting and immediate insights, ideal for alerting or anomaly detection. Batch models (e.g., Hadoop-based workflows) remain suitable for archiving and retrospective analysis.
- Schema Evolution
As log structures change over time, maintaining compatibility is critical. Schema-on-read approaches (e.g., JSON, Avro) and schema versioning tools help detect and adapt to changes without breaking downstream processes.
- Integration with Observability Platforms
Linking split logs to metrics and traces enhances system observability. Platforms like OpenTelemetry support context propagation across traces, logs, and metrics, making it easier to debug complex distributed systems.
- Compliance and Governance
Log splitting pipelines must support regulatory requirements such as GDPR or HIPAA. This includes data masking, retention policies, and audit trails. Policy-driven log processing can enforce encryption, access control, and geographic storage rules.
- Emerging Trends
Looking forward, AI-powered log processing, real-time edge splitting for IoT, and adaptive pipelines using event stream processing engines (e.g., Apache Flink) are shaping the future of log management.
Conclusion
In today’s data-driven environments, the ability to split a single log into multiple logs is essential for effective log management. Complex applications often generate dense, multi-event log entries that obscure visibility and hinder monitoring, troubleshooting, and compliance. Log splitting transforms these entries into discrete, actionable events—making it easier to search logs, trigger accurate alerts, and optimize storage.
Throughout this guide, we covered when and why to split logs, the benefits of doing so, and the most common log-splitting scenarios. You learned about practical approaches like regex, delimiters, state machines, and machine learning. We also explored tools such as Logstash, Fluent Bit, and cloud-based options.
While the process can be complex, the key is to start simple. Begin with basic patterns and gradually introduce more advanced techniques as your system scales. Consistent validation, documentation, and performance monitoring will help ensure long-term success.
Identifying where log splitting could improve visibility or reduce bottlenecks is critical. For further learning, explore the documentation of your log tools or browse open-source examples on GitHub. By taking the first step, you’re on your way to building a more reliable and scalable observability pipeline.
Frequently Asked Questions About Splitting a Single Log into Multiple Logs
1. When should I split logs during my logging pipeline?
Split logs as early as possible—ideally during ingestion or forwarding. This ensures each event is properly indexed, stored, and analyzed without losing context.
2. What are the common mistakes when splitting logs?
Common issues include over-splitting, slow regex performance, inconsistent parsing rules across environments, and ignoring edge cases like malformed or partial log entries.
3. Can machine learning really help with log splitting?
Yes. Tools like Drain3 can learn log formats and automatically detect patterns. ML-based approaches are flexible but require more setup than rule-based methods.
4. Is log splitting necessary if I already use structured logging?
Even with structured logging, splitting may still be needed. Fields like arrays or nested records can contain multiple events that must be separated for better analysis.
5. How do I know if my current logs need splitting?
If a single log entry includes multiple actions, stack traces, or grouped records, or if alerts and queries return unclear results, log splitting is likely needed.
Resources:

