


Developers are continuing to transition to cloud-native technologies, and for good reason! While there are numerous benefits associated with switching to the cloud, it can also make troubleshooting more difficult, particularly when using a microservices approach. Therefore, it is imperative for organizations to have a framework to achieve comprehensive observability. This demand led to the rise of OpenTelemetry, an open-source framework used to unify standards of telemetry data collection.
What is OpenTelemetry used for? OpenTelemetry helps standardize and simplify observability data collection for logs, metrics, and traces. It is extremely helpful for cloud-based distributed architectures; without it, monitoring and troubleshooting these complex systems would require high amounts of valuable resources, and take too much time.
Unified observability is the key to gaining comprehensive insights into an application’s behavior and performance. Thus, understanding the benefits of OpenTelemetry is crucial for developers in particular, as it is the primary mechanism to achieve this goal. Continue reading to understand more about what OpenTelemetry is, and what its primary advantages are.
Key Takeaways
- OpenTelemetry provides a standardized way of collecting observability data, including logs, metrics, and traces. This unified method of observability works well with distributed systems commonly used in today’s cloud-native applications.
- With OpenTelemetry, users enjoy stronger observability due to more efficient telemetry data collection.
- OpenTelemetry’s standardized protocols and tools promote interoperability. Thus, users can share and correlate data across systems and platforms.
- The simplified method brought by OpenTelemetry reduces development overhead as it takes away manual instrumentation.
- OpenTelemetry’s solution helps avoid vendor lock-in because it’s an open-source and free framework. It’s also frequently updated with an active community with security in mind.
- While implementing OpenTelemetry can be complicated, leveraging tools like Edge Delta can simplify the process.
Advantages of OpenTelemetry
Achieving observability usually requires companies to use multiple tools at once. However, this approach is challenging when correlating data for unified observability due to data and tooling silos. This is where OpenTelemetry saves the day.
But how does OpenTelemetry work? This open-source framework provides a unified standard for capturing observability data like logs, metrics, and traces. With this framework, the infrastructures of modern cloud-native applications are easier to monitor. The standardization works well even with distributed architectures. The streamlining benefit brought by OpenTelemetry enhances the observability of software, improving monitoring, debugging, troubleshooting, and optimization.
Here are some other significant benefits gained by OpenTelemetry users:
Improved Observability
OpenTelemetry helps improve observability by efficiently gathering telemetry data to analyze a system’s behavior. It provides a comprehensive view of how requests are routed through a system, allowing users to track the request flow and identify faulty components.
Examples of performance bottlenecks are the following:
- Latency
- Errors
- Performance issues in software systems
You can look into the chain of events that resulted in a problem to find the root cause and troubleshoot quickly. OpenTelemetry streamlines the investigation and debugging processes. It also helps identify service dependencies. For instance, imagine a system which is constructed of several services which work together to perform a task. You services might include:
- Handling user accounts
- Processing payments
- Website Rendering
An example of a service dependency graph can be seen below:
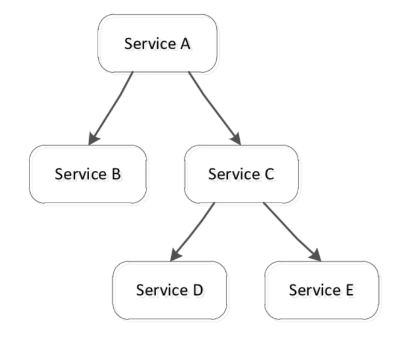
An example service dependence graph highlighting how different services interact with each other.
Image source: IEEE Service Dependency Graphs
OpenTelemetry helps monitor and understand how many of these services rely on each other within your system. However, its implementation can be complex and time-consuming. In some cases, users encounter compatibility issues. As such, migrating from another framework or custom instrumentation needs careful planning.
Note
The key is to leverage third-party tools like Edge Delta to adopt OpenTelemetry observability. With this tool, agents can automatically shape your logs into the OTel schema, reducing the work of moving off unstructured or custom formatted logs.
Standardization and Interoperability****
OpenTelemetry provides organizations with standardized protocols and tools (namely APIs and SDKs) for collecting, processing, and exporting observability data. With this standardization, users can easily share and correlate data across various systems and platforms.
Note
Users can implement OpenTelemetry using several programming languages, including Go, Ruby, Java, and Python. This feature makes instrumentation simple and consistent for developers.
With OpenTelemetry, users can simplify the integration of telemetry data into various monitoring and analytics platforms. This feature makes OpenTelemetry ideal for businesses seeking swift access to and comprehensive insights of their software’s performance and behavior.
Here are some examples of how OpenTelemetry simplifies the integration of telemetry data:
- API: Instrumentation for web frameworks, database clients, and message queues
- SDK: Plugins for exporting telemetry to popular observability tools and storage systems
This standardization promotes interoperability by enabling integration with several monitoring and analytics tools. As a result, organizations gain improved data exchange and collaboration across the board.
The following are some of the services already integrated with OpenTelemetry:
| Name | Open Source (OSS) |
|---|---|
| Azure SDKs | Yes (.NET) |
| Cerbos JS SDK | Yes (JavaScript) |
| Cisco NSO | No |
| Python | Yes (C++) |
| ClickHouse | Yes |
| Cloud Foundry | Yes |
| CollectorCloud | WeGo (Yes, Go) |
| Cortex | Yes (Go) |
| Dapr | Yes (Go) |
| Elasticsearch Java API Client | Yes (Java) |
| Flipt | Yes (Go) |
| FluentCI Engine | Yes (Rust) |
| Harbor | Yes (Go) |
| Jenkins | Yes (Java) |
| KafkaFlow | Yes (.NET) |
| Knative | Yes (Go) |
| Kong API Gateway | Yes (Lua) |
| Kong Mesh | No (Go) |
| Kuma | Yes (Go) |
| MassTransit .NET client | Yes (.NET) |
| Micrometer | Yes (Java) |
| MySQL Enterprise Server | No (C++) |
| Next.js | Yes (JavaScript) |
| NGINX Web Server | Yes (C++) |
| Open Policy Agent | Yes (Go) |
| Quarkus | Yes (Java) |
| RoadRunner | Yes (Go / PHP) |
| rustup | Yes (Rust) |
| Strimzi | Yes (Java) |
| Thanos | Yes (Go) |
| ThousandEyes (Cisco) | No |
Reduced Development Overhead****
OpenTelemetry tracing makes monitoring distributed systems easy. With its instrumentation libraries and APIs, users can automate end-to-end tracing for requests and processes. This feature saves time and effort, and in turn provides a more efficient and robust observability system.
Take this example in Python:
- Install the OpenTelemetry python library and an instrumentation package like Flask, a popular python-based web framework:
pip install opentelemetry-instrumentation-flask- Next, install the necessary packages and configure the agent. This is done by setting the export endpoint and sampling rate like this:
export OTEL_EXPORTER_OTLP_ENDPOINT="http://localhost:4317"export OTEL_SAMPLING_RATE=0.5
This command tells the agent to send all telemetry data to a local OpenTelemetry collector instance and sample 50% of the traces. Once done, Python will automate the capturing and sending of telemetry data without manual intervention.
OpenTelemetry eliminates the need for manual instrumentation, which significantly reduces the telemetry instrumentation overhead. This allows you to concentrate on building features and anticipating maintenance needs, Instead of spending time and resources getting OpenTelemetry configured within your architecture.
Pro Tip
OpenTelemetry supports both manual and auto-instrumentation. For flexibility, you may use auto-instrumentation by default to get the basic metrics and then add manual instrumentation to get additional metrics specific to your application.
OpenTelemetry’s unified view also makes observability far more cost-effective. There is no vendor lock-in, so you have more control over observability costs, and don’t need to worry about unifying non-standardized telemetry data across your services. This in turn reduces downtime, improves customer satisfaction, and increases revenue.
Vendor Agnostic and Community Driven
OpenTelemetry’s flexibility allows users to switch vendors if they are dissatisfied with their current observability stack. Users don’t have to worry about vendor lock-ins since OTel is compatible with a number of tools and services, including popular open source tools like Prometheus and Grafana.
Note
Some users aren’t clear on the differences between Prometheus and OpenTelemetry. At a high-level, prometheus is an open-source monitoring and alerting tool, which collects application and infrastructure metrics. On the other hand, OpenTelemetry is a standard for formatting telemetry data to enable simple aggregation across services. You can use them in tandem, which often works well.
OpenTelemetry continuously adapts to meet the expanding needs of most businesses. This is due to its vibrant community of contributors, who promote transparency and innovation. They also developed OpenTelemetry to support more programming languages and to be integrated with more observability platforms.
Below are some vendors who natively support OpenTelemetry:
| Organization | OSS | Commercial | Native OTLP (OpenTelemetry Protocol) |
|---|---|---|---|
| Jaeger | Yes | No | Yes |
| Grafana Labs | Yes | Yes | Yes |
| GreptimeDB | Yes | Yes | Yes |
| Highlight | Yes | Yes | Yes |
| HyperDX | Yes | Yes | Yes |
| observIQ | Yes | Yes | Yes |
| OpenObserve | Yes | Yes | Yes |
| gryn | Yes | Yes | Yes |
| Tracetest | Yes | Yes | Yes |
| Uptrace | Yes | Yes | Yes |
| VictoriaMetrics | Yes | Yes | Yes |
| Alibaba Cloud | No | Yes | Yes |
| AppDynamics (Cisco) | No | Yes | Yes |
| Aspecto | No | Yes | Yes |
| Axiom | No | Yes | Yes |
| Azure | No | Yes | No |
| Better Stack | No | Yes | Yes |
| Chronosphere | No | Yes | Yes |
| Controle Plane | No | Yes | Yes |
| Coralogix | No | Yes | Yes |
| Datadog | No | Yes | Yes |
| Dynatrace | No | Yes | Yes |
| F5 | No | Yes | Yes |
| Google Cloud Platform | No | Yes | Yes |
| Helios | No | Yes | Yes |
| Honeycomb | No | Yes | Yes |
| Immersive Fusion | No | Yes | Yes |
| Instana | No | Yes | Yes |
| ITRS | No | Yes | Yes |
| KloudMate | No | Yes | Yes |
| LogicMonitor | No | Yes | Yes |
| LogScale by Crowdstrike (Humio) | No | Yes | Yes |
| Logz.io | No | Yes | No |
| New Relic | No | Yes | Yes |
| Observe, Inc. | No | Yes | Yes |
| ObserveAny | No | Yes | Yes |
| OpenText | No | Yes | Yes |
| Oracle | No | Yes | Yes |
| Sentry | No | Yes | No |
| Sentry Software | No | Yes | Yes |
| Seq | No | Yes | Yes |
| ServiceNow Cloud Observability (Lightstep) | No | Yes | Yes |
| Splunk | No | Yes | Yes |
| Sumo Logic | No | Yes | Yes |
| TelemetryHub | No | Yes | Yes |
| Traceloop | No | Yes | Yes |
OpenTelemetry fosters innovation and collaboration in the observability space through dedicated communities and workspaces. These can be found on popular platforms like GitHub, Twitter, Slack and Discord.
Future-Proofing Observability Solutions
Future-proofing your observability solutions is incredibly important in this ever-competitive digital landscape. OpenTelemetry is designed to help you achieve this as it adapts to evolving technologies and best practices. As a source project of the Cloud Native Computing Foundation (CNCF), OpenTelemetry aligns with cloud-native principles. It ensures compatibility with emerging cloud-native architectures and telemetry standards. This forward-looking observability solution scales with your organization’s growing needs by ensuring that your observability capabilities remain adaptable.
For instance, if your workload increases, you can always scale the collector by adding more collector instances. The OpenTelemetry collector is designed to be scaled horizontally and can support various observability scenarios.
Conclusion
As more businesses begin to require unified observability, tools like OpenTelemetry will become more crucial. The benefits of OpenTelemetry show how teams and organizations can improve their operations with this tool. The standardization of OpenTelemetry simplifies the method of collecting observability data. With this feature, users enjoy a more efficient process to achieve observability. Leveraging it gives competitors a clear advantage over those still struggling with traditional monitoring and observability approaches.
Tools which process logs efficiently and scalably like Edge Delta complement this framework. With Edge Delta’s native support for OpenTelemetry Protocol, users can ingest OTLP-configured logs and metrics using Visual Pipelines. This feature allows customers to ingest OpenTelemetry data that is already structured and optimized out of the box.
FAQs on OpenTelemetry Benefits
What are the advantages of OpenTelemetry?
OpenTelemetry is the industry standard for observability data collection and processing. Its native libraries, plugins and packages make instrumentation and data collection simple. OpenTelemetry standardization is simple, as many services offer native OLTP integration, and it enables best-in-class observability pipelines to monitor and alert you of any system issues
What is the purpose of OpenTelemetry?
OpenTelemetry provides a set of technologies for capturing and exporting observability data, such as standardized protocols and tools. These resources can come from your cloud-native applications or infrastructure.
What are the advantages of Observability systems?
Observability systems keep everything in order and running smoothly. They enable real-time monitoring, quick identification of potential problems, troubleshooting, and additional analytics tools.
Why do we need an OpenTelemetry collector?
The OpenTelemetry collector facilitates the collection, analysis, and exportation of telemetry data in a vendor-neutral way. Without this tool, you must run, operate, and maintain multiple agents or collectors. It also aids in collecting host metrics like RAM, CPU, and storage capacity.

