

Observability is an essential concept, describing the ability to understand the internal state of a system based on its outputs. Observability tools provide visibility into a system, application, or infrastructure. They allow organizations to identify trends, resolve issues, and monitor the overall health of a system architecture.
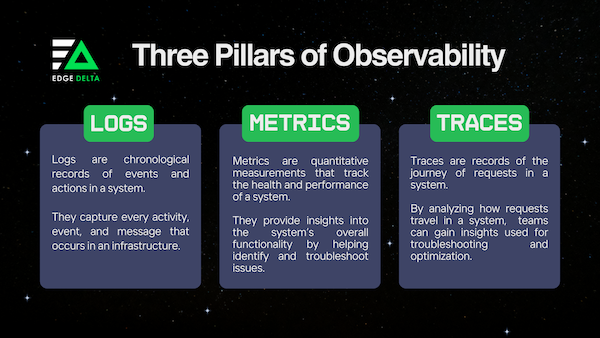
Three pillars serve as the cornerstone to understanding and managing the behavior of complex systems. These are logs, metrics, and traces. The three pillars of observability work together to provide insights into the internal state of a system.
True observability requires a deep comprehension of how the pillars interact and complement each other. Read on to learn more about each pillar and how they work together to achieve more efficient observability.
Key Takeaways
- Observability is the thorough process of collecting and analyzing data to comprehensively understand system performance, surpassing traditional monitoring.
- The three pillars of observability (logs, metrics, and traces) collaboratively provide a holistic system view, aiding troubleshooting and optimization efforts.
- Logs record detailed events crucial for troubleshooting and analysis but come with limitations when analyzed at scale, like cost and potential performance impact.
- Metrics offer quantitative insights into system aspects like CPU usage and error rates but face challenges like sampling and aggregation loss.
- Traces record request execution paths, facilitating troubleshooting and optimization by visualizing system interactions.
Looking Into the Three Observability Pillars: Logs, Metrics, and Traces
Observability refers to the process of collecting and analyzing data to understand the performance and behavior of a system. Compared to monitoring, observability is a much broader concept surrounding the ability to comprehend the internal state of an architecture.
As an approach, observability relies on three pillars: logs, metrics, and traces. Each pillar is crucial in providing organizations with the necessary visibility about their system and how to enhance it.
Logs provide detailed records of events that help you both identify anomalies and determine the root cause of issues. Metrics offer numerical data on system performance to analyze trends and monitor the system’s current state. Traces record the flow of requests and transactions in a system to provide a comprehensive view of the system’s components and overall behavior.
Check out the following sections for an in-depth discussion about each pillar.
Logs
Logs are records of events in an application or a network. They capture activities, errors, and conditions within a system. Logs are valuable for troubleshooting, analyzing, and monitoring a system’s health and performance.
A log file generally comprises machine-generated data from applications, databases, routers, and other components. It is automatically created when errors, logins, system configurations, and more happen.
Logs are crucial for understanding system behavior and diagnosing issues. They include a variety of pertinent data, such as:
- Timestamps
- User ID or IP Address
- Transaction ID
- Details About an Event or Error
As a pillar of observability, logs provide better visibility into the performance and health of a system. With tools like Edge Delta, collecting and storing logs is more manageable. Log entries are classified in a system so DevOps and platform teams can easily derive actionable insights, identify behavioral patterns, and troubleshoot issues.
Did You Know?
Up to 50% of your indexed log data might be unnecessary. It consumes valuable resources, so it is best to identify and remove useless log indexes. Discover 3 simple steps to eliminate low-value logs to reduce storage costs and improve the usability of your data.
Metrics
Metrics are numerical data sets that assess and analyze various aspects of a system—its performance, behavior, or characteristics. They help understand trends, identify anomalies, and make informed decisions to optimize performance.
Typically, metrics come from monitoring specific parameters within a system. Depending on how they are set up, you can get the following information by collecting metrics or key performance indicators (KPIs):
- CPU Usage
- Memory Utilization
- Error Rates
- Network Latency
- Response Time
Metrics are essential components of observability. They offer quantitative insights that are necessary for understanding and optimizing the performance of a network or system.
By processing metrics in real-time (or near-real-time), observability platforms allow teams to effectively regulate and enhance their systems. Such tools promote proactive problem-solving and offer advanced analytics to guarantee the performance of an application or network.
Did You Know?
The metrics you collect depend on your system, needs, and configurations. However, some common metrics are considered essential for observability. They are known as the “Four Golden Signals,” which include:
- Latency: The time it takes for a request to be processed
- Saturation: How resources are used (i.e., CPU or memory usage)
- Traffic: The volume and flow of requests in the system
- Errors: Rate of errors and exceptions that occurred
Traces
Traces are the records of a request’s or transaction’s execution path as they move through a system. They give a thorough chronological breakdown of the parts and services the request interacts with, along with the time spent at each stage.
Observability traces are formed through the “instrumentation of code” within the system. It can include events and timestamps as requests travel through the system. Once stitched together, the traces present detailed accounts of the journey of each request.
Traces hold data that are valuable for troubleshooting and optimizing system performance. Some of these data include:
- Duration of Operations
- Sequences of Services
- Root Cause of Errors
- Path of Requests
Being a pillar of observability, traces allow you to understand the intricate workings of your system. It provides a visual map of the requests’ journey, which gives a holistic understanding of how requests behave—making troubleshooting and optimization easier.
Limitations of the Three Pillars of Observability
While the pillars of observability have become indispensable in managing systems, it is important to acknowledge that they also have limitations. As organizations encounter more complex architectures, knowing and addressing the limitations of the pillars is necessary.
Below are the challenges of the three pillars of observability:
Logs
While logs are a valuable source of information for observability, they come with the following limitations:
- Volume and Storage: It can be easy to generate logs, which means they can consume a massive volume of data—especially for systems with numerous complex components. According to a recent survey, log data has grown 5x over the past three years. Storing and managing the log data may require significant infrastructure resources, which can be expensive.
- Unstructured Data: Logs are often unstructured or semi-structured. It can be challenging to analyze data and extract insights in such formats. Organizations might need additional processing or resources to parse and interpret the data. There are some tools in the market that can automatically structure your logs.
- Performance Impact: High log generation rates can affect the system’s overall performance. It may be challenging to read a log file and find the relevant information when an issue arises if an excessive number of logs are collected.
- Limited Context: While logs are valuable, they may lack the context necessary to understand the complete picture. Even if a log shows “operation failed,” you must investigate which component failed and why.
Metrics
Besides logs, metrics also come with drawbacks. Some of these are:
- Sampling Rate: The sampling rate is the frequency at which metrics are collected. The challenge here is determining the right balance. Too many samples can overload your observability platform and impact performance, while too few can create a risk of missing critical events or inaccurate system representation.
- Aggregation Loss: Often, metrics are aggregated to provide a summarized view. The problem is aggregating metrics can lead to loss of detail. It can make it more challenging to identify production issues.
- Limited Dimensions: Metrics are set up to capture a specific set of dimensions like CPU usage, memory utilization, and more. For some systems, a predefined set of dimensions may not provide a full context about the status and health of an application or network.
- Time Resolution: In observability, you need to understand the health and performance of a system over different time intervals. Determining the right time resolution is critical, so you can balance capturing enough detail to understand short-term variations and maintaining a broader view of long-term trends.
Traces
Traces are vital in creating insights using the flow of requests across the components of a system. However, it has its set of limitations, like:
- Instrumentation Overhead: Traces are formed through the instrumentations of code. However, the instrumentation may raise some level of overhead that can affect the application performance and bring latency.
- Sampling Challenges: Like metrics, traces also depend on sampling. Determining the appropriate sampling rate may be challenging. The rate must provide enough representative traces without overwhelming the system.
- High Costs: Tracing generates a considerable amount of data, especially in systems with a high transaction rate. Storing this data for analysis can be expensive, both in terms of storage infrastructure and associated costs.
- Complexity: Tracing interactions in a complex system can produce intricate visualizations, which might be challenging for an analysis.
- Incomplete Visibility: Traces do not capture every request, service, and component. This means there can be gaps in how end-to-end transactions are presented, which can also affect the insights.
How Logs, Metrics, and Traces Work Together
The three pillars of observability serve distinct functions. Logs chronicle events, providing a detailed narrative. Metrics quantify system health, offering performance insights. Traces identify bottlenecks and system component relationships, facilitating issue diagnosis. Together, they form a comprehensive framework for observability.
By integrating these three elements, organizations get a comprehensive interpretation of their systems. The observability pillars enable effective monitoring, troubleshooting, and optimization for better system performance and reliability.
How Edge Delta Works on The Pillars of Observability
Edge Delta is an automated observability platform, that can help you derive insights from your logs and metrics with little-to-no effort. It works out-of-the-box, without the need for you to change code, define alert conditions, or build dashboards.
Regardless of the format, Edge Delta ingests all your data into a massively scalable storage system.
Edge Delta also uses AI to automatically identify anomalies in your data, which eliminates the need for manual threshold setting. This allows organizations to catch issues faster and more accurately. When you do identify anomalies, it also provides guidance to determine the root cause of the issue.
Edge Delta is regarded as a cost-effective observability solution by storing all data in object storage and eliminating unnecessary processing with AI. With it, organizations no longer have to spend on separate resources for collecting, storing, and analyzing their logs and metrics.
FAQs on the Three Pillars of Observability
Who uses observability?
Observability solutions are used by several engineering roles, including IT operations, site reliability engineers, cloud and platform teams, application developers, and product owners.
What are the phases of observability?
Observability has three phases: Know, Triage, and Understand. The first one refers to knowing the problem at hand. Identify what is the issue and why alerts are sent to you. Next, triage the problem to understand the issue and how it affects the system. Lastly, the third phase is about understanding the problem. Engineers must be able to locate and comprehend the issue to resolve it.
What is the purpose of observability?
Observability provides visibility into a system to maximize performance and health. It helps organizations make data-driven decisions, optimize performance, and troubleshoot issues.

