


What you do from there has a lot to do with the maturity of your observability stack, your architecture, your team, your playbook, and which platforms you’re using. These observability platforms track data across a range of logs, metrics, APM, and traces to primarily allow you to visualize, alert, and root cause / remediate potential production issues. When it comes to visualization, just how much data (1KB, 1MB, 1GB, 100GB, 1TB, 100TB, 1PB) can the human eye see on a dashboard?
We’ve all seen a variation of “the data growth chart” – you know the one:

A growing problem
Data is exponentially growing, we’re going to create more data in 2021 and 2022 than in all of the last 5,000 years combined, yada yada yada… so we’re already at the point where there are massive volumes of data being created in real time. Those volumes are far more than what we could ever elegantly jam into a few thousand pixels. How much of that data then is needed to give the “full” picture of a prod service? Let’s try an exercise, for this example we’ll use logs in Splunk…
Pop Quiz – Below are two mini Splunk Dashboards (A and B) that track 400s/500s on top and HTTP response times on the bottom. Can you guess which one was created from 2.79 TBs and which one from 20 GBs?
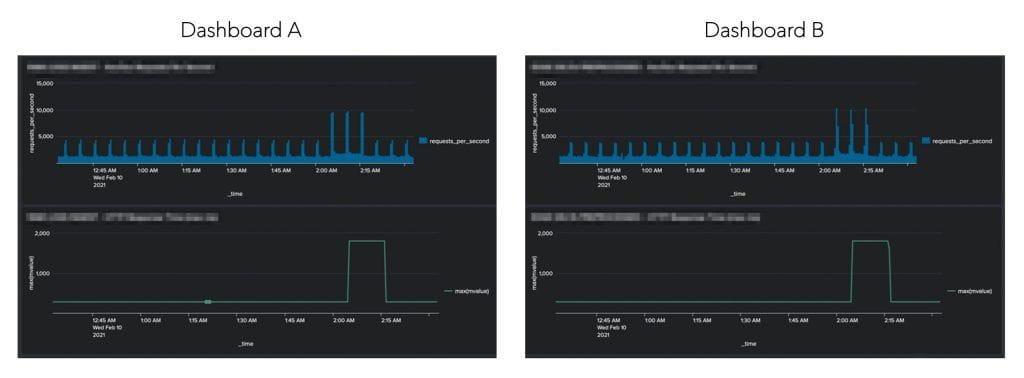
Despite the fact that one dashboard is derived from 99.3% less underlying data, the dashboards are remarkably similar. In addition, if you had set alerting thresholds, with logic of either 5,000 errors per second, or response times of over 1,000 ms – in both cases your alert would have fired, so the end result is the same. In fact, in some cases the dashboard/alert would have actually been identical. Although Dashboard A was created from about 140 X more data than Dashboard B, this fact is actually fairly irrelevant. There is a point after which the granularity surpasses the level of which it makes a difference at the pixel level, and the same concept applies to alert logic. This begs the question – as a DevOps team, do we need to put every log or metric into our Splunk, and if not, what are these points of diminishing returns?
It’s all context…
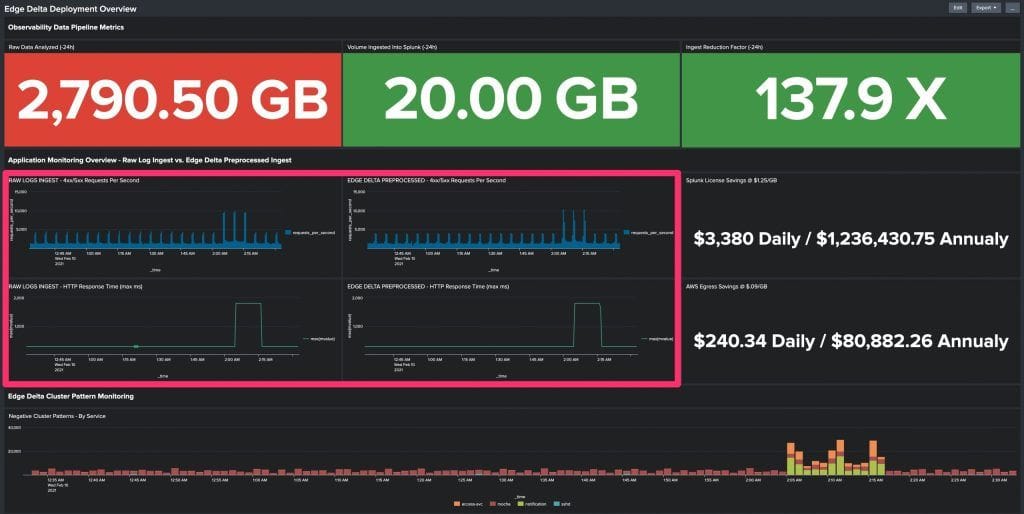
Zooming out we can see that the previous monitors were both contained within the larger dashboard:
As the volumes of data continue to grow exponentially, the trend is that DevOps and SRE teams are starting to become aware of this phenomenon. They have begun to use methods, some which are more primitive (sampling), and others that are slightly more advanced (pre-processing and pre-aggregation). There are also some newer innovative approaches being explored by adding simple machine learning concepts to the mix, opening up a new world of possibilities and functionality previously not possible in observability platforms, but we won’t dive into those topics here.
Instead, if we focus on the right side of the dashboard, we see something very interesting… assuming you’re putting 2.8 TB/day into Splunk, between Splunk License and AWS Egress costs – 99.3% of your cost might have no material effect on your dashboards and alerts. The bottom line is that you could be pouring millions of additional dollars into your observability platform with very little incremental value.
So, what’s next?
Well – we need to think before we send all that raw data into our observability platform. Oh, and if we question whether root causing an issue is achievable without all our raw data in one spot, the answer might be that we could consider utilizing anomaly captures.


