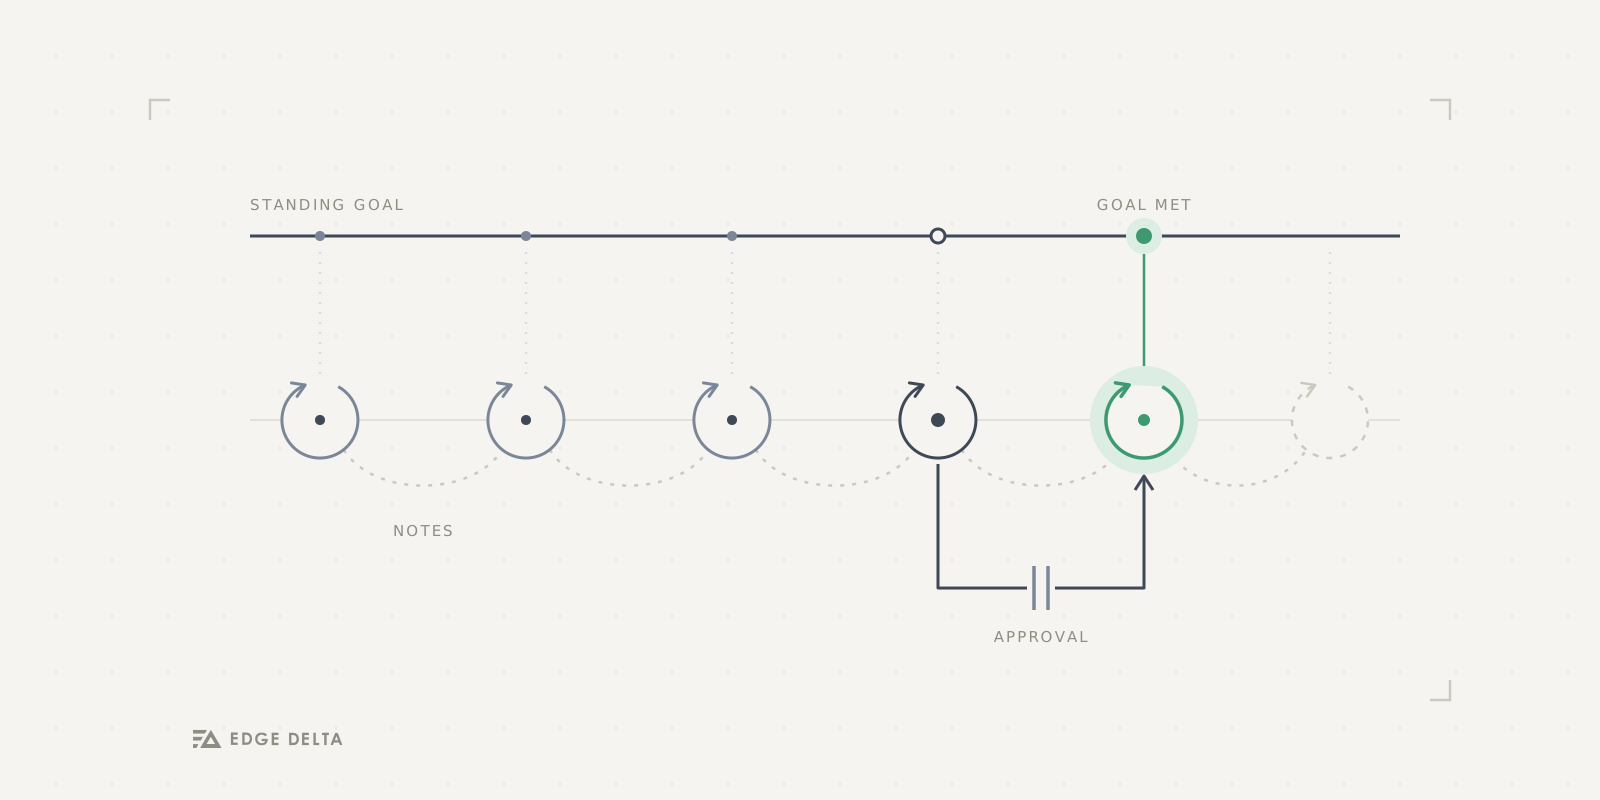

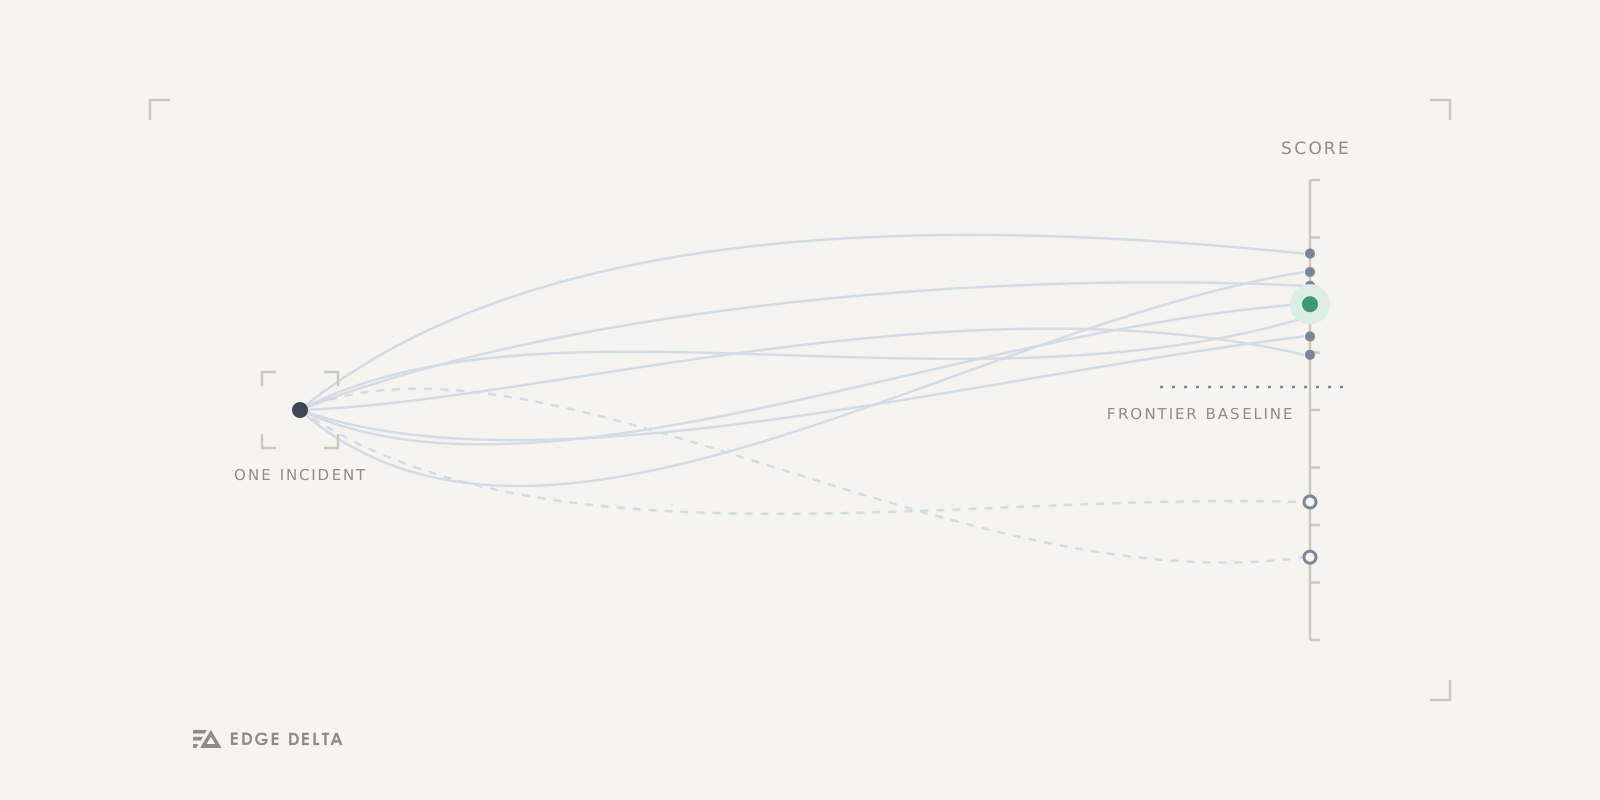
Writing tests for deterministic functions is straightforward. Define inputs and expected outputs, then check whether the function completes that mapping. It’s a core part of software development, ensuring each piece works as intended before it joins the wider system.
Evaluating non-deterministic tasks is harder. Agent behavior is often path-dependent and has to be judged rather than checked against a fixed answer. That’s the real challenge with agent evaluation. And if you can’t measure an agent, you can’t improve its performance in any structured way.
When building Edge Delta’s AI Teammates, our engineering team put real effort into measuring agent performance, and into being honest about what those metrics can and can’t tell us. That honesty is what lets us actually improve the agents over time, and create an observability platform truly powered by AI to help automate incident detection and response.
In this post, we’ll walk through how we approached the performance measurement problem, and why it leads to better agentic outcomes for our users.
Benchmarking the wrong system
Eyeball a few transcripts and ship on vibes. Or, more seductively, benchmark the underlying model in isolation, which tells you almost nothing about your agent. The loop, the tools, the compaction, the memory retrieval, the grounding are the parts that actually determine whether an incident gets solved. A great model inside a mediocre setup loses to a good model inside a great one. Benchmarking the model is measuring the wrong system.
Benchmark the whole agent
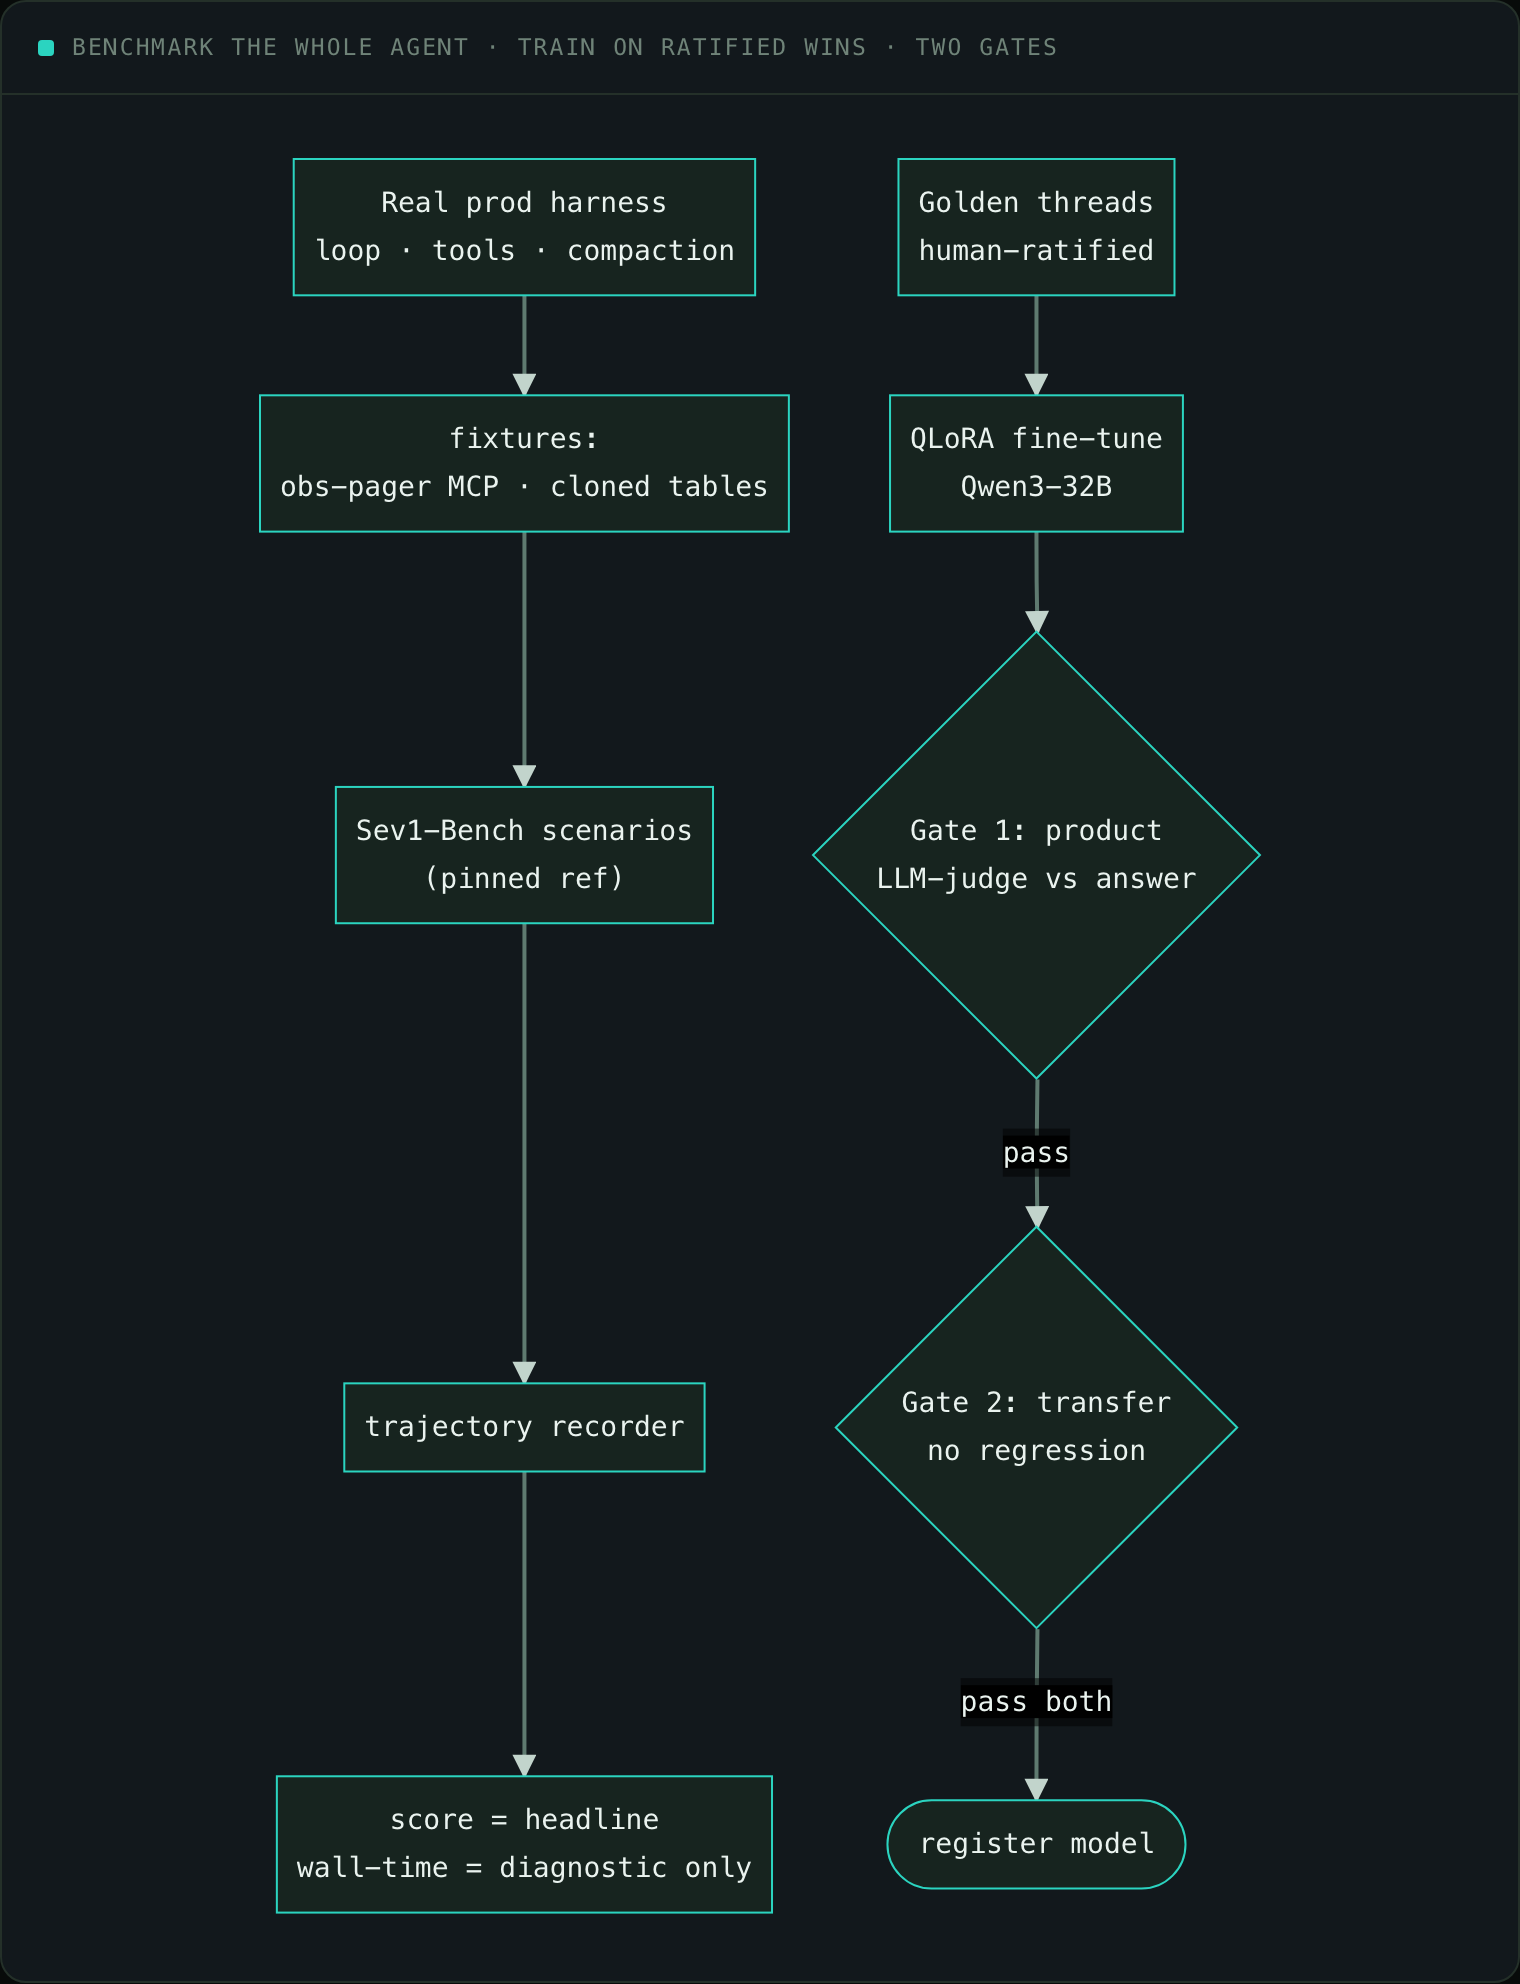
Our Sev1-Bench adapter runs the real production stack against a benchmark of realistic incidents: the same agent loop, tool executor, model client, and compaction that runs in prod. We isolate only the minimum: DynamoDB tables become suffixed clones via an override, and the live pager/observability connectors are swapped for a single fixture MCP server registered as a first-class custom connector, with its credentials encrypted through the same security provider as prod so the decryption path is unchanged. Everything else runs exactly as deployed, against scenarios pinned to an exact version so a score is reproducible against a known rubric.
And we are upfront about the tradeoffs. A trajectory recorder taps the in-process event bus. Because that event manager is a per-process singleton, the recorder has to live inside the runner’s process, so we refuse to auto-launch it and make the restart deliberate rather than magic. Local Restate and Redis are slower than deployed infrastructure, so score is the headline metric and wall-time is explicitly diagnostic only. Measuring a distributed agent perturbs its timing; publishing that timing as if it were production latency would be dishonest, so we don’t.
Training on your own wins, carefully
The second half closes a loop from outcomes back into capability. We mine “golden threads” from production: past incidents where the teammate found the correct root cause, confirmed by a resolution action. The mining is read-only and gated behind an explicit confirmation flag. Candidates are tagged strong or medium, and a human must ratify each one, because at fewer than a thousand examples a handful of mislabeled threads visibly poisons the fine-tune. Extraction pulls the full message trajectory from the datastore (not from logs, which truncate around 114KB and drop the final answer), and it’s full of non-obvious hazards we handle explicitly:
- Tool-name canonicalisation. The runtime prefixes tools with an instance-specific hash (
tdfb__get_log_search) that would teach the model tokens no other org has, so we rewrite them to a stable<type>__<tool>form and alias back at serving time. - Secret scrubbing, tuned for telemetry: redact bearer tokens, AWS keys, JWTs and connection-string credentials, but deliberately no bare high-entropy heuristic, because telemetry is full of legitimate high-entropy strings (ULIDs, trace IDs) and nuking those would corrupt the training signal.
- Deterministic splits. Train and eval are partitioned by hashed thread ID so re-runs are reproducible.
The result is a QLoRA fine-tune of Qwen3-32B (trained on a single H100, ~$10–40 a run, served with an extended context window via vLLM). Before any such model goes near production it must clear two gates:
- Product gate: an LLM judge scores it against the ratified answer on held-out golden threads, with frontier models run through the same judge as baselines.
- Transfer gate: public root-cause benchmarks with a hard no-regression bar versus the base model, because narrow fine-tunes quietly erode general reasoning.
Training data and benchmark scenarios are kept strictly disjoint, or the comparison is worthless.
Build-it-yourself reality check
Evaluating non-deterministic agents is a crucial part of building AI-native observability, yet it’s a discipline most teams skip. That’s why so many “AI SRE” demos never survive contact with real production incidents. A well-built evaluation rig has to exercise your whole stack, not just a model in a vacuum. It needs human-ratified ground truths mined from real outcomes, fair judgment across baselines, and explicit guards against data leakage and memory loss. Skip any of that, and you’re just guessing at what’s an improvement and what’s a regression.
Edge Delta’s AI Teammates find and resolve production incidents. But they’re also built on a comprehensive testing suite that ensures they improve over time, adapting to your systems as they learn.
Want to see it for yourself? Get started with a free trial and activate your observability agents in minutes.