


Log levels are crucial in software development and operations since they categorize the severity of logs in an IT infrastructure or a cloud-based computing environment. With log levels, teams can determine whether an event is critical or non-critical. They also help detect the affected system or application components. Thus, log levels improve debugging and monitoring to maintain system performance and reliability.
IT professionals categorize log levels based on their type and severity. With this practice, they can prioritize addressing significant events to prevent them from gravely impacting the system. The following logging levels organize the framework: Debug, Info, Warn, Error, and Fatal, with trace signifying the lowest priority and Fatal having the highest priority.
To better understand the importance of log levels, this article will explain each and the best practices involved.
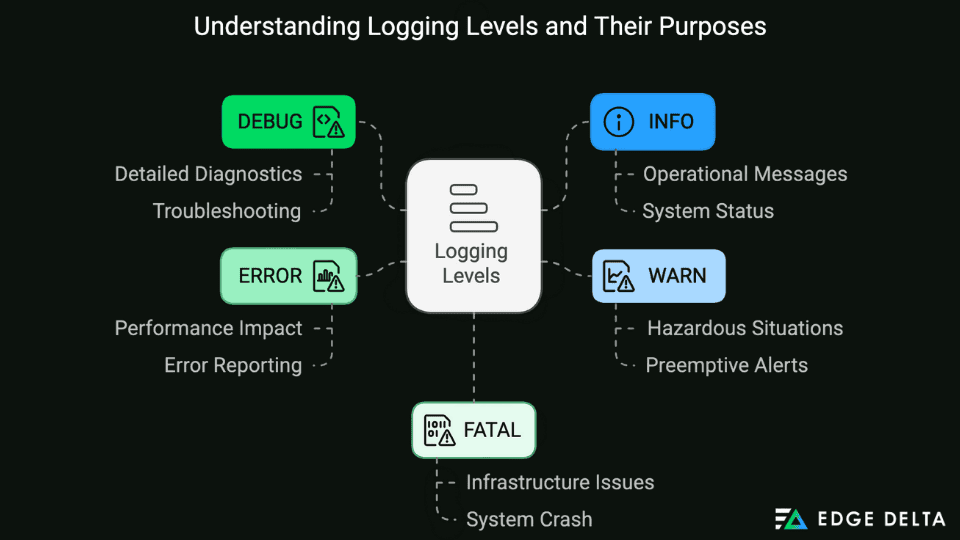
Key Takeaways- Log levels are logging categories IT professionals use to determine the type and severity of system events recorded through logs. These levels include DEBUG, INFO, WARN, ERROR, and FATAL.
- The DEBUG and INFO levels offer information for diagnosing, troubleshooting, and logging operations. Meanwhile, WARN, ERROR, and FATAL alert users when potential severe infrastructure issues arise.
- With the log-level infrastructure, IT teams can have a filtering mechanism to narrow data down for a more organized analysis. It consists of the logging framework configured to support several log levels and the application code designed to make logging requests.
- Deciding which logging level to use for different messages is crucial for an effective strategy; each log level serves distinct purposes and is suitable for specific events.
Understanding Logging Levels
In IT infrastructures, log levels act as an alert system and help determine critical issues that need immediate action by categorizing log messages and improving log management. They establish a log-level hierarchy that allows teams to prioritize urgent issues.
Establishing logging levels is essential to prevent issues like alert fatigue, high-volume logs, and information overload within the IT organization. The log-level infrastructure serves as an available filtering mechanism. It narrows and organizes analyses based on their severity levels and reduces the scope of log analysis, prioritizing the significant issues that require immediate attention.
| Logging Level | Description | Use Case |
|---|---|---|
| Debug | Detailed information for diagnosing issues | Developing and troubleshooting within the test environment |
| Info | General operational messages | Tracking typical operations and application flow |
| Warn | Potentially harmful situations | Detecting potential and significant issues |
| Error | Error events that still allow the app to continue running | Alerting teams for critical issues that need attention |
| Fatal | Very severe error events that lead to app termination | Requiring immediate attention, such as application shutdown |
The following section explains each log level in detail.
Detailed Explanation of Each Logging Level
Developing a comprehensive logging strategy and technique for your organization’s applications hinges on a thorough understanding and proper utilization of log levels. The log-level system is made up of two components:
- The logging framework is configured to support multiple logging levels.
- The application code makes logging requests.
Here’s a table summarizing the significant differences of each logging level.
| Log Level | Verbosity | Impact on Performance | Typical Use Cases | Sample Log Message |
|---|---|---|---|---|
| Debug | High | High | Development, troubleshooting, and method result output | log.debug(“Debug Message!”); |
| Info | Medium | Medium | Normal operations and reporting initialization | log.info(“Info Message!”); |
| Warn | Low | Low | Potential issues and to log deprecated usage warnings | log.warn(“Warn Message!”); |
| Error | Low | Medium | Critical errors and unexpected exceptions | log.error(“Error Message!”); |
| Fatal | Very Low | High | App termination and unrecoverable crashes or hangs | log.fatal(“Fatal Message!”); |
Debug Level: Capturing Extensive Diagnostic Data for Troubleshooting
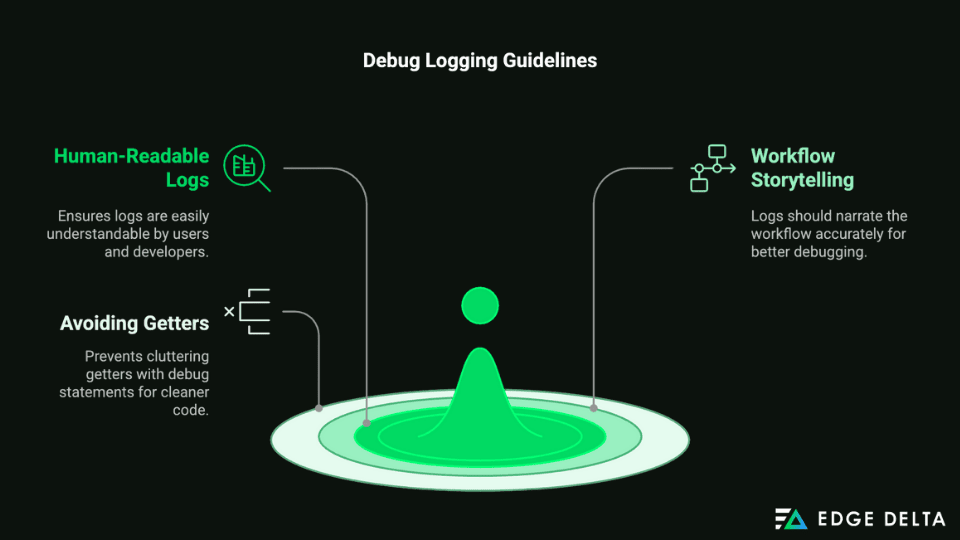
The debug level captures extensive diagnostic information and third-party library issues. IT professionals use it to understand the internal state and flow of the application using extremely granular verbosity. It is commonly employed during application development and debugging sessions.
Several guidelines should be considered when integrating debug logs into your system, such as:
- Ensuring logs are human-readable
- Confirming if logs tell the story of your workflow
- Not putting debug statements in getters
Sample Scenario:
One example of the debug level use case is during the developmental stage when the developer is trying to understand a new behavior of a complex algorithm that processes user data. Other events that are usually logged at the DEBUG level include the following:
- Data queries that aid in identifying performance bottlenecks and issues related to data manipulation or retrieval
- External API details, including calls and their responses
- Configuration values that support mismatched settings and misconfigured troubleshooting
- Timing information, including the method executions and duration of specific operations
Here’s an example of how to write debug logs.
logger.debug(
  {
    query: 'SELECT * FROM users WHERE age >= 23',
    time_taken_ms: 2.49,
  },
  'Select 23+ users from the database'
);
Info Level: Logging High-Level Operational Messages
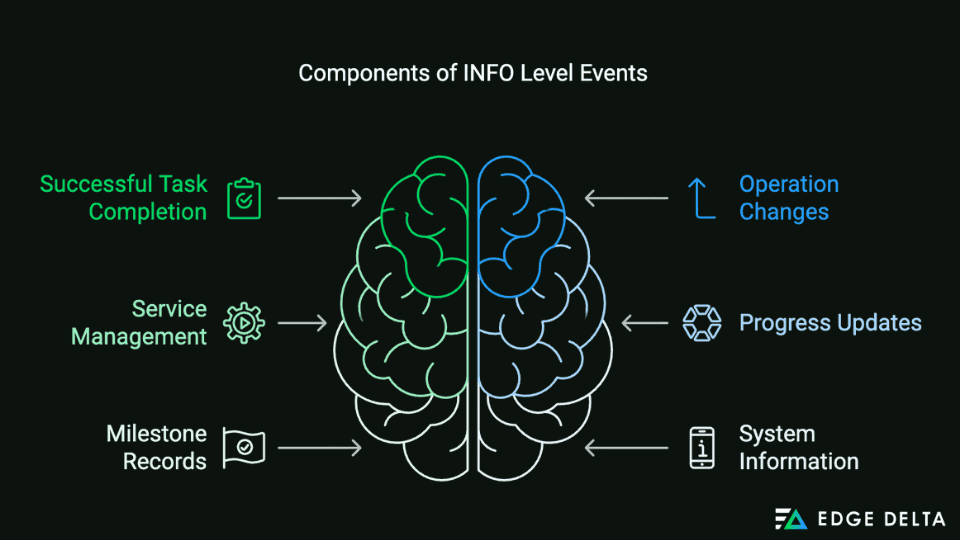
The Info level is usually used to log high-level operational messages. These logs capture and confirm system events relevant to the application’s business purpose. Additionally, they confirm that the system usually functions and provides a clear workflow and overview of event milestones.
Events that are typically at the INFO level comprise the following details:
- The successful completion of events or scheduled tasks
- Operation changes like transitioning from pending to in-progress
- Stopping or starting application components or services
- Progress updates during long-running processes or tasks
- Vital milestones records or significant events within the application
- System information includes using health checks or status reports
Here’s an example of an Info log level message:
log.Info("User login successful:", username)logger.Info("Starting notification scheduler...");
Below is another example of how to log at the info level utilizing the Semantic Logger framework for Ruby programs:
require 'semantic_logger' SemanticLogger.add_appender(io: $stdout, formatter: :json) logger = SemanticLogger['MyApp'] logger.info('API request to /api/v1/users completed successfully', method: 'GET', status_code: 200, elapsed_ : 212, endpoint: '/api/v1/users')
Warn Level: Flagging Potential Hazardous Situations
Events logged at the warning level flag a potentially hazardous situation, but the application can continue operating now. These logs serve as an indicator and early warning for conditions requiring immediate attention before they escalate into problems for the application.
Examples of events that are logged in the Warn level include the following:
- Application errors that are recoverable and obtain minimal impact
- Outdated configuration settings needing revisions based on recommended practices
- External API response times exceeding acceptable thresholds
- Resource consumption surpassing predefined thresholds, including memory, CPU, and bandwidth
- Excessive failed login attempts indicating potential security threats
Here’s an example of a basic warn-level log message.
logger.Warn($"ContractsQueue key not found in configFile, " +
  "using default value = {RabbitMqQueues.ContractsQueue}");
Here’s another example of a warning log created using Python’s logging module coupled with python-json-logger:
import logging
from pythonjsonlogger import jsonlogger
logHandler = logging.StreamHandler()
jsonHandler = logHandler.setFormatter(
    jsonlogger.JsonFormatter(
    "%(name)s % %(levelname)s(asctime)s %(filename)s %(lineno)s %(message)s",
     rename_fields={"levelname": "level", "asctime": "timestamp"},
     )
)
logger = logging.getLogger(__name__)
logger.addHandler(logHandler)
logger.warning("Disk usage warning", extra={"disk_usage": 85.2, "threshold": 80})
Error Level: Signaling Error that Hinders Applications Performance
The error-level logs signal error conditions that hinder the execution of the application’s specific operation. The application can continue running but at a reduced level of performance and functionality. When comparing log error vs. warm, these error logs signify more severe issues in the application and have a high level of urgency to prevent the application from being terminated.
Situations in the application that are typically logged at the error level mainly comprise the following:
- Service failure or external API that affects application functionality
- Network communication errors, which include DNS resolution failures and connection timeouts
- Occurrence of unexpected errors like failure to decode a JSON object
- Oversight in creating and updating resources in the system or application
Here’s an example demonstrating how you might record an error condition in your application using the Zap logging framework for Go:
func main() {
    logger := zap.Must(zap.NewProduction())
    defer logger.Sync()
    err := someThingThatCanFail()
    if err != nil {
        logger.Error(
            "an error occurred while doing something that can fail",
            zap.Error(err),
        )
    }
Another good use case for error logs is generic exception handlers. For example, for desktop projects:
app.DispatcherUnhandledException += (sender, a) => {
  log.Error(a.Exception);
};
AppDomain.CurrentDomain.UnhandledException += (sender, a) => {
  log.Error(a.ExceptionObject);
};
TaskScheduler.UnobservedTaskException += (sender, a) => {
  log.Error(a.Exception);
};
Fatal Level: Indicating Severe Infrastructure Issue
A fatal log level indicates a severe error event in the system that leads to application termination. Logging an entry at this level displays the critical failures that cause the system to become unusable or shut down. Typically, such entries are logged just before the application shuts down to prevent detrimental effects like data corruption.
Events that are logged as fatal errors include the following:
- Detection of security breaches and unauthorized access to sensitive data
- Default fallbacks and inclusions of configuration information
- Database and core application operations loss, which includes essential external dependencies or services
- Disk space or memory on the server runs out or becomes insufficient, leading to unresponsive applications
Here’s an example of how DevOps teams log at the fatal level employing the Pino framework for Node.js applications:
const pino = require('pino');
const logger = pino({
  formatters: {
    bindings: (bindings) => {
      return {
        env: process.env.NODE_ENV || 'production',
        server: process.env.server,
      };
    },
    level: (label) => {
      return { level: label };
    },
  },
});
logger.fatal(
  new Error('no space available for write operations'),
  'Disk space critically low'
);
process.exit(1);
The following section tackles the best practices for effectively using log levels to improve system infrastructure.
When fatal-level events hit, speed of response is critical — the SRE Teammate automatically investigates these signals, correlating them with metrics and logs to surface root cause before the outage becomes prolonged.
Best Practices for Using Logging Levels
Effective logging is crucial for monitoring the health and performance of modern IT operations. Properly using logging levels allows developers to understand application performance better. However, using logs effectively takes work.
A well-structured log level can help developers better understand complex systems and applications. Read on and learn the best practices in structuring and using logging levels.
1. Choosing the Right Logging Level
Deciding which logging level to use for different messages is crucial for an effective strategy. Each log level serves distinct purposes and is suitable for specific events.
Logging levels serve different purposes, which is the most crucial factor to consider. Here’s a list of these levels:
- DEBUG: for detailed debugging information
- INFO: for general information
- WARN: for potential issues
- ERROR: for errors that affect functionality
- FATAL: for critical errors resulting in app termination
Here’s a flowchart illustrating the decision to select a logging level based on message severity.
2. Maintaining Log Consistency
A standardized approach is required to gain consistent and reliable log levels across the codebase. Establish and define your organization’s logging standards, including your logging level in checks and reviews, and implement structured logging.
Structured logging is a modern and highly effective approach to logging. Each log entry adheres to a recognizable and consistent format that facilitates automated searching, analysis, and monitoring using log management tools. Moving to structured logging has the following advantages.
- Creates Standardization
- Maintains Consistency
- Develop cleaner and refactored code
- Helps Triaging Issues
- Enables Analytics
3. Performance Considerations
Logging can significantly impact application performance, especially at higher verbosity levels. Verbosity levels of logs are designed to discriminate highly diverse runtime events, which facilitates system failure identification through simple keyword searches. It is crucial to balance the need for detailed logs with performance overhead.
Here’s a table representing the performance impact of log levels and their verbosity value.
| Logging Level | Verbosity Value | Performance Impact |
|---|---|---|
| Debug | 5 | High |
| Info | 4 | Medium |
| Warn | 3 | Low |
| Error | 2 | Low |
| Fatal | 1 | Very Low |
To enhance log performance and utility, start by adjusting the format of the events and data in each log entry and consider the following mitigation practices for your log levels.
- Logging only when necessary and practice selective and dynamic logging levels
- Creating log timestamps as ISO-8601
- Using structured JSON logging
- Standardizing on string-based log levels
- Including log source information
- Standardizing your contextual fields
- Adding the build version or Git commit hash
- Capturing a stack trace when logging errors
- Using a correlation ID to group related logs
- Selectively logging object fields
4. Monitoring and Managing Logs
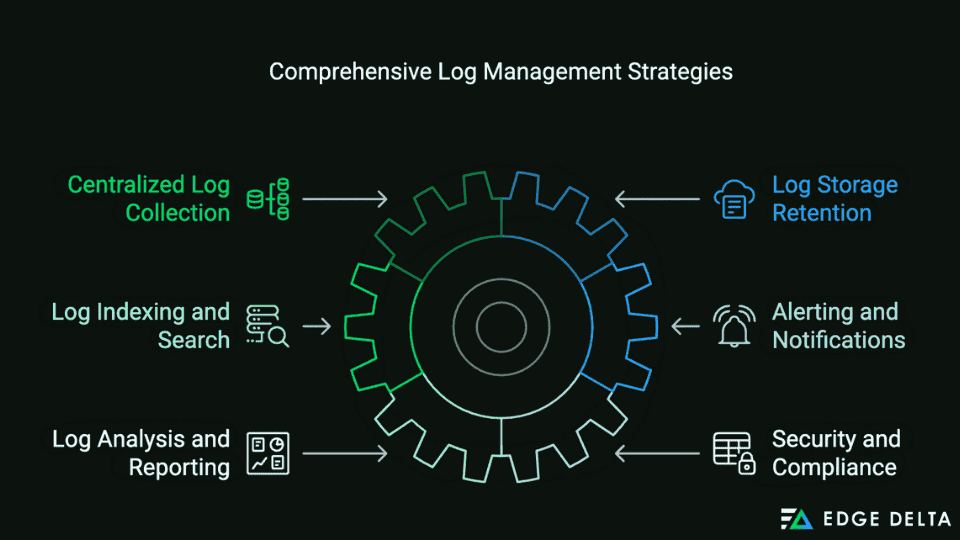
Setting up effective monitoring and management of logs is crucial for maintaining system health and identifying potential issues to ensure smooth operations. IT teams can enforce the following to establish robust monitoring and management for different log levels in the production environment.
- Centralized Log Collection: A centralized log aggregation tool collects logs from various sources and data. Deploy log collections on all relevant servers to forward logs into the central aggregator.
- Log Storage Retention: Store logs in scalable and reliable log storage, including a cloud-based and dedicated log storage system. Teams should also define log retention policies based on their regulatory requirements and importance.
- Log Indexing and Search: Ensure logs are properly indexed to enable fast and efficient searches. Additionally, it provides a user-friendly search interface for querying logs.
- Alerting and Notifications: Set up alerts based on predefined thresholds for different log levels. Moreover, configure notification challenges, which include SMS, emails, or other messaging apps to receive real-time alerts.
- Log Analysis and Reporting: Implement automated log analysis to detect anomalies, patterns, and potential security issues. Also, generate regular reports on log activity, obtain changes and trends, and share them with team members and relevant stakeholders.
- Security and Compliance: Implement strict access controls to ensure only authorized persons can access the logs. Utilize RBAC or role-based access controls to manage logs. Constantly audit your log practices and ensure compliance with industry regulations like HIPAA, PCI DSS, and GDR.
Wrap Up
Understanding the differences between logging levels is fundamental to effective log management. With a well-structured log level, IT and DevOps can quickly prioritize and filter logs based on their service and verbosity, leading to a more focused approach to critical events and creating meaningful alerts.
Implementing best practices and using log levels are crucial in maintaining system performance and visibility. By understanding and integrating appropriate log levels, teams can ensure their logging strategy is effective, leading to a more reliable IT infrastructure. The SRE Teammate uses log level signals to automatically triage and prioritize incidents, cutting time from alert to resolution.
FAQs on Log Debug vs. Info vs. Warn vs. Error And Fatal
What is the difference between debug and INFO in Loglevel?
DEBUG – Lowest level. Fine-grained statements concerning program state are typically used for debugging and are mainly used by developers. On the other hand, INFO – Informational statements concerning program state, representing program events or behavior tracking
What is the difference between an error and a warning log level?
The warn log level indicates potentially harmful situations. On the contrary, the ERROR level signifies error events in the application but still allows the application to continue running.
What is the hierarchy of log errors?
Log levels typically follow this order from lowest to highest: DEBUG – INFO – WARNING – ERROR – CRITICAL.
Sources:

