

As software teams continue to adopt observability into their systems, the need for different observability frameworks and tools to manage log, metric, and trace data continues to grow. Three such frameworks are OpenTelemetry, OpenTracing, and OpenMetrics. Since these three are often mentioned together (and have somewhat similar names), however, there is significant confusion about their distinctions.
While each of these frameworks provide APIs and instrumentation for transmitting telemetry data, they differ primarily by scope. OpenTracing focuses solely on distributed tracing data, OpenMetrics focuses solely on metric data, and OpenTelemetry focuses on all observability data in its entirety.
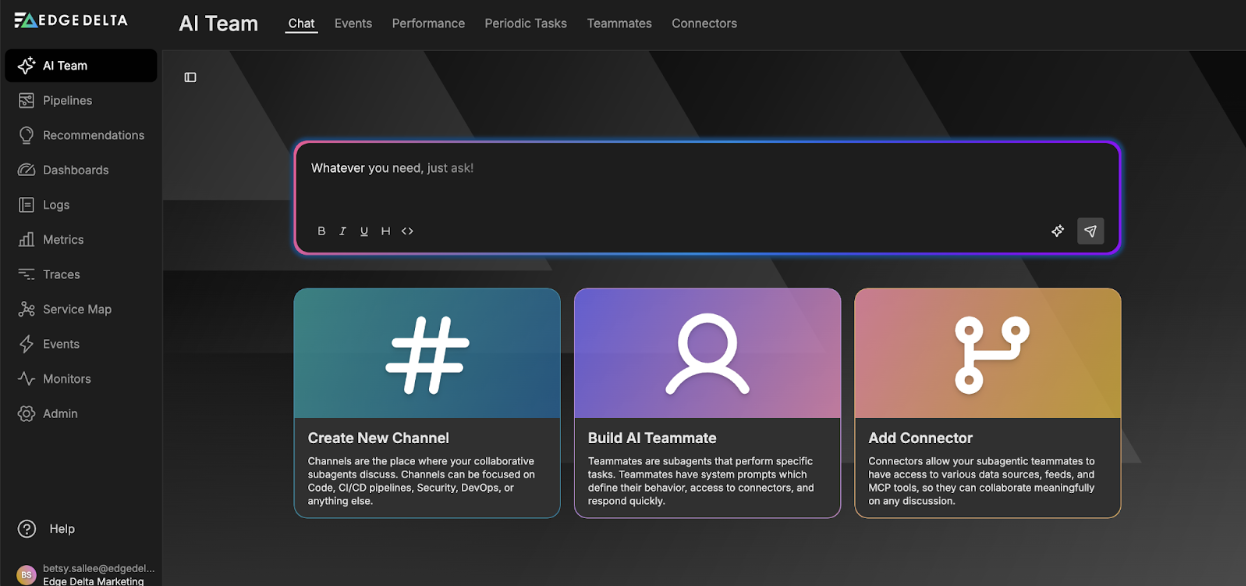
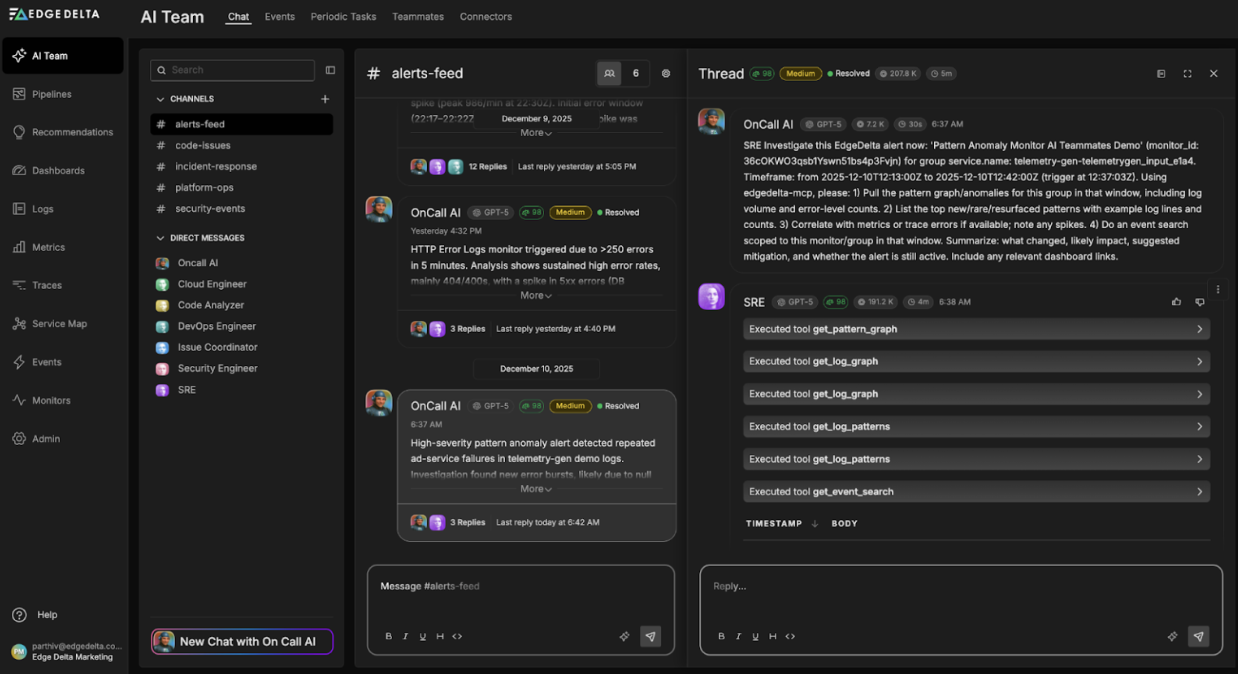
Automate workflows across SRE, DevOps, and Security
Edge Delta's AI Teammates is the only platform where telemetry data, observability, and AI form a self-improving iterative loop. It only takes a few minutes to get started.
Learn MoreWhen deciding how to integrate effective observability practices into your monitoring processes, it is important to understand how these frameworks are different on a fundamental level, to determine which is most valuable for you. Continue reading to dive into their similarities and differences.
Key Takeaways
- With OpenTelemetry, users can have a unified data collection and management approach. This framework covers all telemetry data, namely logs, metrics, and traces.
- OpenTracing focuses solely on tracing. It provides vendor-agnostic API specifications, frameworks, and libraries for easy instrumentation.
- OpenMetrics focuses solely on metrics. It offers a standardized method for transferring cloud-native metric data across services.
- Each of these three frameworks, have varying scopes, with OpenTelemetry having the largest. For most applications, OpenTelemetry should be used, as it is a standard for all observability data, instead of just one specific type.
An In-Depth Look at the Differences Between OpenTelemetry, OpenTracing, and OpenMetrics
OpenTelemetry, OpenTracing, and OpenMetrics each play a crucial part in the observability landscape. Here is a quick, practical overview of each framework:
- OpenTelemetry: Offers a unified method of collecting, generating, managing, and exporting observability data
- OpenTracing: Forms a common language around distributed traces and distributed trace instrumentation
- OpenMetrics: Defines guidelines for the transmission of metrics across services, at scale
And here is a side-by-side comparison:
| Point of Comparison | OpenTelemetry | OpenTracing | OpenMetrics |
|---|---|---|---|
| Observability Scope | Tracing, Metrics, Logging | Tracing only | Metrics only |
| Integration | Comprehensive support for numerous languages and platforms | Integration via existing tracers | Integration primarily using Prometheus |
| Use Cases | Unified Observability | Distributed tracing | Metrics collection and export |
| Standards | Merges OpenTracing and OpenCensus | Adheres to tracing specification | Standardizes Prometheus metrics |
| Ease of Use | Moderate, due to broad scope | High, focused on tracing | High, focused on metrics |
| Community Support | Strong, active development | Strong, foundational in tracing | Strong, used with Prometheus |
This is a solid overview – but let’s dig a little deeper into each framework.
What is OpenTelemetry? Pros and Cons + Key Features
OpenTelemetry is a unified, open-source observability framework that standardizes how telemetry data is collected and sent to a back-end platform. It provides a unified approach to generating, collecting, and managing telemetry data such as logs, metrics, and traces.
The OpenTelemetry project provides APIs, SDKs, libraries, agents, and collector services for infrastructure instrumentation. Data collected from the OpenTelemetry API is vendor-agnostic, allowing it to be exported to multiple downstream platforms, avoiding vendor lock-in.
Pro Tip
You can use this guide to learn how to set up OpenTelemetry for distributed tracing.
Besides distributed tracing, OpenTelemetry is used heavily for metrics monitoring, application performance monitoring, and context propagation.
You can implement the OpenTelemetry framework in many different programming languages, making instrumentation consistent and simple for developers. Supported languages include:
- Go
- Ruby
- Java
- Python
- C++
- Rust
- Swift
- C#/.NET
One of the benefits of using OpenTelemetry is that many libraries, services, and apps have native support. Here are some of them:
- Azure SDKs
- ClickHouse
- Cloud Foundry
- CloudWeGo
- Dapr
- Elasticsearch Java API Client
- Flipt
- FluentCI Engine
- KafkaFlow
- Knative
- Kong API Gateway
- Kuma
- MassTransit .NET client
- Thanos
- Cisco NSO
| Pros | Cons |
|---|---|
| Vendor-neutral | Compatibility and stability issues may arise as project scales |
| Supporting the three telemetry data types (logs, metrics, and traces) | If pre-existing codebase/infrastructure is complex, it can be challenging to implement |
| Integrates with many other observability tools and services | Transitioning from other standards/frameworks can be challenging and time-consuming |
| Offers end-to-end visibility with standard instrumentation | |
| Supports many programming languages | |
| Supported by an active community of organizations and developers, promoting enhancement releases, bug fixes, and more |
Key Features:
- Auto-instrumentation
- Vendor-neutral API for manual instrumentation
- Support for multiple languages and platforms
- Integration with various backends
- Complete transparency over the data being collected
What is OpenTracing? Pros and Cons + Key Features
In distributed cloud-native applications, tracking requests as they travel between services can be very challenging. Distributed tracing was established to solve this problem. The Cloud Native Computing Foundation (CNCF) developed the OpenTracing API guide and libraries to support distributed tracing as a service.
OpenTracing is an open-source, vendor-neutral project that provides instrumentation tools, and trace collection libraries for distributed applications. It was created to solve distributed tracing issues such as the inability to reuse instrumentation across networks and libraries. However, OpenTracing is now deprecated, as it merged with the observability framework OpenCensus to form OpenTelemetry. OpenTracing’s difference between OpenTelemetry is that it focuses solely on distributed tracing, while OpenTelemetry includes metrics and logs. That is the advantage of OpenTelemetry over OpenTracing.
Note
Here’s how to migrate from OpenTracing to Opentelemetry. Migrating existing applications is typically a straightforward process.
One use case of OpenTracing is in application code. Developers can use OpenTracing for things like describing causality or adding fine-grained logging information along the way, to name a few. OpenTracing was compatible with several programming languages and multiple tracing systems and backends:
- Python
- Go
- JavaScript
- Java
- Ruby
- PHP
- Objective-C
- C++
- C#
It also had lots of supported Tracing platforms:
- CNCF Jaeger
- LightStep
- Instana
- Apache SkyWalking
- InspectIT
- StageMonitor
- Datadog
- Wavefront by VMware
- Elastic APM
| Pros | Cons |
|---|---|
| Free from vendor-lock in | Lacks support for metrics and logs, which are crucial components of any observability solution |
| Efficient detection of latency issues | Lacks implementation, requiring you to own a separate tracing system that supports the OpenTracing API |
| Trace data can easily be forwarded to log processing platforms for query and analysis | Requires implementing different APIs for metrics, logs, and traces, which can be complex and cumbersome |
| Has intelligent error reporting – helpful for identifying root causes and cascading failures | Lacks context propagation and flexible sampling, which could have eliminated the need for writing additional code or using third-party libraries |
Key Features
- Helped trace requests from beginning to end across services
- Helped visualize distributed systems at scale
- Used for active span management
- Used for standardization of span management APIs
- Provided inter-process propagation APIs
What is OpenMetrics? Pros and Cons + Key Features
OpenMetrics is a metric standard that enables users to transmit cloud-native metrics at scale. It offers a vendor-agnostic model for collecting metrics. Large enterprises like Soundcloud, GitLab, DoorDash, and Grafana Labs all use OpenMetrics. It aims to convince vendors to emit metrics data in a specific format over HTTP. Providing a standard format for metrics data promotes interoperability between different monitoring systems.
Here is what a sample metric would look like, in the OpenMetrics format:
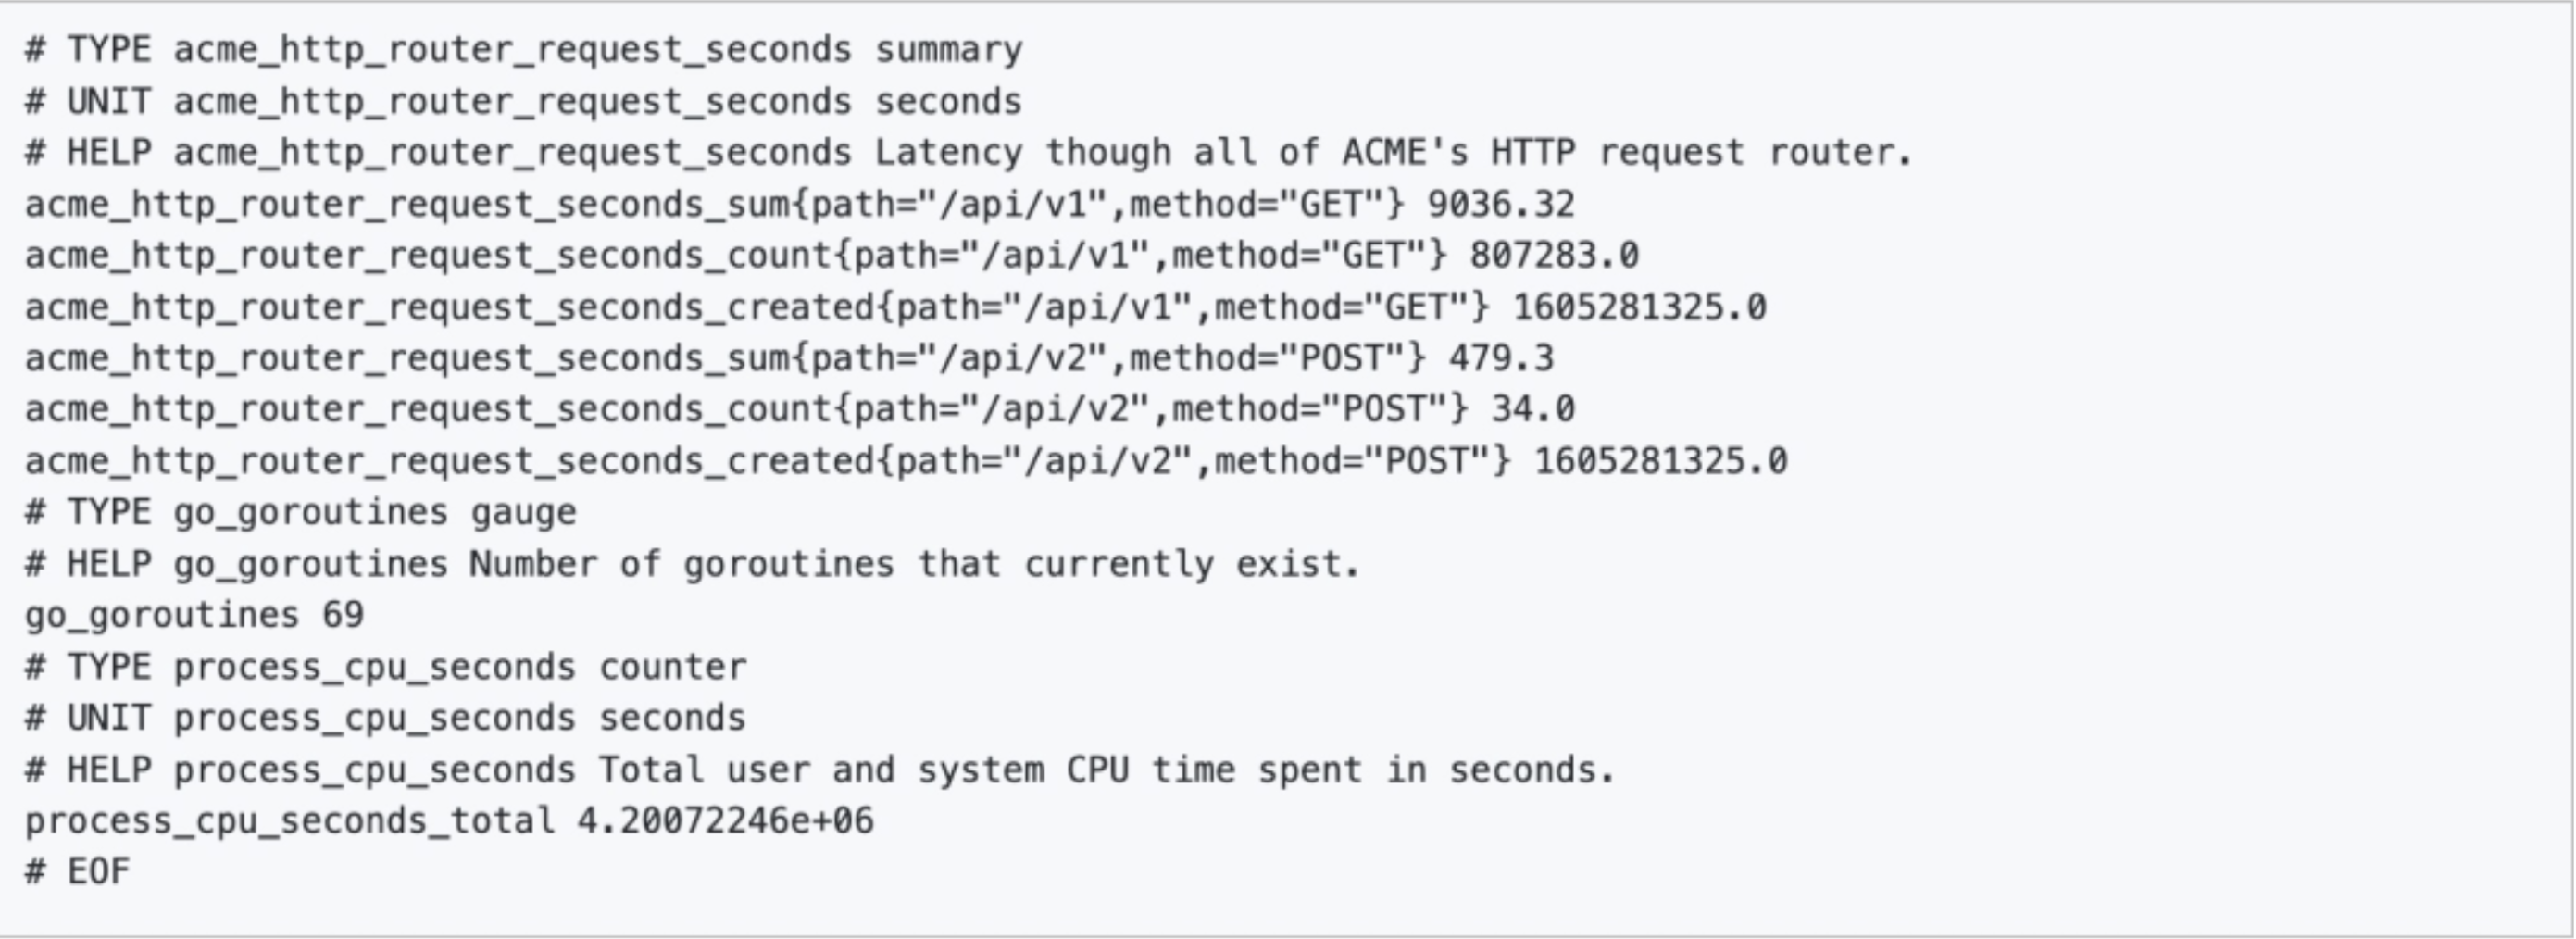
Additionally, OpenMetrics builds on Prometheus’ exposition format.
OpenMetrics vs Prometheus
Prometheus is an open-source monitoring and alerting tool for exposing and collecting time-series metrics. It is focused on metrics collection and displays metrics line-by-line in a text-based format.
OpenMetrics standardizes Prometheus’s work but has a tighter, cleaner, and more enhanced syntax. Its underlying specifications are the same as those of Prometheus. This feature includes the usage of PromQL.
Furthermore, both specify that clients expose metrics to the /metrics endpoint.
| Pros | Cons |
|---|---|
| Vendor agnostic | It only captures metrics. You must also collect logs and traces if you want a robust monitoring framework |
| Highly scalable metric protocol | Text-based format can lead to larger data payloads, which might have implications for data storage/transmission |
| Supports text representation protocols and protocol buffers | Tools and systems that support Prometheus-style metrics can quickly adopt and work with OpenMetrics data collection methods |
| Uses a text-based format that is easy to read and parse, reducing the complexity of implementing metrics collection and sharing |
Key Features/Uses
- Standardization of Prometheus metrics format
- Focused on metrics collection and export
- Integration with monitoring systems like Prometheus
- Can configure identifiers to link specific metrics to related traces
Conclusion
OpenTelemetry, OpenTracing, and OpenMetrics are all CNCF projects that provide insights into complex software environments. The OpenTracing project has been archived (as intended) after merging it with another observability framework to form OpenTelemetry. Meanwhile, OpenTelemetry and OpenMetrics reached an incubating maturity level, which essentially means they are considered stable and are used successfully in production environments.
All three are specifications related to observability in software systems. If you’re new or trying to achieve first-class observability, consider adding them to your observability toolbox.
OpenTelemetry vs Open Tracing vs Open Metrics FAQs
What is the difference between OpenTelemetry tracing and metrics?
OpenTelemetry tracing describes and contextualizes what happens when a request is made to an application. Meanwhile, a metric is the measurement of a service captured at a specific point in time.
What is the difference between OpenMetrics and OpenTelemetry?
OpenMetrics standardizes the format for metric data, while OpenTelemetry is a comprehensive observability framework.
What is the difference between OpenTracing and OpenMetrics?
OpenTracing and OpenMetrics differ in goals. OpenTracing aims to create a standard for distributed tracing, while OpenMetrics focuses on creating a standard format for exposing metric data.
What is the difference between OpenTelemetry and OpenTracing?
OpenTracing focuses only on distributed tracing. Meanwhile, OpenTelemetry has a broader scope, which includes metrics and logs.