Understanding OpenTelemetry Metrics: Types, Model, Collection, and Best Practices
OpenTelemetry is an open-source, cloud-native observability framework that provides common standards for telemetry data collection and processing across vendors. It includes the tools, APIs, and SDKs for instrumenting, generating, collecting, and exporting telemetry data.
Among OpenTelemetry’s key components is OpenTelemetry Metrics, which provides a standard for collecting, aggregating, and sending metric data from the application source to OpenTelemetry-integrated observability backends, like Prometheus or Edge Delta. It provides consistent insight into the behavior of distributed systems, especially when paired with powerful monitoring techniques like tracing.
Continue reading to learn how to achieve this through integrating OpenTelemetry metrics into your systems.
Key Takeaways
- OpenTelemetry supports many metric types (counts, gauges, and histograms) for capturing and measuring data about different aspects of your application.
- Metric data models are used to represent instances of measurements, transport, and storage.
- The main components of the OpenTelemetry metrics API are the meter provider, meter, and instruments.
- OpenTelemetry metric usage can be maximized by precise metric recording, the intelligent usage of labels and attributes, and more.
What are OpenTelemetry Metrics?
Metrics are values which capture information during runtime about the state of your environment. OpenTelemetry Metrics conform to this definition, but add a standardized structure to ensure consistent collection of metric data, regardless of environment or vendor(s) used. It also includes the instrumentation practices for capturing or exporting metric data.
Here are some OpenTelemetry Metric examples:
- HTTP Response Time
- Error Rate
- Throughput
- Network Latency
- Database Queries
OpenTelemetry metrics have three primary goals:
- To connect aggregated metrics to other signals for correlation and enriching attributes.
- To provide a path for OpenCensus users for OpenTelemetry migration.
- To work with existing metrics instrumentation protocols and standards.
With these features, you can ensure compatibility and send OpenTelemetry metrics to any platform supporting metrics standards such as Prometheus.
Adopting OpenTelemetry Metrics will will help you measure, monitor, compare performance and identify trends and patterns. Aggregation also helps improve reliability and cost optimization, all in the goal of achieving total observability across various components and services.
Learn more about the three metric types in OpenTelemetry below.
Related Articles
For those new to OpenTelemetry, here are some helpful articles to get you started:
How OpenTelemetry is eating the world
What Is OpenTelemetry Observability, and how can you benefit from it?
3 Types of Metrics in OpenTelemetry + Examples
OpenTelemetry supports many metric types to accommodate diverse monitoring needs. The common OpenTelemetry metric examples are counters, gauges, and histograms. Moreover, these metrics can be synchronous, additive, and monotonic:
- Synchronous: refers to an instrument instance that occurs while the event is being measured
- Additive: Summable instruments generate time series. When aggregated, they yield an additional meaningful time series.
- Monotonic: Additive instruments that measure non-decreasing numbers.
Here are a few of the metric types supported by OpenTelemetry:
| Metric Type | Description | Use Case / Example Measurements | Synchronous | Additive | Monotonic |
|---|---|---|---|---|---|
| Counter | An instrument that measures values that only increase over time or resets | To count things and compute the rate at which things happen, it can be used to monitor system activity and workload | ✅ | ✅ | ✅ |
| Gauges | An instrument for periodically taking measurements/snapshots of a metric at a single point in time. Value can arbitrarily increase or decrease over time | Suitable for tracking values that can go up and down but don’t need to know the rate of change, one example is the count of active connections on your application | ✖️ | ✖️ | ✖️ |
| Histograms | A synchronous instrument that samples observations and counts them in configurable buckets | It can be used to report arbitrary values that are statistically meaningful, request duration and response size are examples | ✅ | ✖️ | ✖️ |
Tracking the above metrics enable you to spot anomalies, optimize application performance, add layers of reliability, and more. Check out examples of each metric below:
Counter
A counter is an instrument that measures additive, non-decreasing values. Counters are cumulative, keeping a running total of events, making them helpful in tracking rates.
You can use a counter for tracking the following:
- Number of requests
- Number of errors that occur
- Number of disk reads
- Number of completed tasks
Gauges
Gauges are numbers whose value can arbitrarily increase or decrease over time. In the OpenTelemetry protocol (OTLP), a gauge represents a sampled value at a given time.
Compared with counters, Gauges are not cumulative and only reflect the current value. A gauge metric can measure the following:
- Amount of memory utilized by your application
- Number of active connections to your service
- Current CPU usage
Histograms
A histogram is a metric that conveys a population of recorded values and counts them in a compressed format.
For instance, a histogram can capture the distribution of your server’s response times. Such measurement is used to compute percentiles on them. A histogram then divides the range of measurements into buckets and counts the number of values that fall into each one.
In OpenTelemetry, histograms are represented as a collection of buckets. One bucket represents a range of values and items falling within that range.
Here’s an example of what a histogram might look like:
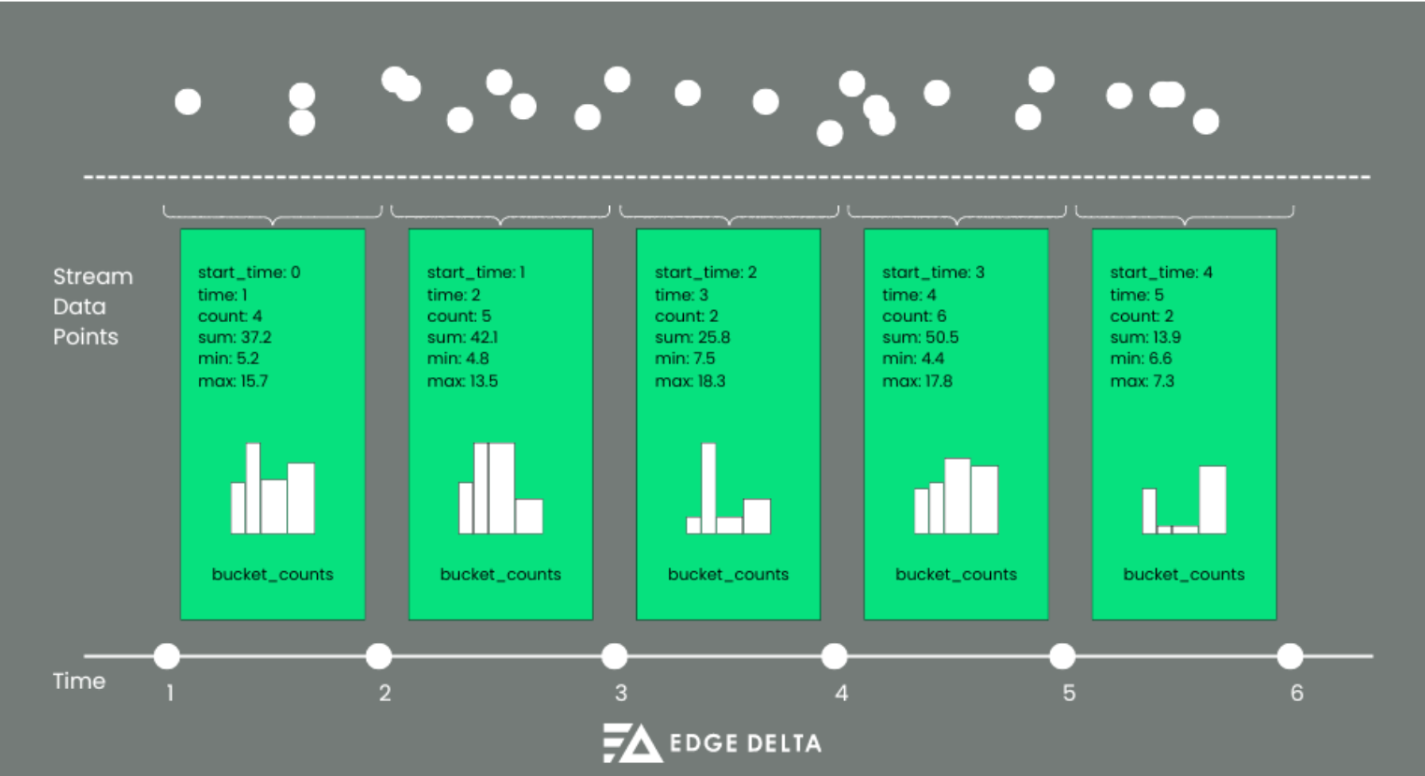
This image depicts how the histogram bundles the sets of events into segments, based on time of occurrence. This structure allows for efficient analysis of large quantities of data, as you can zero in on the segment which is the most problematic.
OpenTelemetry Metric Data Model
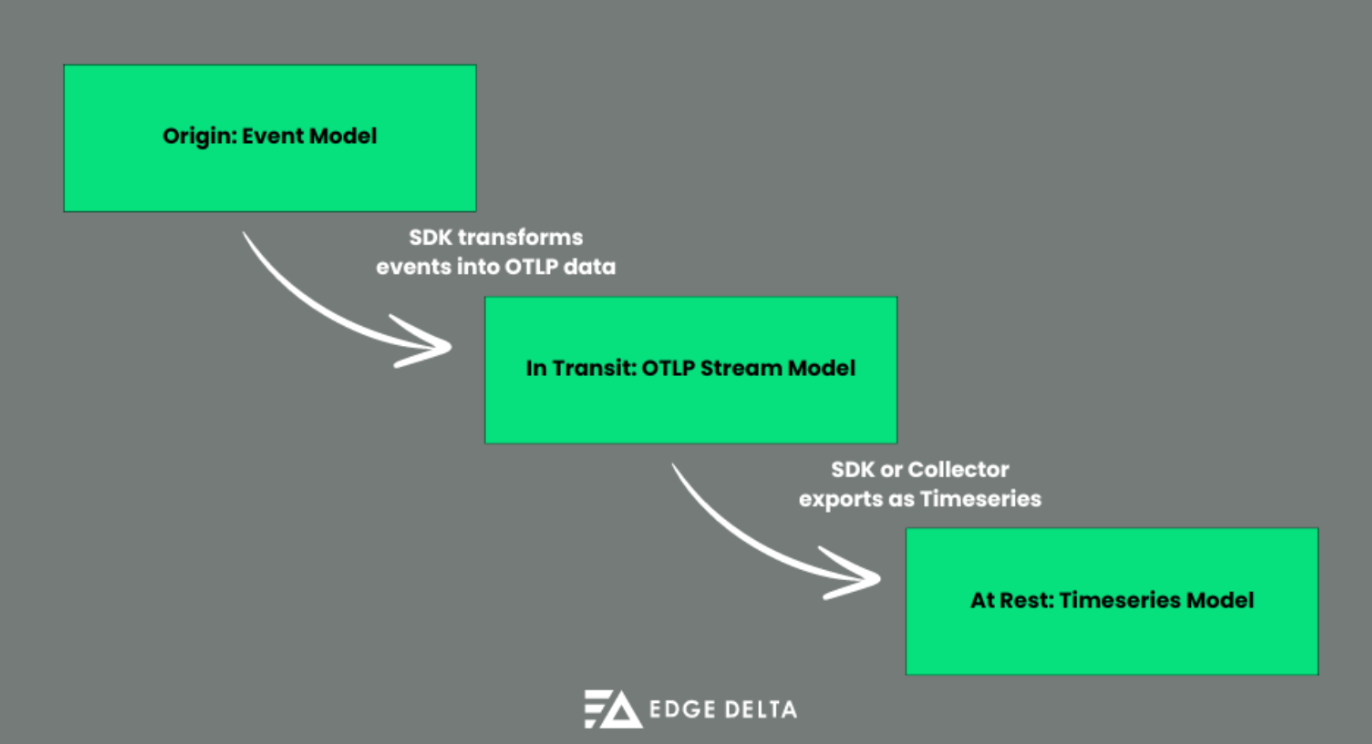
OpenTelemetry has a data model, which standardizes the process of collecting, aggregating, and exporting metric data. The model includes three key pieces in its flow:
- Origin: Event Model
- In Transit: OTLP Stream Model
- At Rest: Time-Series Model
Here is a diagram of this flow:
Event Model
The event model describes the standard for how OpenTelemetry reports metric data. It is comprised of OpenTelemetry Metric Instruments, which report pre-defined measurements (which ultimately become the metrics which we are referring to) via events. The events are aggregated or processed in some way (SUM, MAX, etc) and then shipped off to the Metric Data Stream model.
This structure enables you to own a flexible structure for capturing values and contextual information, and is useful for spotting exact moments of interest within a system, like load or error spikes during execution.
OpenTelemetry events can help you track occurrences and details of specific system events. With these metrics, you can improve your system analysis and troubleshooting. Events aggregation will reveal patterns over time and insights into your system’s health.
Data Stream
The Data Stream model receives event data transmitted from the Event Model, and processes it into data in the OTLP format. Fundamentally it is a continuous stream of measurement data, and runs processes to convert it into the OpenTelemetry format, to enable downstream processes to interact with it in an expected format.
Although it may seem more logical to ship event data directly to a backend and do the data conversion on the fly, this is practically impossible in today’s world with incredibly large quantities of observability data. It is much easier to introduce another separate component to handle this aggregation and formatting, in between the data source and final destination.
Time-Series
Once the data is converted into the OTLP format via the Data Stream, the Time-Series model exports it as Timeseries.
A Timeseries contains several metadata properties, including:
- Metric name
- Attributes
- Value type (integer or float, for example)
- Unit of measurement
Data of each time-series are ordered points with one of the following:
- Counter
- Gauge
- Histogram
- Exponential Histogram
where each point contains a timestamp and a corresponding value.
Once created, it can be streamed to an observability backend, creating the conventional metrics used for monitoring application and environment health.
How Metrics are Collected in OpenTelemetry Metrics API
The OpenTelemetry metrics API has a set of interfaces and methods for creating, managing, and recording metrics. It defines the core concepts and operations for working with metrics.
The OpenTelemetry metrics API allows you to instrument your code to collect various metrics. It is designed to do the following:
- Capture raw measurements efficiently and simultaneously
- Decouple the instrumentation from the SDK for specification and inclusion
The metric collection process in the OpenTelemetry Metrics API involves the meter provider, meter, and instruments.
Meter Provider
The first step in metering with OpenTelemetry is using the meter provider. This tool gives you access to meters you will use to create instruments and record metric values.
A meter provider is an API entry point responsible for creating and managing meter instances. Meter instances are used to capture metrics.
The provider here ensures meters are within a consistent configuration. It facilitates the standardized collection of metric data in an application.
Through a meter provider, you can configure global settings for metric collection. This function includes the following:
- Defining which metrics to collect
- Setting collection intervals
- Specifying a destination for exported metrics
Meter
A meter is an instrument within the OpenTelemetry Metrics API created/managed by meter providers. It facilitates the capture of metrics.
Meters provide methods for creating and recording metric instruments (counters, gauges, histograms, and summaries). As many meters as needed can be used, each with a name, label, and version number.
Each meter is associated with a specific component/library. This function allows metrics to be collected in an organized way.
Instruments
In OpenTelemetry, instruments are tools for recording measurements about a service at runtime. Instruments support many metric types to ensure you capture data most relevant to your objectives.
Instruments are the endpoint of a metric API. It has the following:
- A label name
- Type
- Kind
- A unit of measurement (optional)
- Clear description text (optional)
The instrument details show that measurements are exported from within an application. Instruments also provide an interface for recording measurements, which eases the complexities of metric aggregation/reporting.
Pro Tip
Leverage instruments to capture a range of metrics, from basic counts to complex histograms.
Best Practices for Using OpenTelemetry Metrics
OpenTelemetry is growing in the observability community. It is an evolving project, and as new features are introduced, best practices may change over time.
By learning OpenTelemetry’s latest and best practices, you can maximize its benefits. It will also help you:
- Ensure that you instrument your code efficiently
- Improve consistency in instrumentation across different components
- Enhance interoperability with other tools and services
Establish a Naming Convention
Semantic conventions specify common names for different kinds of operations and data. Using this data means following a standard naming scheme that can be standardized across your codebase, libraries, and platforms.
Establishing semantic, descriptive, and concise names for instruments, keys, and dimensions enhances observability. This step is handy in case of an error because it makes root cause analysis more efficient.
A consistent naming convention also helps avoid confusion and ensures easy identification and aggregation. It simplifies management, making it easier to correlate and interpret significance.
Record Metrics with Precision and Purpose
With precise recording of metrics, you can ensure accurate and meaningful data capture. Select the appropriate metric types and instruments if you want to avoid mistakes. When reporting metrics, prioritize the most actionable information.
Purposeful reporting helps maximize the value of your collected metrics. For instance, you should track request latencies accurately. This step will help you with a detailed performance analysis.
Use OpenTelemetry Labels and Attributes Well
Enriching metric data with contextual details eliminates data silos and enables insightful analysis. Labels and attributes help you achieve this by augmenting your metric data with specific and informative details.
While the concept of OpenTelemetry labels is advantageous, applying too many may result in an overabundance of metric dimensions. This issue consequently leads to complicated analysis and storage.
Monitor and Optimize the Telemetry Pipeline
Observability pipelines are systems that manage how telemetry data flows from applications and infrastructure to observability backends and platforms. They guide the data from its origin to final destinations, and support data processing and transformation along the way.
To ensure effective use of OpenTelemetry metrics, verify the efficacy and reliability of your pipeline. This can be achieved by monitoring for bottlenecks and delays, and optimizing performance.
Develop a routine for reviewing and adjusting configurations (such as sampling rates) to enhance pipeline capabilities. Active monitoring ensures high-quality metric collection and reporting, maintaining the health of monitoring systems.
Pro Tip
Choosing labels with meaningful differentiation is wiser to ensure the dataset is manageable. Carefully plan the application of attributes to enhance the utility of metrics.
Conclusion
OpenTelemetry metrics are invaluable for performance monitoring, error detection, resource management, and consistent observability. It accommodates metric types that meet the requirements for most use cases.
Metrics are one of the three pillars of observability (Logs, Metrics, Traces), and OpenTelemetry metrics typically serves as the standard for metrics collection across various observability platforms. While the metric collection process is straightforward, it necessitates an understanding of the underlying concepts.
Effectively leveraging OpenTelemetry metrics is crucial for gaining actionable insights into the performance, reliability, and efficiency of your software systems.
FAQs on OpenTelemetry Metrics
What is OpenTelemetry metrics?
OpenTelemetry metrics is a standard for collecting, aggregating, and exporting Timeseries metrics. It transforms telemetry data from diverse sources into a uniform format, enabling downstream observability platforms to efficiently analyze and manage your Timeseries metrics.
What is the sum metric of OpenTelemetry?
The sum metric in OpenTelemetry includes aggregation temporality options of delta or cumulative. It also indicates whether the sum is monotonic. In metrics, the sum increases, which is generally assumed.
What is telemetry data vs metrics?
In observability, telemetry data comprises logs, metrics, and traces gathered for monitoring, troubleshooting, alerting, and visualizing application or infrastructure health and performance. Metrics, a specific type of telemetry data, represent values measured over time.
How do you visualize OpenTelemetry metrics?
You can visualize OpenTelemetry metrics by exporting them to observability backends or Timeseries databases. Commonly used open-source tools include Prometheus or Grafana. Alternatively, enhance your metric analysis processes by leveraging Edge Delta’s visual pipelines.